Get Data
Summary:
This model product provides the Fortran 77 source code for the Lund-Potsdam-Jena (LPJ) Wetland Hydrology and Methane Dynamic Global Vegetation Model (LPJ-WHyMe v1.3.1), auxiliary C++ routines, ASCII and NetCDF input data, and NetCDF example output data. LPJ-WHyMe v1.3.1 simulates peatland hydrology, permafrost dynamics, peatland vegetation, and methane emissions.
The model processes can be simulated on an area-averaged 0.5 or 1.0 degree grid cell basis at global, regional, or site scales and on a daily, monthly, or annual time step as appropriate. Input driver data are monthly mean air temperature, total precipitation, percentage of full sunshine, annual atmospheric CO2 concentration, and soil texture class. The simulation for each grid cell begins from "bare ground", requiring a "spin up" (under non-transient climate) of ca. 1,000 years to develop equilibrium vegetation, carbon, and soil structure. Model simulations compare favorably, with some exceptions, to field observations collected from peatland sites (e.g., Degero, Sweden; Lakkasuo, Finland; BOREAS Northern Study Area, Canada; and others) and non-peatland sites (e.g., Point Barrow, Alaska, and Spasskaya, Siberia).
LPJ-WHyMe is a further development of LPJ-WHy, which dealt with the introduction of permafrost and peatlands into LPJ. Implementing peatlands in LPJ required the addition of two new plant functional types (PFTs) (flood tolerant C3 graminoids and Sphagnum mosses) to the already existing ten PFTs, the introduction of inundation stress for non-peatland PFTs, a slow-down in decomposition under inundation, and the addition of a root exudates pool. LPJ-WHyMe v1.3.1 adds a methane model subroutine.
This model product has one compressed data file (*.zip) and seven companion files.
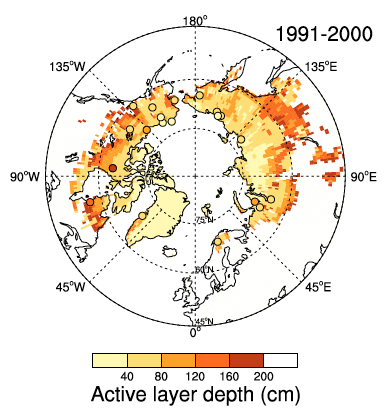
Figure 1. Permafrost distribution and comparison of simulated and observed active layer depth for the region 45-90 N. The underlying map shows results from a LPJ-WHy simulation averaged over the years 1991-2000 while the dots are observations from the same period, where available. Nonwhite areas indicate regions where LPJ-WHy simulates permafrost in the top 2 m of soil. Source: Wania et al. (2009a).
![]()
Figure 2. Annual evapotranspiration for peatland grid cells simulated with LPJ-WHy, averaged over 1991-2000 using the CRU TS 2.1 data set. Evapotranspiration values are not weighted by the fraction of peatlands; that is, the values are representative only for the peatland area in each grid cell. Source: Wania et al. (2009a)
Data Citation:
Cite this data model as follows:
Wania, R., I. Ross, and I.C. Prentice. 2013. Lund-Potsdam-Jena Wetland Hydrology and Methane DGV Model (LPJ-WHyMe v1.3.1). ORNL DAAC, Oak Ridge, Tennessee, U.S.A. http://dx.doi.org/10.3334/ORNLDAAC/1150
Model Product Description:
Model Documentation and User's Guide
Target Computer Platform: The model can be run on any platform.
Model Build Environment: Fortran 77, NetCDF, and C++. The code can be compiled by using freely available compilers such as ifort, GFortran, and gcc.
Additional Analysis Environment Requirements: LPJ-WHyMe v1.3.1 produces NetCDF files, which can be processed and viewed in any suitable environment, many of which are freely available software packages (e.g., CDO or NCO tools to analyze data; Ferret or NCL to view and plot data). For documentation purposes, LPJ-WHyMe v1.3.1 as distributed herein was built using the 3.6.0 release of NetCDF, and the GNU compiler collection.
Site boundaries: (All latitude and longitude given in degrees and fractions)
| Site (Region) | Westernmost Longitude | Easternmost Longitude | Northernmost Latitude | Southernmost Latitude |
|---|---|---|---|---|
| Global (spatial extent of *.nc files in the /global_data subdirectory) | -180.00 | 180.00 | 90.00 | -60.00 |
| Degero, Sweden (example site, spatial extent of *.nc files in the /data subdirectory) | 19.75 | 19.75 | 64.25 | 64.25 |
Model Description
The Lund-Potsdam-Jena Wetland Hydrology and Methane DGV Model (LPJ-WHyMe) is a development of the Lund-Potsdam-Jena Dynamic Global Vegetation Model (LPJ) originally described by Sitch et al. (2003) and Gerten et al. (2004). LPJ is a process-based model that simulates plant physiology, carbon allocation, decomposition, and hydrological fluxes. Vegetation is defined in the model by plant functional types (PFTs) that group plants with similar traits. Each PFT is described by allocating specific parameters that distinguish one PFT from another. PFTs thus occupy different environmental niches defined by bioclimatic limits and physiological optima and compete for resources such as light and water. This competition determines the simulated vegetation composition.
LPJ was modified to include new components for modeling peatlands and permafrost ecosystem dynamics (i.e., Lund-Potsdam-Jena -Wetland Hydrology Dynamic Global Vegetation Model (LPJ-WHy v1.2) in Wania et al., 2009a, b) and simulate methane emissions (i.e., LPJ-WHyMe v1.3.1) in Wania et al., 2010). Modifications include the following:
- A soil temperature solver was implemented to simulate temperature changes as a function of depth.
- The LPJ hydrology module was split into two parts: one for non-peatland sites and one for peatlands. For non-peatline sites, the scheme of Gerten et al. (2004) was modified to enable the simulation of freeze-thaw cycles and to adapt the model to more soil layers than previously used; for organic soils, a new parameterization appropriate for peatlands that captures the diplotelmic nature of peat (i.e., an acretelm and catotelm) was used (Ingram, 1978).
- The treatment of surface snowpack was modified to include some of the effects of snow ageing. Snow density now varies with snow age instead of being fixed, allowing for changes in thermal insulation properties.
- Two new PFTs, namely flood-tolerant C3 graminoids and Sphagnum mosses were added to the ten existing plant functional types in LPJ.
- An inundation stress mechanism was introduced, reflecting the decrease in productivity experienced by nonflood-adapted PFTs under anoxic conditions.
- Root exudates were added to LPJ. A fraction of the net primary production is put into an exudates pool, which is then either respired as CO2 (or in LPJ-WHyMe v1.3.1 used to generate methane).
- Decomposition rates are slowed under inundation.
- For the calculation of decomposition, litter accumulation is spread equally over twelve months instead of being added to the litter pool all at once in January.
- Leaf dark respiration is simulated in a consistent way related to carboxylation capacity.
- A methane module was added to the LPJ-WHyMe v1.3.1 source code. See Wania et al (2010) for a discussion of the basic concept of the methane model in LPJ-WHyMe v1.3.1.
The revised model can be used to study soil temperature, active layer depth, permafrost distribution, and water table position and to simulate net ecosystem production, net primary production, heterotrophic respiration, soil carbon content, and methane emissions in peatlands and permafrost ecosystems.
The model version being archived herein is LPJ-WHyMe v1.3.1. The addition of a methane model did not require any changes to the rest of the model as the development of LPJ-WHy was targeted towards later inclusion of a methane model. A separate subroutine containing the methane model was simply added to the program. All of the input variables required to drive the methane model were already available (and are included in this model product). This feature distinguishes LPJ-WHyMe from other methane modeling approaches, where output from vegetation models that took no account of changes in vegetation due to inundation were used to drive methane models, neglecting the potential effects of changes in vegetation composition, reduction in net primary production, and the deceleration of decomposition. This model product includes the source code for LPJ-WHyMe v1.3.1, auxiliary code routines, input and output data files, and documentation files.
The model source code comprises two modules: the main source code program and an input/output module. The two modules are compiled and linked to produce a single executable file. The main program and input/output module are linked through calls in the main program to six subroutines in the input/output module. Specifications of input/output subroutines are given in the source code file. Declarations and descriptions of argument variables and important notes are found in the variable declarations section of the main program.
The model processes can be simulated on an area-averaged 0.5 or 1.0 degree grid cell basis at global, regional, or site scales and on a daily, monthly, or annual time step as appropriate. Input driver data are monthly mean air temperature, total precipitation and c percentage of full sunshine, annual atmospheric CO2 concentration and soil texture class. The simulation for each grid cell begins from "bare ground", requiring a "spin up" (under non-transient climate) of ca. 1,000 years to develop equilibrium vegetation and soil structure.
Vegetation is represented by a combination of the following plant functional types (PFTs):
1. tropical broadleaved evergreen tree
2. tropical broadleaved rain green tree
3. temperate needleleaved evergreen tree
4. temperate broadleaved evergreen tree
5. temperate broadleaved summer green tree
6. boreal needleleaved evergreen tree
7. boreal needleleaved summer green tree
8. boreal broadleaved summer green tree
9. C3 perennial grass
10. C4 perennial grass
11. flood tolerant C3 graminoid (e.g., Carex spp., Eriophorum spp.,
Juncus spp., Typha spp.)
12. Sphagnum moss
A minimum set of bioclimatic limits constrain PFT occurrence and regeneration within grid cells. These limits are minimum coldest month temperature for survival, maximum coldest month temperature for establishment, and minimum growing degree days (GDD, on 5 degree base except for larches (2 degrees)) for survival. Woody PFTs (1-8 above) present within a given grid cell are represented by area-averages for the following state variables: individual density (/m2); individual leaf carbon mass (g C); individual fine root carbon mass (g C); individual sapwood carbon mass (g C); individual heartwood carbon mass (g C); and individual crown area (m2). See the main source code file <lpjmain.f> for details.
Data Files and Model Source Code
There is one compressed .zip file with this model product, LPJ-WHyMe_v1-3-1.zip. When uncompressed, this zip file contains the following folders:
/src/: contains 10 source code files
/utils/: contains 6 auxiliary code files required to compile
the model
/data/: contains the example data for Degero, Sweden
/global_data/: contains example input data for the globe
/sample_output/: example output produced by running the
model using the example data for Degero, Sweden, located in the /data
subdirectory
Folder: /src/ (source code files, all in ASCII text file format)
| Component File Names | Description |
|---|---|
| lpjmain.f | Main LPJ-WHyMe v1.3.1 source code (Fortran 77). Contains all the subroutines and changes described in Wania et al. (2009a, b; 2010) |
| lpj.cfg | Configuration file for the model. It defines paths and input/output files and variables. |
| lpjio.cpp | C++ driver for LPJ-WHyMe v1.3.1 used to handle input and output files. Each line of this file is of the form <key>; <value>. Written by Ian Ross.) See companion file <Using-The-NetCDF-Driver.txt> for details. |
| inputvars.cb | Common block containing definition of climate input variables |
| params.cb | Common block containing parameter values |
| soilvars.cb | Common block containing definition of soil relevant variables |
| vegvars.cb | Common block containing definition of vegetation relevant variables |
| ch4vars.cb | Common block containing definition of methane relevant variables |
| pftin.dat | Plant functional type parameter file |
| Makefile | File to link and compile the code |
Folder: /utils/ (auxiliary code files each in ASCII text file format)
| Component File Names | Description |
|---|---|
| apply-base.cpp | C++ auxiliary code files for the use of the input/output driver (lpjio.cpp), which uses NetCDF files as input and output |
| Array.cpp | C++ auxiliary code files for the use of the input/output driver (lpjio.cpp), which uses NetCDF files as input and output |
| Array.hh | C++ header code files for use by the input/ output driver (lpjio.cpp), which uses NetCDF files as input and output |
| clamp-value.cpp | C++ auxiliary code files for the use of the input/output driver (lpjio.cpp), which uses NetCDF files as input and output |
| regrid-motif-lpj-data.cpp | C++ auxiliary file that regrids NetCDF file containing LPJ driver data from whatever grid the data are on to a 0.5 or 1.0 degree grid |
| Makefile | File to link and compile the above files |
Folder: /data/ (data files in NetCDF file format for the Degero site in Sweden)
| Component File Names | Description | |
|---|---|---|
| lpj_soil_type.nc | Soil type map (1.0 degree resolution) | |
| lpj_land_mask.nc | Land/Ocean mask (1.0 degree resolution) | |
| wetdays.nc | number of monthly mean wet days* |
|
| tas.nc | Monthly mean temperature in degrees C* | |
| pr.nc | Monthly mean precipitation in mm per month* | |
| clt.nc | Monthly mean cloud cover in percent (%)* |
Note: * indicates that these subsets for the Degero site in Sweden are from the CRU CL 1.0 climatolgy (New et al., 1999).
Folder: /global_data/ (data files in NetCDF file format for the region 60oS to 90oN latitude)
| Component File Names | Description |
|---|---|
| co2-1901-2002.txt | ASCII text file containing atmospheric carbon dioxide concentrations (ppmv) taken from Etheridge et al. (1996) and Keeling and Whorf (2005). |
| lpj_soil_type.nc | Soil type map (1.0 degree resolution) based on the FAO data set (Zobler, 1986; Sitch et al., 2003) overlain by soil organic carbon data from the IGBP-DIS map (Global Soil Data Task Group, 2000) |
| lpj_land_mask.nc | Land/Ocean mask (1.0 degree resolution) |
Note: In addition to these three input data files, global climate driver data are taken from the Climate Research Unit climatology data set CRU CL 1.0 (1961-1990) and time series data CRU TS 2.1 (1901-2002) New et al., 1999; Mitchell and Jones, 2005, respectively). Both the CRU data sets provide monthly air temperature, cloud cover, total precipitation, and number of wet days at 0.5 degree resolution. These data are not included herein but can be downloaded from the CRU [http://www.cru.uea.ac.uk/cru/%20data/hrg.htm]. The first 10 years of the CRU data are repeated 100 times to give 1,000 years of model spin-up. This ensures that carbon stocks for non-peatlands are in equilibrium before the model is driven with the data spin-up time. During spin-up only, an extra 0.5 mm/da run-on forcing for peatland sites is included to avoid large vegetation fluctuations caused by climatic oscillations.
Folder: /sample_output/ this is the output data in NetCDF file format for the Degero site in Sweden.
| Component File | Description |
|---|---|
| out-1102.nc | Example model output data for the Degero site in Sweden |
Running LPJ-WHyMe v1.3.1
To run LPJ-WHyMe v1.3.1 using the provided test data:
1. In the /utils/ directory, ensure that all paths are set correctly in the Makefile. Then type make.
2. In the /src/ directory, ensure that all paths are set correctly in the Makefile. Then type make.
3. Copy the files (pftin.dat and lpj.cfg) and the model executable (lpj-whyme) from the /src subdirectory
to the /data subdirectory.
4. From the /data subdirectory, execute the model by typing lpj-whyme.
5. An output file called out-1102.nc will be produced.
6. Note that you can change the name of the output file by editing the lpj.cfg file.
Companion Files
| File Names | DESCRIPTION |
|---|---|
| Readme.pdf | Additional documentation for LPJ-WHyMe v1.3.1 |
| Readme.tex | |
| Readme.dtx | |
| Using-The-NetCDF-Driver.txt | Provides notes on using Ian Ross's NetCDF LPJ driver |
| Crank_Nicolson_scheme.pdf | This file describes the Crank-Nicolson finite-difference scheme used to solve the heat diffusion equation in Wania et al. (2009a). |
| ferret.jnl | This is a sample FERRET program. |
| LPJ-WHyMe_V1-3-1.pdf | This is a pdf of this html guide document |
Data Access:
This model product is available through the Oak Ridge National Laboratory (ORNL) Distributed Active Archive Center (DAAC).
Data Archive Center:
Contact for Data Center Access Information:
E-mail: uso@daac.ornl.gov
Telephone: +1 (865) 241-3952
References
Etheridge, D.M., L.P. Steele, R.L. Langenfelds, R.J. Francey, J.M. Barnola, and V.I. Morgan. 1996. Natural and anthropogenic changes in atmospheric CO2 over the last 1,000 years from air in Antarctic ice and firn. J. Geophys. Res., 101(D2): 4115-4128. doi:10.1029/95JD03410
Gerten, D., S. Schaphoff, U. Haberlandt, W. Lucht, and S. Sitch. 2004. Terrestrial vegetation and water balance: hydrological evaluation of a dynamic global vegetation model. J. Hydrol., 286: 249-270. doi:10.1016/j.jhydrol.2003.09.029
Global Soil Data Task Group. 2000. Global Gridded Surfaces of Selected Soil Characteristics (IGBP-DIS). [Global Gridded Surfaces of Selected Soil Characteristics (International Geosphere-Biosphere Programme - Data and Information System)]. Data set. Available on-line [http://daac.ornl.gov] from Oak Ridge National Laboratory Distributed Active Archive Center, Oak Ridge, Tennessee, U.S.A. doi:10.3334/ORNLDAAC/569
Ingram, H.A.P. 1978. Soil layers in mires: function and terminology. J. Soil Sci. 29(2): 224-227. doi:10.1111/j.1365-2389.1978.tb02053.x
Keeling, C.D., and T.P. Whorf. 2005. Atmospheric CO2 records from sites in the SIO air sampling network. In Trends: A Compendium of Data on Global Change. Digital data. Available on-line [http://cdiac.esd.ornl.gov/trends/co2/sio-mlo.html] from Carbon Dioxide Information Analysis Center, Oak Ridge National Laboratory, Oak Ridge, Tennessee, U.S.A.
Mitchell, T.D. and P.D. Jones. 2005. An improved method of constructing a database of monthly climate observations and associated high-resolution grids. Int. J. Climatol. 25(6): 693-712. doi:10.1002/joc.1181
New, M., M. Hulme, and P.D. Jones. 1999. Representing twentieth century space-time climate variability. Part 1: Development of a 1961-1990 mean monthly terrestrial climatology. J. Clim. 12: 829-856. doi:http://dx.doi.org/10.1175/1520-0442(2000)013<C2217:RTCSTC>E2.0.CO;2
New, M., M. Hulme, and P.D. Jones. 2000. Global Monthly Climatology for the Twentieth Century (New et al.). Data set. Available on-line [http://daac.ornl.gov] from Oak Ridge National Laboratory Distributed Active Archive Center, Oak Ridge, Tennessee, U.S.A. http://daac.ornl.gov/cgi-bin/dsviewer.pl?ds_id=551
Sitch, S., B. Smith, I.C. Prentice, A. Arneth, A. Bondeau, W. Cramer, J. O. Kaplan, S. Levis, W. Lucht, M. T. Sykes, K. Thonicke, and S. Venevsky. 2003. Evaluation of ecosystem dynamics, plant geography, and terrestrial carbon cycling in the LPJ dynamic global vegetation model. Global Change Biology 9: 161-185. doi:10.1046/j.1365-2486.2003.00569.x
Wania R. 2007. Modelling northern peatland land surface processes, vegetation dynamics and methane emissions. Ph.D. Thesis, University of Bristol, United Kingdom.
Wania, R., I. Ross, and I.C. Prentice. 2009a. Integrating peatlands and permafrost into a dynamic global vegetation model: 1. Evaluation and sensitivity of physical land surface processes. Global Biogeochem. Cycles 23: GB3014. doi:10.1029/2008GB003412
Wania, R., I. Ross, and I.C. Prentice. 2009b. Integrating peatlands and permafrost into a dynamic global vegetation model: 2. Evaluation and sensitivity of vegetation and carbon cycle processes. Global Biogeochem. Cycles 23: GB3015. doi:10.1029/2008GB003413
Wania, R., I. Ross, and I.C. Prentice. 2010. Implementation and evaluation of a new methane model within a dynamic global vegetation model: LPJ-WHyMe v1.3.1. Geosci. Model Dev. 3: 565–584. doi:10.5194/gmd-3-565-2010