Documentation Revision Date: 2020-03-26
Dataset Version: 1.1
Summary
The data used in the research were from a variety of sources. Tree AGC was estimated using three tree above-ground biomass (AGB) geospatial datasets together with information on the fraction of dry biomass that is carbon. Forest fire data were from annual maps of fire severity from 2003-2012 produced by the Monitoring Trends in Burn Severity (MTBS) project. Bark beetle data were from annual maps depicting the areal extent of tree canopy mortality due to 12 bark beetle species produced from aerial surveys, forest inventory measurements, and high-resolution satellite imagery.
User Note: This is Version 1.1 of this dataset. These revised data, released March 2020, supersede the previous version. See Section 8 of this guide for details.
There are 40 data files in GeoTIFF (.tif) format with this dataset for the period 2003-2012. This includes 10 files of tree mortality from beetles and 10 files for the standard deviation, and 10 files for tree mortality due to fires and 10 files for the standard deviation.
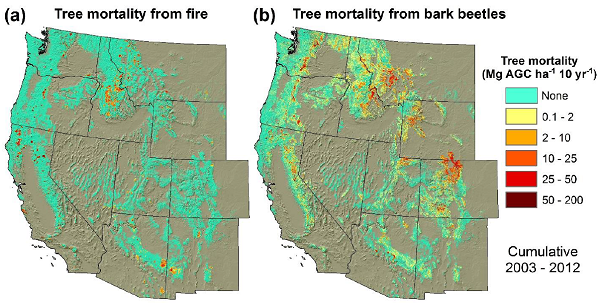
Figure 1. Cumulative tree mortality due to (a) fires and (b) bark beetles from 2003-2012 on forestland in the western United States. Tree mortality was quantified as the amount of aboveground carbon (AGC) stored in tree biomass killed by disturbance (e.g., Mg AGC ha-1) (Berner et al., 2017).
Citation
Berner, L.T., B.E. Law, A.J. Meddens, and J.A. Hicke. 2019. Tree Mortality from Fires and Bark Beetles at 1-km Resolution, Western USA, 2003-2012. ORNL DAAC, Oak Ridge, Tennessee, USA. https://doi.org/10.3334/ORNLDAAC/1512
Table of Contents
- Dataset Overview
- Data Characteristics
- Application and Derivation
- Quality Assessment
- Data Acquisition, Materials, and Methods
- Data Access
- References
- Dataset Revisions
Dataset Overview
This dataset provides annual estimates of tree mortality due to fires and bark beetles from 2003 to 2012 on forestland in the continental western United States. Tree mortality was estimated at 1-km spatial resolution by combining tree (AGC) and disturbance datasets derived largely from remote sensing. Tree mortality is expressed as the amount of AGC stored in trees killed by disturbance (Mg carbon per km2). The dataset also includes annual uncertainty maps that were generated using a Monte Carlo approach in which tree biomass, biomass carbon content, and disturbance severity were iteratively varied by their uncertainty.
The data used in the research were from a variety of sources. Tree AGC was estimated using three tree AGB geospatial datasets together with information on the fraction of dry biomass that is carbon. Forest fire data were from annual maps of fire severity from 2003-2012 produced by the MTBS project. Bark beetle data were from annual maps depicting the areal extent of tree canopy mortality due to 12 bark beetle species produced from aerial surveys, forest inventory measurements, and high-resolution satellite imagery.
User Note: This is Version 1.1 of this dataset. These revised data, released March 2020, supersede the previous version. See Section 8 of this guide for details.
Related Publication:
Berner, L. T., B. E. Law, A. J. Meddens, and J. A. Hicke (2017), Tree mortality from fires, bark beetles, and timber harvest during a hot and dry decade in the western United States (2003–2012), Environmental Research Letters, 12(6), 065005. https://doi.org/10.1088/1748-9326/aa6f94
Acknowledgements:
Logan Berner was supported by the NASA Earth and Space Science Fellowship Program (Grant NNX14AN65H) and by the ARCS Foundation Scholar program. Beverly Law and Jeffrey Hicke were supported by the USDA National Institute of Food and Agriculture (Grant 2013-67003-20652). Arjan Meddens was supported by the Interior Northwest Climate Science Center (NW CSC) through a Cooperative Agreement (G14AP00177) from the United States Geological Survey (USGS).
Data Characteristics
Spatial Coverage: forestland located in the western US
Spatial Resolution: 1 km
Temporal Coverage: The data cover the period 2003-01-01 to 2012-12-31.
Temporal Resolution: Annual
Study Area:
| Study area | West | East | South | North |
|---|---|---|---|---|
| Western US | -130.43542 | -100.53764 | 28.470474 | 52.093803 |
Data File Information:
There are 40 files in GeoTIFF (.tif) format. This includes two files for each year from 2003-2012 for the two sources of tree mortality and the standards deviations; 10 files for tree mortality due to fires and the standard deviation for each of those files, and 10 files for tree mortality due to infestation of bark beetles and the standard deviation for each of those files.
A Monte Carlo approach was used to quantify uncertainty in the estimates.
Table 1: Data files
| File Name | Description |
|---|---|
| fire_tree_mortality_YYYY_MC.tif | Ten files for annual tree mortality in western US forests from fires where YYYY is the year from 2003-2012; MC is Monte Carlo |
| fire_tree_mortality_YYYY_MC_sd.tif | Ten files of the standard deviation of annual tree mortality in western US forests from fires where YYYY is the year from 2003-2012; MC is Monte Carlo |
| beetle_tree_mortality_YYYY_MC.tif | Ten files for annual tree mortality in western US forests from bark beetles where YYYY is the year from 2003-2012; MC is Monte Carlo |
| beetle_tree_mortality_YYYY_MC_sd.tif | Ten files of the standard deviation of annual tree mortality in western US forests from bark beetles where YYYY is the year from 2003-2012; MC is Monte Carlo |
Properties of the GeoTIFF files
Table 2. Properties common to all files
| Map units | # of bands | Data type | Data units | Fill value |
|---|---|---|---|---|
| meter | 1 | Int16 | Mg carbon per km2 | -9999 |
Table 3. Pixel values in each file
-Minimum values are 0.
| Filename | Max value | Mean Value | SD |
| beetle_mortality_2003_MC.tif | 11684.1 | 15.9 | 135.6 |
| beetle_mortality_2003_MC_sd.tif | 3579.3 | 4.5 | 39.5 |
| beetle_mortality_2004_MC.tif | 10321.5 | 19.5 | 179.1 |
| beetle_mortality_2004_MC_sd.tif | 3306.2 | 6.1 | 54.9 |
| beetle_mortality_2005_MC.tif | 10689.9 | 16.4 | 138.4 |
| beetle_mortality_2005_MC_sd.tif | 3883 | 5.3 | 45.3 |
| beetle_mortality_2006_MC.tif | 9107.7 | 12.2 | 106.3 |
| beetle_mortality_2006_MC_sd.tif | 3572.3 | 3.9 | 34.9 |
| beetle_mortality_2007_MC.tif | 12552.4 | 13 | 101.6 |
| beetle_mortality_2007_MC_sd.tif | 3710.4 | 4.2 | 32.8 |
| beetle_mortality_2008_MC.tif | 7273.1 | 24.5 | 167.7 |
| beetle_mortality_2008_MC_sd.tif | 2414.9 | 7.8 | 52.5 |
| beetle_mortality_2009_MC.tif | 11957.1 | 28.7 | 167 |
| beetle_mortality_2009_MC_sd.tif | 5360.7 | 9.3 | 54.5 |
| beetle_mortality_2010_MC.tif | 10506.5 | 22.3 | 139.7 |
| beetle_mortality_2010_MC_sd.tif | 3357.1 | 7.1 | 44.2 |
| beetle_mortality_2011_MC.tif | 6580.6 | 17.8 | 141.7 |
| beetle_mortality_2011_MC_sd.tif | 2292.5 | 5.5 | 42.7 |
| beetle_mortality_2012_MC.tif | 7038.5 | 7 | 84.2 |
| beetle_mortality_2012_MC_sd.tif | 3098.2 | 2.3 | 27.5 |
| fire_mortality_2003_MC.tif | 14173.7 | 12.8 | 197.5 |
| fire_mortality_2003_MC_sd.tif | 4677 | 2.4 | 43.6 |
| fire_mortality_2004_MC.tif | 11096.8 | 2.8 | 92.4 |
| fire_mortality_2004_MC_sd.tif | 3287.2 | 0.5 | 18.6 |
| fire_mortality_2005_MC.tif | 10655.5 | 3.1 | 76.2 |
| fire_mortality_2005_MC_sd.tif | 1387.2 | 0.5 | 12 |
| fire_mortality_2006_MC.tif | 11680.6 | 12.9 | 203.3 |
| fire_mortality_2006_MC_sd.tif | 3758.4 | 2.3 | 40.1 |
| fire_mortality_2007_MC.tif | 9946.9 | 17.8 | 210 |
| fire_mortality_2007_MC_sd.tif | 2624.7 | 2.7 | 35 |
| fire_mortality_2008_MC.tif | 15492.3 | 17.2 | 265.2 |
| fire_mortality_2008_MC_sd.tif | 3686.6 | 3 | 49.6 |
| fire_mortality_2009_MC.tif | 16040.6 | 4.2 | 128.6 |
| fire_mortality_2009_MC_sd.tif | 3289.6 | 0.7 | 24.8 |
| fire_mortality_2010_MC.tif | 11402.8 | 1.7 | 69.8 |
| fire_mortality_2010_MC_sd.tif | 5648.7 | 0.3 | 17.4 |
| fire_mortality_2011_MC.tif | 7988.3 | 6.7 | 113.4 |
| fire_mortality_2011_MC_sd.tif | 1601.1 | 1.1 | 18.1 |
| fire_mortality_2012_MC.tif | 11162.3 | 18.3 | 225.3 |
| fire_mortality_2012_MC_sd.tif | 3293.1 | 2.9 | 37 |
Spatial Properties
Projection: NAD 1983 Albers
Datum: North American Datum, 1983
EPSG: 5070
Application and Derivation
These data could be of value to climate models and policies and the impact of carbon losses due to forest disturbance.
Quality Assessment
A Monte Carlo approach was used to quantify uncertainty in the estimates of annual tree mortality. Annual tree mortality was simulated 100 times, where each iteration varied disturbance severity, tree aboveground biomass, and the fraction of dry biomass that is carbon based on uncertainty in each of these terms. The pixel-wise standard deviation (SD) was then computed across each annual set of iterations. The SD maps are included in the dataset (Berner et al., 2017).
Data Acquisition, Materials, and Methods
Tree mortality from fires (MORTfire, Mg AGC km-2) and bark beetles (MORTbeetle, Mg AGC km-2) was quantified from 2003-2012 across 802,575 km² of forest land located in the western US. Forest lands were included if consistently mapped as forest by three separate tree above-ground biomass (AGB) datasets. The analysis was conducted on a 1-km resolution grid in an Albers Equal Area projection, with the resolution chosen to match the bark beetle dataset (Meddens et al., 2012).
Data Sources
Tree carbon stocks
Tree AGC was estimated using three tree AGB geospatial datasets together with information on the fraction of dry biomass that is carbon (fcarbon): the Wilson et al. (2013) dataset, which depicted tree AGB circa 2003-2008, and the Blackard et al. (2008) and Kellndorfer et al. (2012) datasets which represented tree AGB circa 2000. Pre-disturbance tree AGB in pixels were estimated that were disturbed during the six years in the Wilson et al. (2013) dataset using the approach of Hicke et al. (2013) that involved comparing tree AGB in fire and beetles disturbed pixels against the average tree AGB of undisturbed pixels from the same forest type and ecoregion. If tree AGB in the disturbed pixel was less than the average tree AGB of undisturbed pixels, tree AGB in the disturbed pixel was set to this average, otherwise the disturbed pixel was unaltered. After implementing this correction, the average and standard error (SE) of tree AGB were computed for each pixel over the three datasets. Lastly, the average and SE of fcarbon for hardwood (angiosperm, 48.49±0.42% C, n=8) and softwood (gymnosperm, 50.87±0.63% C, n=11) tree species found in this region were estimated (Berner et al., 2017).
Forest fires
Forest fire data were from annual maps of fire severity from 2003-2012 produced by the Monitoring Trends in Burn Severity (MTBS) project (Eidenshink et al., 2007). These maps were derived from 30-m resolution Landsat images acquired before and after fires larger than ~405 ha in the western US. Fire severity was mapped using the differenced Normalized Burn Ratio (dNBR) and then each pixel was classified as one of five thematic severity classes. Pixels that burned at low-, moderate-, or high-severity were included and those that were unburned or showed post-fire greening were excluded.
Two national land cover maps (Homer et al., 2007; Rollins, 2009) were used to generate a 30-m resolution forest mask to identify fires that were in forests. The annual fraction of forest area was computed that burned at each severity (As) in each 1-km pixel over the decade. In addition, field measurements of the fraction of tree biomass killed at each severity (ffire) were incorporated. The mean and SE of ffire were computed for forests dominated by hardwood and softwood tree species based on 116 estimates of ffire synthesized from 29 field studies (Ghimire et al., 2012) conducted in the western United States (Berner et al., 2017).
Bark beetles
Bark beetle data were from annual maps depicting the areal extent of tree canopy mortality due to 12 bark beetle species produced from aerial surveys, forest inventory measurements, and high-resolution satellite imagery (Meddens et al., 2012). The USFS National Forest Health Monitoring program conducts aerial detection surveys (ADS) that provide a coarse snapshot of insect and other forest disturbance at a landscape scale (Johnson and Wittwer, 2008). Trained observers conduct surveys from fixed-wing aircraft that involve sketch-mapping the extent of areas affected by insect outbreaks and then visually estimating the number of dead trees within affected areas. Meddens et al. (2012) used the ADS observations to estimate annual canopy mortality area due to bark beetles across the western US from 1997-2010, with estimates then extended through 2012 (Hicke et al., 2015).
Canopy mortality area was estimated at 1-km resolution based on the number of recently killed trees and the average canopy area of each tree species. The ADS observations underestimated the number of trees killed by bark beetles in comparison with field observations and QuickBird (2.4-m resolution) satellite imagery from Colorado, Idaho, and New Mexico. This led to the development of adjustment factors for several forest types based on the ratio of dead trees mapped from satellite to ADS tree kill counts. These adjustment factors were then used to modify ADS tree kill counts, resulting in high and middle (most realistic) estimates as well as low estimates based on unaltered ADS numbers (Meddens et al., 2012; Hicke et al., 2015). The dataset includes bark beetle species that cumulatively killed at least 100,000 trees. Specifically, it includes (from greatest to least mortality area) mountain pine beetle (Dendroctonus ponderosae Hopkins), piñon ips (Ips confusus (LeConte)), Douglas-fir beetle (Dendroctonus pseudotsugae Hopkins), western balsam bark beetle (Dryocoetes confuses (Swaine)), and fir engraver (Scolytus ventralis LeConte), as well as seven additional beetle species that killed fewer trees. These data were masked to our domain and then summed canopy mortality area was summed across bark beetle species for each 1-km pixel in a given year (i.e., a voxel) from 2003-2012. Annual tree canopy mortality fraction (fbeetle) was calculated for each voxel by dividing canopy mortality area by forest cover fraction. The lower, middle, and upper estimates of fbeetle were incorporated into our analysis (Berner et al., 2017).
Tree mortality from bark beetles and fires
Spatially explicit estimates of annual mortality from fire and beetles from 2003-2012 were developed and uncertainties were quantified using a Monte Carlo approach. The Monte Carlo involved generating 100 realizations of annual tree mortality in each voxel, where each realization iteratively varied tree AGC, based on uncertainty in each term. Tree AGC within a pixel was assumed to change only due to disturbance (i.e., no tree growth or recruitment), which potentially caused a slight underestimation of tree mortality. For instance, stand age averaged 97±73 years (± 1SD) in the study area. Field measurements from the Western Cascades (Hudiburg et al., 2009) and the Rocky Mountains showed that tree AGC could increase 6-7% between stands that are 97 and 106 years old. This simplifying assumption made it so that cumulative tree mortality within a pixel could not exceed the initial tree AGC (Berner et al., 2017).
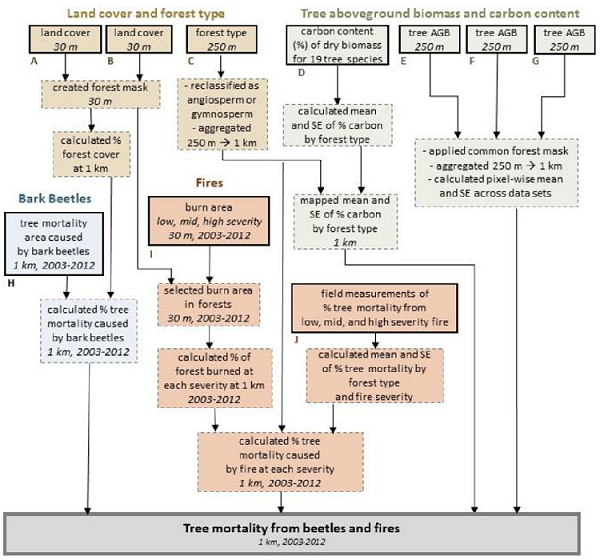
Figure 2. Workflow illustrating datasets (solid boxes) and processing steps (dashed boxes) for estimating tree mortality due to bark beetles and fires from 2003-2012 across the western United States (thick solid box). Data citations, spatial resolutions, and temporal ranges are shown where applicable.
The mean and standard deviations (SD) were computed for the multiple estimates of tree mortality for each voxel, where the SD represented uncertainty due to parameter error (e.g., SEAGB, SEfire). Altogether, this process yielded spatially explicit estimates of annual tree mortality (and uncertainty).
For additional details, refer to Berner et al. (2017).
Data Access
These data are available through the Oak Ridge National Laboratory (ORNL) Distributed Active Archive Center (DAAC).
Tree Mortality from Fires and Bark Beetles at 1-km Resolution, Western USA, 2003-2012
Contact for Data Center Access Information:
- E-mail: uso@daac.ornl.gov
- Telephone: +1 (865) 241-3952
References
Berner, L. T., B. E. Law, A. J. Meddens, and J. A. Hicke. 2017. Tree mortality from fires, bark beetles, and timber harvest during a hot and dry decade in the western United States (2003–2012), Environmental Research Letters 12(6), 065005. https://doi.org/10.1088/1748-9326/aa6f94
Blackard, J., M. Finco, E. Helmer, G. Holden, M. Hoppus, D. Jacobs, A. Lister, G. Moisen, M. Nelson, and R. Riemann. 2008. Mapping US forest biomass using nationwide forest inventory data and moderate resolution information, Remote Sensing of Environment 112, 1658-77. https://doi.org/10.1016/j.rse.2007.08.021
Eidenshink, J., B. Schwind, K. Brewer, Z. Zhu, B. Quayle, and S. Howard. 2007. A project for monitoring trends in burn severity, Fire Ecology 3 (1), 3-21. https://doi.org/10.4996/fireecology.0301003
Ghimire B., C.A. Williams, G.J. Collatz, and M. Vanderhoof. 2012. Fire-ÂÂÂÂÂÂÂÂÂÂÂÂÂÂÂÂÂÂÂÂinduced carbon emissions and regrowth uptake in western US forests: Documenting variation across forest types, fire severity, and climate regions. Journal of Geophysical Research: Biogeosciences 117. http://dx.doi.org/10.1029/2011JG001935/full
Hicke J.A., A.J. Meddens, and C.A. Kolden. 2015. Recent Tree Mortality in the Western United States from Bark Beetles and Forest Fires. Forest Science 62 141-53.http://dx.doi.org/10.5849/forsci.15-086
Homer, C., J. Dewitz, J. Fry, M. Coan, N. Hossain, C. Larson, N. Herold, A. McKerrow, J.N. VanDriel, and J. Wickham. 2007. Completion of the 2001 national land cover database for the conterminous United States - Representing a Decade of Land Cover Change Information. Photogrammetric Engineering and Remote Sensing 81(5), 346-354.
Hudiburg T., B. Law, D. P. Turner, J. Campbell, D. Donato, and M. Duane. 2009. Carbon dynamics of Oregon and Northern California forests and potential land-based carbon storage. Ecological Applications 19 163-80. http://dx.doi.org/10.1890/07-2006.1
Johnson, E. and D.Wittwer. 2008. Aerial detection surveys in the United States. Australian Forestry 71 212-5. http://dx.doi.org/10.1080/00049158.2008.10675037
Kellndorfer, J., W. Walker, K. Kirsch, G. Fiske, J. Bishop, L. LaPoint, M. Hoppus, and J. Westfall. 2013. NACP Aboveground Biomass and Carbon Baseline Data (NBCD 2000), U.S.A., 2000. Data set. Available on-line [http://daac.ornl.gov] from ORNL DAAC, Oak Ridge, Tennessee, U.S.A. http://dx.doi.org/10.3334/ORNLDAAC/1161
Lamlom, S. and R. Savidge. 2003. A reassessment of carbon content in wood: variation within and between 41 North American species. Biomass and Bioenergy 25 381-8. A reassessment of carbon content in wood: variation within and between 41 North American species. https://doi.org/10.1016/S0961-9534(03)00033-3
Meddens, A.J., J.A. Hicke, and C.A. Ferguson. 2012. Spatiotemporal patterns of observed bark beetle-caused tree mortality in British Columbia and the western United States Ecological Applications 22 1876-91. http://dx.doi.org/10.1890/11-1785.1
Rollins, M.G. 2009. LANDFIRE: a nationally consistent vegetation, wildland fire, and fuel assessment International Journal of Wildland Fire 18 235-49. CSIRO PUBLISHING | International Journal of Wildland Fire. https://doi.org/10.1071/WF08088
Ruefenacht, B., M. Finco, N. Nelson, R. Czaplewski, E. Helmer, J. Blackard, G. Holden, A. Lister, D. Salajanu, and D. Weyermann. 2008. Conterminous US and Alaska forest type mapping using forest inventory and analysis data Photogramm. Eng. Remote Sens 74 1379-88. https://doi.org/10.14358/PERS.74.11.1379
Wilson, B.T., C. Woodal, and D. Griffith. 2013. Imputing forest carbon stock estimates from inventory plots to a nationally continuous coverage Carbon balance and management 8 1-15 Tree mortality in the western US. http://dx.doi.org/10.1186/1750-0680-8-1
Dataset Revisions
Note that these revised data, released March 2020, supersede the previous version.
Revision notes provided by L. Berner.
An error was discovered in the prior version of this dataset, which has now been updated to address the issue. The error led to some tree mortality from fires and beetles being missed in far western California and northern Washington. Estimates of tree mortality in other states were not affected by this error. The error traced back to an issue with the spatial extent of the input burn severity dataset varying through time. Essentially, each annual raster in the Monitoring Trends in Burn Severity (MTBS) dataset is clipped to the minimum spatial extent needed to encompass all fires in a given year. Consequently, these rasters sometimes cut out parts of western California and northern Washington when no fires occurred in those areas. We did not adequately account for no-data values that were introduced into the analysis in these areas. These no-data values were sequentially propagated through the analysis when we updated the biomass map each year to account for prior tree mortality. Functionally, the biomass map got nibbled away by no-data values along the western and northern edges, and thus we missed some tree mortality from fires and beetles in these areas. The updated dataset fixes this issue.