Get Data
Revision Date: May 7, 2014
Summary:
This data set provides a map of selected areas with defined tree canopy cover over the circumpolar taiga-tundra ecotone (TTE). Canopy cover was derived from the 500-meter MODIS Vegetation Continuous Fields (VCF) product as averaged over six years from 2000-2005 and processed as described in Ranson et al. (2011). This process identified patches of low tree canopy cover which are indicative of the transition from forest to tundra and differentiate the circumpolar taiga–tundra ecotone for the 2000–2005 period.
The TTE is the Earth's longest vegetation transition zone and stretches for more than 13,400 km around Arctic North America, Scandinavia, and Eurasia. In Eurasia, the map extends from 60 degrees N to 70 degrees N, and in North America from 50 degrees N to 70 degrees N, excluding Baffin Island in northeastern Canada and the Aleutian Peninsula in southwestern Alaska. Note that for this product, taiga is being used one and the same as boreal forest.
This circumpolar TTE area was classified according to VCF tree canopy cover. Two classes were defined as important for characterizing the ecotone: Class 1 includes areas with tree canopy cover of 5 to 20% and Class 2 includes areas with <5% mean tree canopy cover and with a standard deviation of >5% mean tree canopy cover. The ecotone was bounded at a maximum of 20% tree canopy cover. This upper bound is consistent with the definition of the lower limit of intact forest. Global intact forest landscapes were mapped using VCF tree canopy cover above 20% (Potapov et al., 2008). Areas with mean adjusted tree canopy cover and standard deviation both <5% were classified as tundra and are not part of the ecotone.
There is one data file with the defined Class 1 and Class 2 areas provided in Shapefile format compressed into a single zip file (*.zip) with this data set.
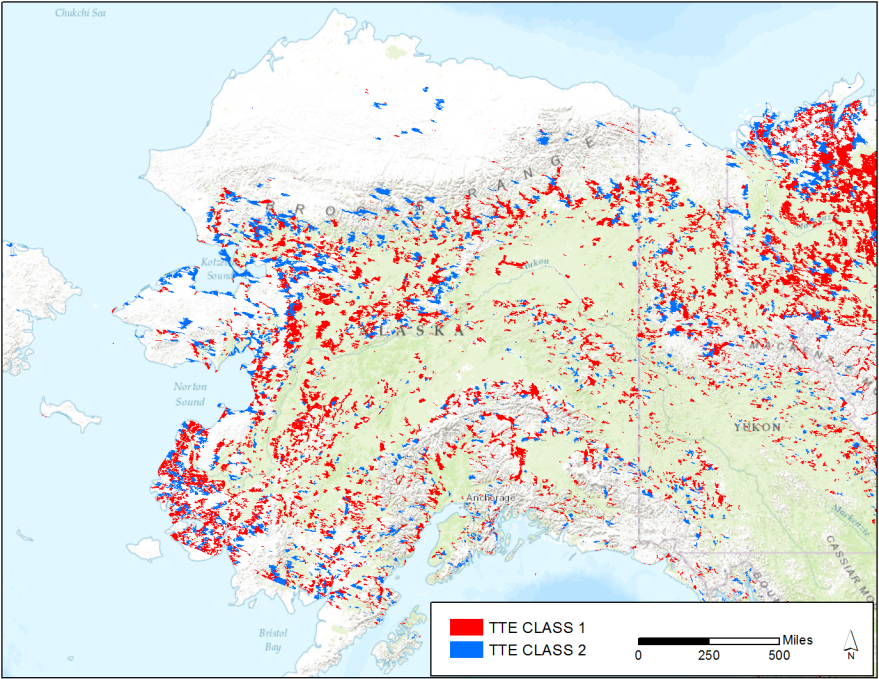
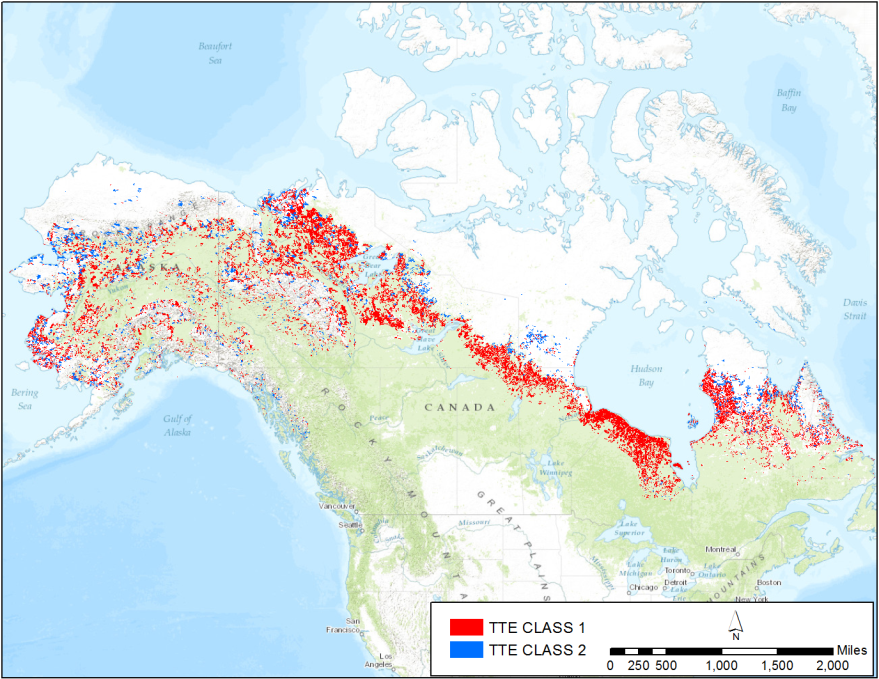
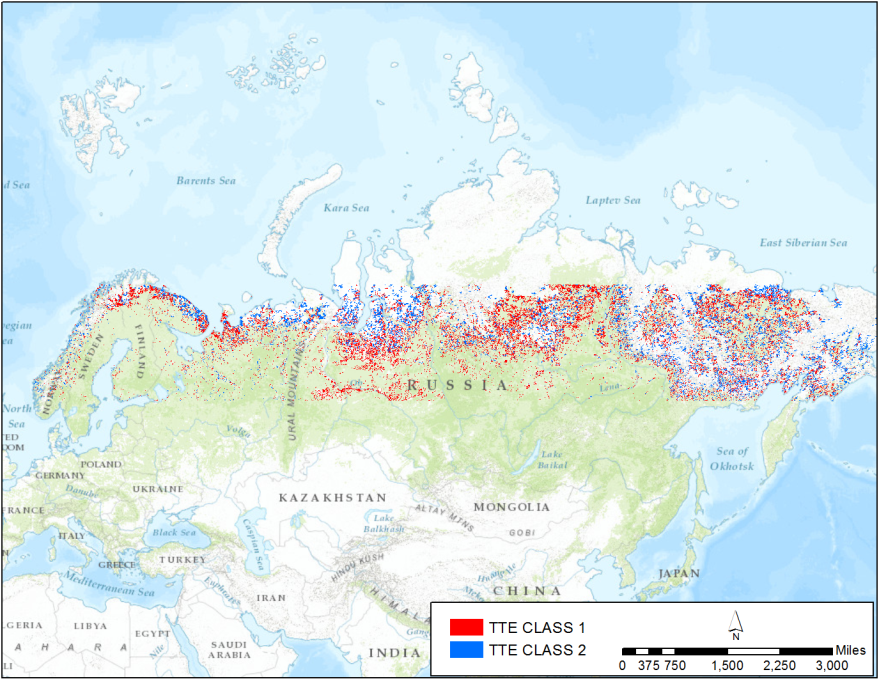
Figure 1. The Tundra-Taiga Ecotone (TTE) is the earth's longest vegetation transition zone and stretches for more than 13,400 km around Arctic North America, Scandinavia, and Eurasia. Two classes were defined as important for characterizing the ecotone: Class 1 (red) includes areas with tree canopy cover of 5 to 20% and Class 2 (blue) includes areas with < 5% mean tree canopy cover and with a standard deviation of > 5% mean tree canopy cover. Figures show the TTE data overlaid on land cover and shaded relief imagery for context. (Top) Alaska subset showing tree canopy cover class details. (Middle) Over North America the mapped area extends from 50 to 70 degrees N, excluding Baffin Island in northeastern Canada and the Aleutian Peninsula in southwestern Alaska. (Bottom) In Eurasia, the mapped area extends from 60 to 70 degrees N.
Data Citation:
Cite this data set as follows:
Ranson, K.J., P.M. Montesan, and R. Nelson. 2014. Tree Canopy Cover for the Circumpolar Taiga-Tundra Ecotone: 2000-2005. Data set. Available on-line [http://daac.ornl.gov] from ORNL DAAC, Oak Ridge, Tennessee, USA. http://dx.doi.org/10.3334/ORNLDAAC/1218
Table of Contents:
- 1 Data Set Overview
- 2 Data Characteristics
- 3 Applications and Derivation
- 4 Quality Assessment
- 5 Acquisition Materials and Methods
- 6 Data Access
- 7 References
1. Data Set Overview:
This data set provides a map of selected areas with defined tree canopy cover over the circumpolar taiga-tundra ecotone (TTE). Canopy cover was derived from the 500-meter MODIS Vegetation Continuous Fields (VCF) product as averaged over six years from 2000-2005 and processed as described in Ranson et al. (2011). This process identified patches of low tree canopy cover which are indicative of the transition from forest to tundra and differentiate the circumpolar taiga–tundra ecotone for the 2000–2005 period.
The TTE is the Earth's longest vegetation transition zone and stretches for more than 13,400 km around Arctic North America, Scandinavia, and Eurasia. In Eurasia, the map extends from 60 degrees N to 70 degrees N, and in North America from 50 degrees N to 70 degrees N, excluding Baffin Island in northeastern Canada and the Aleutian Peninsula in southwestern Alaska. Note that for this product, taiga is being used one and the same as boreal forest.
This circumpolar TTE area was classified according to VCF tree canopy cover. Two classes were defined as important for characterizing the ecotone: Class 1 includes areas with tree canopy cover of 5 to 20% and Class 2 includes areas with <5% mean tree canopy cover and with a standard deviation of >5% mean tree canopy cover. The ecotone was bounded at a maximum of 20% tree canopy cover. This upper bound is consistent with the definition of the lower limit of intact forest. Global intact forest landscapes were mapped using VCF tree canopy cover above 20% (Potapov et al., 2008). Areas with mean adjusted tree canopy cover and standard deviation both <5% were classified as tundra and are not part of the ecotone.
2. Data Characteristics:
2.1. Spatial Coverage
Site: Circumpolar Taiga Tundra Ecotone
Site boundaries: (All latitude and longitude given in degrees and fractions)
| Site (Region) | Westernmost Longitude | Easternmost Longitude | Northernmost Latitude | Southernmost Latitude |
|---|---|---|---|---|
| Circumpolar Taiga Tundra Ecotone | -180 | 180 | 70 | 50 |
2.2. Temporal Coverage
- The data set covers the period 2000/01/01 to 2005/12/31.
Data File Information
There is one shapefile (TTE_Tree_Canopy_Cover.shp) with this data set which provides a map of tree canopy cover for the Taiga-Tundra Ecotone (TTE) from 2000-2005. The map data are cast in the sinusoidal projection, matching the original projection of the input VCF. In Eurasia, the map extends from 60 degrees N to 70 degrees N, and in North America from 50 degrees N to 70 degrees N, excluding Baffin Island in northeastern Canada and the Aleutian Peninsula in southwestern Alaska.
The shapefile contains six files (*.shx, *.dbf, *.prj, *.sbn,*.sbx, and *.shp) provided as a compressed (*.zip) file: .zip
Shapefile parameters:
Geometry Type: Polygon
Projected Coordinate System: World_Sinusoidal
Geographic Coordinate System: SPHERE_MODIS
Datum: SPHERE_MODIS
Prime Meridian: Greenwich
Angular Unit: Degree
Projection: Sinusoidal
False_Easting: 0.0
False_Northing: 0.0
Central_Meridian: .0
Linear_Unit: Meter
Shapefile Attributes
Mean_TC_pc: 2000-2005 mean adjusted tree canopy cover (TCC, %)
StdDev_TC: 2000-2005 standard deviation in adjusted TCC (%)
Area_sq_km: Shape area in square kilometers
TTE_class: Taiga-tundra ecotone class, according to Ranson et al. 2011:
- value 1:. The mean VCFadj value from 5% through 20% (5–20%).
- Value 2: The mean VCFadj value was b5% and the standard deviation N5%.
Shape_Leng: Shape length in meters
Shape_Area: Shape area in square meter
The shapefile contains mean and standard deviation VCFadj percent tree canopy cover values for each ecotone polygon, as well as the area of each polygon in square kilometers. The minimum size for 95% of the TTE polygons is 2.5 km2, which corresponds to the minimum mapping unit. Greater than 95% of the area mapped as ecotone is comprised of polygons that are at least 20 km2 in size. The ecotone, below 70 degrees N, covers over 1.9 million km2, 64% of which is found in North America. Regional ecotone areas range widely from 49,000 to 322,000 km2 in Class 1 and from 33,000 to 301,000 km2 in Class 2. This may be largely due to the longitudinal extent of each zone.
*VCFadj is described in Section 5, Data Acquisition.
3. Data Application and Derivation:
The TTE shapefile can be included in global models that require forest extent information for the high northern latitudes. The shapefile provides an explicit, area-based northern edge of most of the boreal forest/taiga. Second, when used as a mask, the shapefile identifies areas of sparse forest patches across a broad scale where researchers may expect rapid and variable vegetation changes to occur at forest fronts. The TTE is derived from 500-m pixels, a spatial resolution appropriate to measuring/mapping global phenomena, but perhaps too large to serve to monitor vegetation changes that take place on the scale of kilometers over decades. As such, the TTE shapefile may be employed in data integration/fusion studies to target areas that have high potential for change and areas that should be studied with finer resolution radar and lidar data to measure forest patch- and gap-level 3-D vegetation structure. The consistent treatment of the entire circumpolar region using objective, repeatable image processing methods facilitates (1) comparisons among regions and (2) use with other global data sets.
4. Quality Assessment:
Assessing the accuracy of the TTE product is challenging given the inaccessibility of the circumpolar TTE and the paucity of generally accepted, quality-checked, independent ecotone and tree line maps. The TTE VCFadj map was compared to four independent data sources that contain information concerning the northern extent of the boreal forest. See Ranson et al. (2011) for details.
Sources 1 and 2: Comparison to Established Tree Lines: The TTE VCFadj percent tree canopy cover pixel values were compared to two circumpolar, vector lines that approximate the northern limit of trees: the Circumpolar Arctic Vegetation Map (CAVM) (Walker et al., 2005) and the Circum-Arctic Map of Permafrost and Ground-Ice Conditions (CAPI). The intersection of VCFadj polygons with two representations of tree-line was produced for the circumpolar ecotone below 70 degrees N. The intersection of the data shows the correspondence of low VCFadj %TCC values with treeline in North America and Eurasia for each regional zone. The regional zone means are an aggregation of the 1 degree longitudinal means of the VCFadj values at their intersection with each tree-line. Adjusted values above 20% are reported for the Western Eurasia regional zone (40 degrees E–60 degrees E), while all other zones average less than 12% VCFadj tree cover at both tree-lines. Most of the regional zones have a mean %TCC less than 5 for at least 40% of their 1-degree intervals (5 of 6 of the zones at the CAVM tree line, 6 of 7 at the CAPI tree line). This is indicative of agreement among the tree line data and the VCFadj on areas of low %TCC. In North America, particularly west of Hudson Bay, the linear adjustments brought %TCC values to near zero in many longitudinal zones. In Eurasia, VCFadj values are more variable, and spikes in %TC are apparent between 55 degrees E and 80 degrees E. There is a broad gap between 80 degrees E and 148 degrees E where, for the most part, the CAVM and CAPI tree-lines lie above 70 degrees N, where C4 VCF data were not available. An interruption of the intersection between the tree lines and the VCFadj also occurs in North America at Hudson Bay.
Source 3: Comparison to a Landsat ETM+Percent Forest Cover Map of Canada: The VCFadj was compared to the EOSD-derived proportion of forest within a 1-km × 1-km grid cell. The median VCFadj value was within an average of 5% TCC between EOSD bins 0–30 for both Eastern and Western Canada. The VCFadj map depicts information about a continuous variable, %TCC, from 0 to 100% that has been grouped into classes. The EOSD data depicts the proportion of the 1-km2 cell occupied by smaller 30-meter EOSD pixels classified as forest.
Source 4: Comparison to Airborne Profiling Lidar Measurements: The overall accuracy of the TTE map when compared to laser measurements is 67.7%.
5. Data Acquisition Materials and Methods:
Study site
The Earth's longest vegetation transition zone, the circumpolar taiga– tundra ecotone (TTE), stretches for more than 13,400 kmaround Arctic North America, Scandinavia, and Eurasia (Callaghan et al., 2002a). This ecotone is subjected to climate change (Serreze et al., 2000), and sensitive to climate change (Callaghan et al., 2002b). The shifting of local subarctic tree lines throughout the forest-tundra biome is linked to ecological processes at different spatiotemporal scales and will reflect future global climatic changes (Payette et al., 2001). The TTE is not a distinct edge but a transition zone where patches of tundra and forest are mixed (Ranson et al., 2011).
Methods (from Ranson et al., 2011)
Data Acquisition
Collection 4 (C4) MODIS VCF (MOD44b) data were acquired as 10-degree × 10-degree tiles for six years (2000–2005) for 21 tiles. Tiles for continental North America spanned from 50 degrees N to 70 degrees N and tiles for Eurasia spanned 60 degrees N to 70 degrees N. No C4 MODIS VCF data existed above 70 degrees N, which accounts for the data gap in northern Siberia. The data tiles were mosaicked by year for both North America and Eurasia using ENVI 4.5 software (ENVI 2010). The six years of data were then combined to derive an average VCF data set, where each pixel represented the mean data.
Each continental multi-annual VCF mosaic was adjusted based on inversions of the results of simple linear regressions relating QuickBird satellite imagery-validated percent tree canopy cover (% TCC, X variable) to MODIS VCF %TCC (Y variable). Adjustments were done primarily to mitigate a tendency of the VCF to overestimate %TCC in lightly forested regions. The adjustments were applied for seven broad longitudinal zones representing very general circumpolar regions on a pixel-by-pixel basis. All subsequent processing was done on these adjusted VCF values, referred to as VCFadj.
VCF Segmentation
Definiens software (Definiens, 2009) was used for the segmentation process to mitigate pixel level noise in the VCFadj tree canopy cover estimates and to group pixels representing similar tree cover into polygonal features (segmentation objects) that form the map of the transition zone. The segmentation was applied to both the North American and the Eurasian VCFadj mosaics. Vector layer data sets (the World Wildlife Fund's (WWF) Global Lakes and Wetlands Database and WWF Ecoregions) were used as masks to constrain the segmentations to land areas within previously delineated taiga and tundra biomes.
TTE Mapping
Polygons were created based on a specified range of VCFadj values that represented the TTE. The mean and standard deviation of the VCFadj pixel values within each polygon were calculated. Polygons were considered part of the TTE if they fit one of the following two criteria:
1. The mean VCFadj value from 5% through 20% (5–20%).
2. The mean VCFadj value was b5% and the standard deviation N5%.
Polygons in the 5–20% class were considered as the core of the TTE. The second class represents more of a transition from lightly forested areas to no trees. Image objects whose mean adjusted value and standard deviation were both less than 5% were considered outside the TTE and classified as tundra while image objects with a mean VCFadj value greater than 20% were not considered part of the TTE and were classified as boreal forest.
6. Data Access:
This data is available through the Oak Ridge National Laboratory (ORNL) Distributed Active Archive Center (DAAC).
Data Archive Center:
Contact for Data Center Access Information:
E-mail: uso@daac.ornl.gov
Telephone: +1 (865) 241-3952
7. References:
Callaghan, T. V., Crawford, R. M. M., Eronen, M., Hofgaard, A., Payette, S., Rees, W. G., et al. (2002). The dynamics of the tundra–taiga boundary: An overview and suggested coordinated and integrated approach to research. Ambio, 3–5.
Callaghan, T. V., Werkman, B. R., and Crawford, R. M. M. (2002). The tundra–taiga interface and its dynamics: Concepts and applications. Ambio, 6–14.
Definiens (2009). eCognition Developer 8 User Guide. Munich, Germany: Definiens AG.
Montesano, P.M., Nelson, R., Sun, G., Margolis, H., Kerber, A., and Ranson, K.J. (2009). MODIS tree cover validation for the circumpolar taiga-tundra transition zone. Remote Sensing of Environment. 113, 2130-2141.
Payette, S., Fortin, M. J., and Gamache, I. (2001). The subarctic forest-tundra: The structure of a biome in a changing climate. Bioscience, 51(9), 709–718.
Potapov, P., Yaroshenko, A., Turubanova, S., Dubinin, M., Laestadius, L., Thies, C., et al. (2008). Mapping the world's intact forest landscapes by remote sensing. Ecology and Society, 13(2), 51. URL:http://www.ecologyandsociety.org/vol13/iss2/art51/
Ranson, K.J., Montesano, P.M., and Nelson, R. (2011). Object-based mapping of the circumpolar taiga-tundra ecotone with MODIS tree cover. Remote Sensing of Environment. 115, 3670-3680.
Serreze, M. C., Walsh, J. E., Chapin, F. S., III, Osterkamp, T., Dyurgerov, M., Romanovsky, V., et al. (2000). Observational evidence of recent change in the northern highlatitude environment. Climate Change, 46, 159–207.
Walker, D. A., Raynolds, M. K., Daniels, F. J. A., Einarsson, E., Elvebakk, A., Gould, W. A., et al. (2005). The Circumpolar Arctic vegetation map. Journal of Vegetation Science, 16, 267–282.