Documentation Revision Date: 2017-11-09
Data Set Version: 1
Summary
There are 412 LiDAR point cloud files in LAZ format, four shapefiles compressed in .zip format providing the study site boundaries and LAZ tile footprints, and four files in GeoTIFF format providing the elevation and maximum vegetation height data included in this dataset.
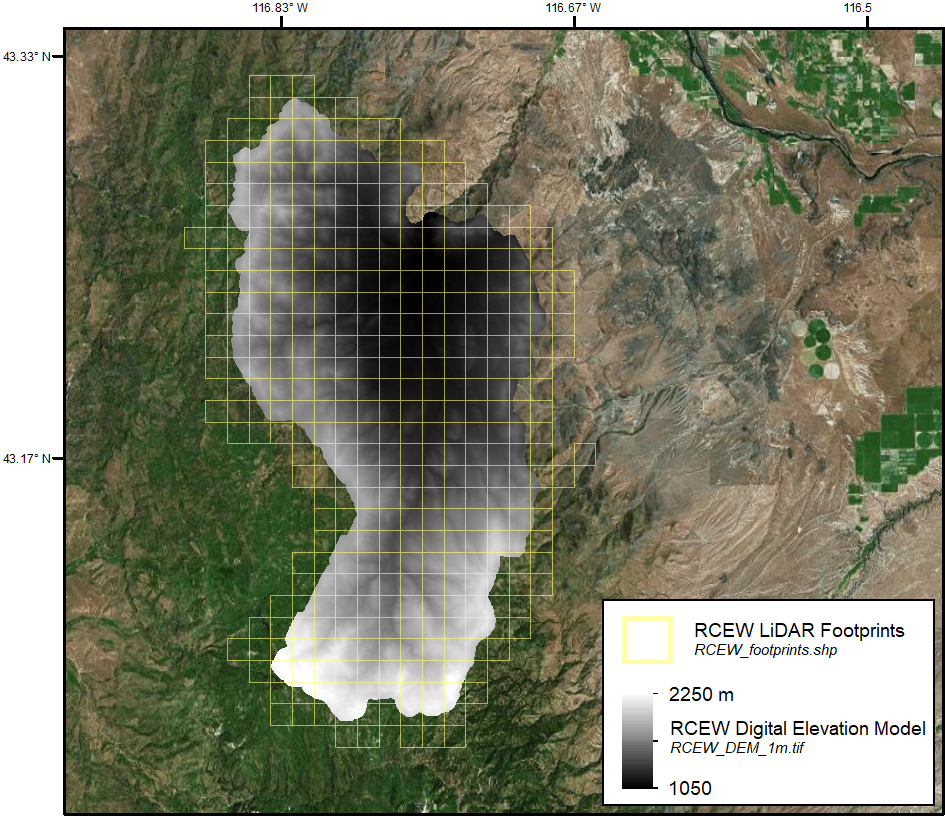
Figure 1. Digital elevation model and LiDAR tile boundaries for the area encompassing the Reynolds Creek Experimental Watershed in southwestern Idaho.
Citation
Ilangakoon, N., N. Glenn, and L. Spaete. 2017. LiDAR Data, DEM, and Maximum Vegetation Height Product from Southern Idaho, 2014. ORNL DAAC, Oak Ridge, Tennessee, USA. https://doi.org/10.3334/ORNLDAAC/1532
Table of Contents
- Data Set Overview
- Data Characteristics
- Application and Derivation
- Quality Assessment
- Data Acquisition, Materials, and Methods
- Data Access
- References
Data Set Overview
This dataset provides the point cloud data derived from small footprint waveform LiDAR data collected in August 2014 over Reynolds Creek Experimental Watershed and Hollister in southern Idaho. The LiDAR data have been georeferenced, noise-filtered, and corrected for misalignment for overlapping flight lines and are provided in 1 km tiles. High resolution digital elevation models and maps of maximum vegetation height derived from the LiDAR data are provided for each site.
Acknowledgements: This research was funded through NASA Terrestrial Ecology grant number NNX14AD81G.
Data Characteristics
Spatial Coverage: Two sites in southern Idaho, USA
Spatial Resolution: Point resolution (.laz); 1 meter (.tif)
Temporal Coverage: 20140823 - 20140831
Temporal Resolution: Each study site was surveyed once.
Study Area (These coordinates are the approximate locations of the study sites and may not match the extents of the data files. All latitude and longitude values are given in decimal degrees.)
| Sites | Westernmost Longitude | Easternmost Longitude | Northernmost Latitude | Southernmost Latitude |
|---|---|---|---|---|
| Reynolds Creek Experimental Watershed, Idaho | -116.889 | -116.655 | 43.326 | 43.046 |
| Hollister, Idaho | -114.729 | -114.677 | 42.394 | 42.284 |
Data File Information
There are 412 data files in compressed LiDAR file format (.laz), four files in Shapefile format (compressed in .zip format), and four files in GeoTIFF format (.tif) included in this dataset.
The LAZ files provide LiDAR point clouds for the two surveyed areas in 1-km2 tiles.
The four shapefiles, two per site, are zipped in individual folders containing four files (*.shp, *.shx, *.dbf, *.prj) and provide the survey area boundaries (*_boundary.zip) and LiDAR tile footprints (*_footprints.zip).
The GeoTIFFs provide digital elevation models and maximum vegetation height estimates for the two surveyed areas.
Spatial Reference Properties
NAD_1983_UTM_zone_11N
WKID: 26911 Authority: EPSG
Projection: Transverse_Mercator
false_easting: 500000.0
false_northing: 0.0
central_meridian: -117.0
scale_factor: 0.9996
latitude_of_origin: 0.0
Linear Unit: Meter (1.0)
Geographic Coordinate System: GCS_North_American_1983
Angular Unit: Degree (0.0174532925199433)
Prime Meridian: Greenwich (0.0)
Datum: D_North_American_1983
Spheroid: GRS_1980
Semimajor Axis: 6378137.0
Semiminor Axis: 6356752.314140356
Inverse Flattening: 298.257222101
LiDAR Files
The LiDAR files provide LiDAR point clouds for the two surveyed areas in 1 km2 tiles. The LAZ files are named as follows:
<survey_area>000<###>.laz
where <survey_area> is either "rcew" (Reynolds Creek Experimental Watershed) or "hollister" (Hollister)
and <###> corresponds to the tile number denoted by the "BlockID" attribute in the LiDAR tile footprints file for each survey area
Example file name: rcew000001.laz
Shapefiles
The four shapefiles, two per site, are zipped in individual folders containing four files (*.shp, *.shx, *.dbf, *.prj) and provide the survey area boundaries (*_boundary.zip) and LiDAR tile footprints (*_footprints.zip). The "BlockID" attribute in the tile footprints files corresponds to the tile number appended to the filename of each LAZ file; i.e. the shapefile feature with a value of "1" for the "BlockID" attribute in RCEW_footprints.shp provides the footprint for rcew000001.laz.
Shapefile Spatial Representation Type: Vector
Geometry Type: Polygon
Geographic Coordinate System: North_American_1983
Prime Meridian: Greenwich
Angular Unit: Degree
Each of the four shapefiles are also provided as companion files in Google Earth (*.kmz) format.
GeoTIFFs
The GeoTIFFs provide digital elevation models and maximum vegetation height estimates for the two surveyed areas. GeoTIFF filenames, units, and descriptions are given in Table 1.
Spatial Representation Type: Raster
Pixel Depth: 32 bit
Pixel Type: Float
Compression Type: LZW
Number of Bands: 1
Raster Format: TIFF
No Data Value: -9999
Scale Factor: 1
Table 1. Filenames, units, and descriptions for elevation and maximum vegetation height GeoTIFFs.
| Filename | Units | Description |
|---|---|---|
| RCEW_DEM_1m.tif | m | Digital elevation model for surveyed area over Reynolds Creek Experimental Watershed |
| RCEW_max_veg_height_1m.tif | m | Maximum vegetation height grid for surveyed area over Reynolds Creek Experimental Watershed |
| Hol_DEM_1m.tif | m | Digital elevation model for surveyed area over Hollister, Idaho |
| Hol_max_veg_height_1m.tif | m | Maximum vegetation height grid for surveyed area over Hollister, Idaho |
Application and Derivation
The areas in southern Idaho encompassing Hollister and Reynolds Creek Experimental Watershed (RCEW) are well suited for ecological observation because of strong gradients in climate, vegetation, and distributions of soil organic and inorganic carbon. This data may be used to characterize above and below ground plant biomass and soil carbon amounts and characteristics.
Quality Assessment
Misalignment of the LiDAR point cloud data was corrected using the Teramatch software (https://www.terrasolid.com/) prior to raster generation. Overall mismatching of heights and roll after correction were 1 cm for RCEW and 2 cm for Hollister. Bare ground elevation uncertainty was analyzed using field measured ground elevation data collected using a RTK GPS. The overall uncertainty of ground elevation was 14 cm (RMSE) for RCEW (279 reference data points) and 12 cm (RMSE) for Hollister (498 reference data points).
Data Acquisition, Materials, and Methods
Full waveform LiDAR data were collected by NASA's Jet Propulsion Laboratory (JPL) Airborne Snow Observatory (ASO) in August 2014. The data were collected using a Riegl LMS Q-1560 dual laser scanner system. The full waveforms were decomposed in Riegl RiPROCESS software to generate 3D point clouds with an average point density of 14-20 points per square meter. The point clouds were corrected for elevation and roll misalignment between adjacent flight lines in TerraScan. Digital elevation models (DEMs) and maximum vegetation height estimates of 1-m resolution were derived from the corrected point clouds using BCAL LiDAR Tools (https://bcal.boisestate.edu/tools/lidar and https://github.com/bcal-lidar/tools/wiki/BareDEM).
Data Access
These data are available through the Oak Ridge National Laboratory (ORNL) Distributed Active Archive Center (DAAC).
LiDAR Data, DEM, and Maximum Vegetation Height Product from Southern Idaho, 2014
Contact for Data Center Access Information:
- E-mail: uso@daac.ornl.gov
- Telephone: +1 (865) 241-3952
References
Ilangakoon, Nayani; Glenn, Nancy F.; Spaete, Lucas P.; Dashti, Hamid; and Li, Aihua. (2016). 2014 Lidar-Derived 1m Digital Elevation Model Data Set for Reynolds Creek Experimental Watershed, Southwestern Idaho [Data set]. Retrieved from http://doi.org/10.18122/B26C7X