Documentation Revision Date: 2016-08-31
Data Set Version: V1
Summary
There are a total of 390 GeoTIFF files in this data set (Table 1). Four shapefiles are provided, containing either the fire boundary of the respective fire area or the area plus a 2-km buffer around the fire perimeters. Note that all of the spatial data products provided are clipped to this 2-km buffer area.
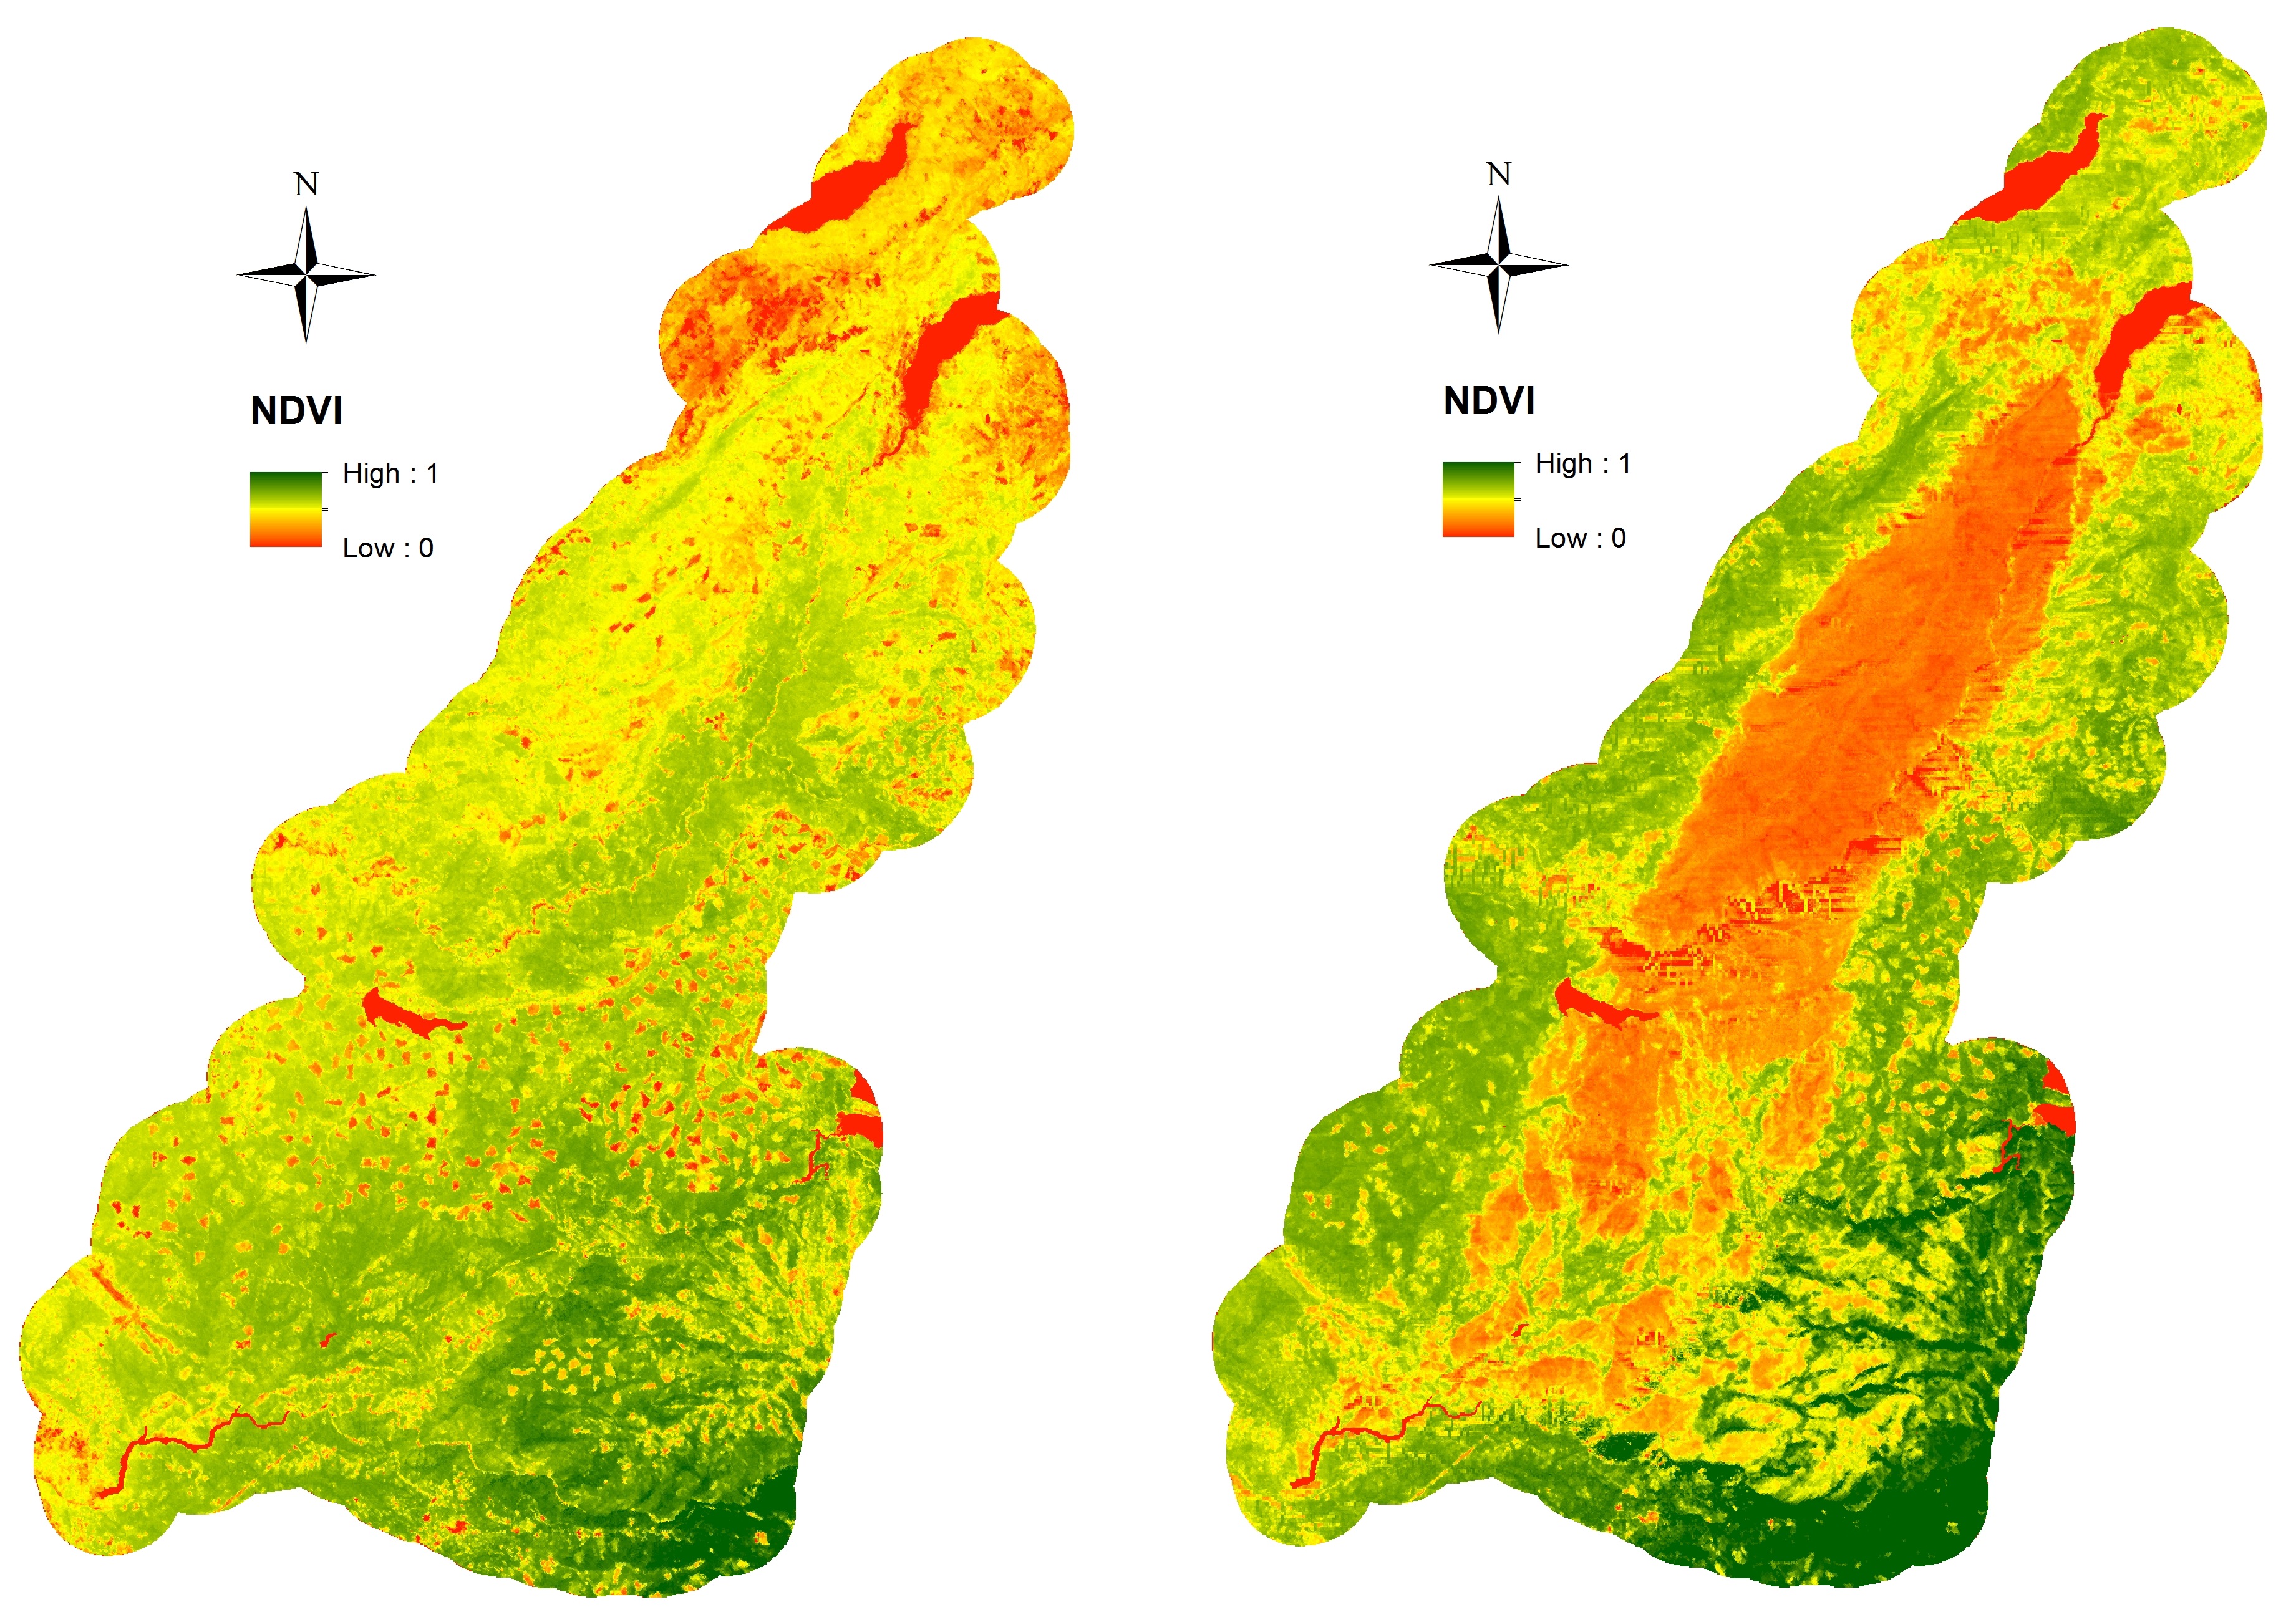
Figure 1. NDVI from MASTER surveys of King Fire area on 09/19/2013 and 11/17/2014.
Citation
Stavros, E.N., Z. Tane, V. Kane, S. Veraverbeke, R. McGaughey, J.A. Lutz, C. Ramirez, and D.S. Schimel. 2016. Remote Sensing Data Before and After California Rim and King Forest Fires, 2010-2015. ORNL DAAC, Oak Ridge, Tennessee, USA. http://dx.doi.org/10.3334/ORNLDAAC/1288
Table of Contents
- Data Set Overview
- Data Characteristics
- Application and Derivation
- Quality Assessment
- Data Acquisition, Materials, and Methods
- Data Access
- References
Data Set Overview
Investigators: Stavros, E.N., Z. Tane, V. Kane, S. Veraverbeke, R. McGaughey, J.A. Lutz, C. Ramirez, and D.S. Schimel.
This data set provides high-resolution surface reflectance, thermal imagery, burn severity metrics, and LiDAR-derived structural measures of forested areas in the Sierra Nevada Mountains, California, USA, collected before and after the August 2013 Rim and September 2014 King mega forest fires.
Three instruments were used in airborne campaigns before and after each megafire. The instruments include the high spatial (14.8 m) and hyperspectral resolution Airborne Visible Infrared Imager (AVIRIS), high-spatial resolution (35 m) MODIS/ASTER (MASTER) thermal infrared imager, and LiDAR.
Pre-fire data were paired with post-fire collections to assess pre- and post-fire landscape characteristics and fire severity. Field estimates of fire severity were collected to compare with derived remote sensing indices.
Related Publication: Stavros, E.N., T. Zachary, V. Kane, S. Veraverbeke, R. McGaughey, J. Lutz, C. Ramirez, & D.S. Schimel. 2016. Unprecedented remote sensing data over the King and Rim Megafires in the Sierra Nevada Mountains of California. Ecology. In press.
Data Characteristics
Spatial Coverage
The Rim Fire occurred in the Stanislaus National Forest and Yosemite National Park in the Sierra Nevada Mountains, California, USA, and burned 104,131 ha.
The King Fire occurred in El Dorado County in the Sierra Nevada Mountains, California, USA, and burned 39,545 ha.
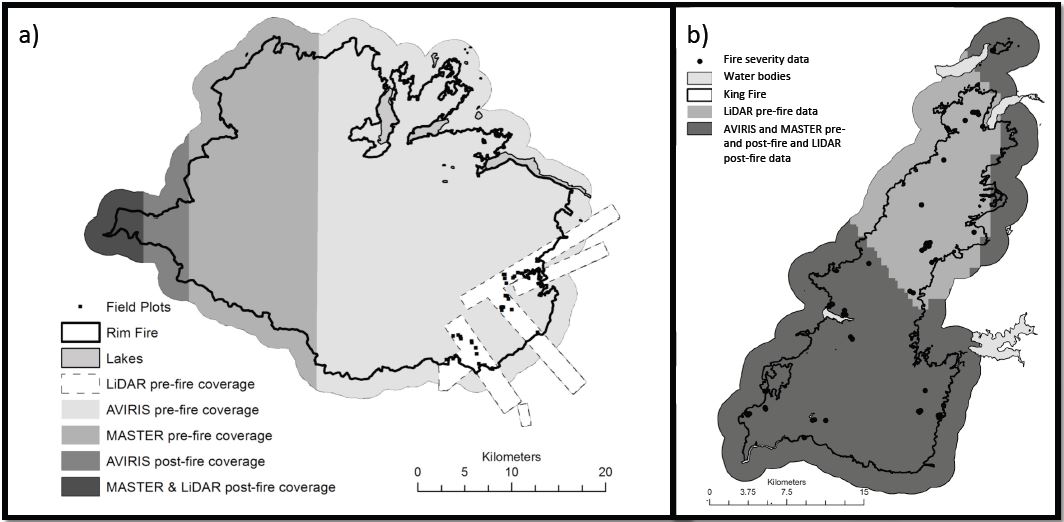
Figure 2. Representations of the spatial extent of pre- and post-fire airborne campaigns for each instrument over the a) Rim Fire and b) King Fire. Note that all post-fire acquisitions cover the full extent of pre-fire acquisitions plus what is represented for the post-fire acquisition.
Spatial Resolution
Product resolution differs depending upon the data source and processing.
- AVIRIS = ~14.6 meters
- MASTER = 35 meters
- LiDAR = 1, 1.5, or 30 meters (depending upon product derivation)
Temporal Coverage
The data cover the period 2010-07-21 to 2014-11-17.
Temporal Resolution
Fifteen aerial surveys were conducted before and after the August 2013 Rim Fire and Spetember 2014 King Fire.
|
Fire |
Sensor |
Before or After Fire |
Aerial Survey Dates |
|
Rim |
AVIRIS |
Before |
2013-06-26 |
|
|
|
After |
2013-11-17 |
|
|
|
After |
2014-06-03 |
|
|
MASTER |
Before |
2013-06-26 |
|
|
|
After |
2013-11-17 |
|
|
|
After |
2014-06-03 |
|
|
LiDAR |
Before |
2010-07-21 |
|
|
|
After |
2013-11-15 |
|
King |
AVIRIS |
Before |
2013-09-19 |
|
|
|
After |
2014-11-17 |
|
|
MASTER |
Before |
2013-09-19 |
|
|
|
Mid-fire |
2014-09-19 |
|
|
|
After |
2014-11-17 |
|
|
LiDAR |
Before |
2013-03-20 |
|
|
|
After |
2015-01-15 |
Study area: (all latitue and longitude given in decimal degrees; datum NAD 1983)
|
Site |
Westernmost Longitude |
Easternmost Longitude |
Northernmost Latitude |
Southernmost Latitude |
|
Rim Fire |
-120.1570 |
-119.6191 |
38.1016 |
37.6964 |
|
King Fire |
-120.7268 |
-120.3529 |
39.1621 |
38.7390 |
Data File Information
Data for each combination of fire, sensor, and survey date are available in two-dimensional GeoTIFF format with geographic information embedded.
- Level 2 (L2) reflectance data from the spectroscopic instruments are stored as multi-band GeoTIFFs. Each L2 AVIRIS GeoTIFF contains 200 bands and each L2 MASTER GeoTIFF contains 34 bands.
- L2 data products derived from the three-dimensional LiDAR point clouds are stored as single-band GeoTIFFs.
- Level 3 (L3) data products, operational metrics produced from the L2 spectroscopic datum, are stored in individual single-band GeoTIFFs.
GeoTIFF Projection Parameters
NAD83_UTM_zone_10N
Authority: EPSG
Projection: Transverse_Mercator
false_easting: 500000.0
false_northing: 0.0
central_meridian: -123.0
scale_factor: 0.9996
latitude_of_origin: 0.0
Linear Unit: Meter (1.0)
Geographic Coordinate System: GCS_North_American_1983
Angular Unit: Degree (0.0174532925199433)
Prime Meridian: Greenwich (0.0)
Datum: D_North_American_1983
Spheroid: GRS_1980
Semimajor Axis: 6378137.0
Semiminor Axis: 6356752.314140356
Inverse Flattening: 298.257222101
Perimeter boundaries of the respective fire study areas are provided as shapefiles.
- Four shapefiles are provided, containing either the fire boundary of the respective fire area or the fire area plus a 2-km buffer around the fire perimeters.
- Note that all of the spatial data products provided are clipped to this 2-km buffer area.
Table 1. Fifteen aerial surveys were conducted before and after the August 2013 Rim and Spetember 2014 King Fires and data were processed into 390 product files.
|
Fire |
Sensor |
Survey Dates |
Level 2 File Count |
Level 3 File Count |
|
Rim |
AVIRIS |
2013-06-26 |
1 |
28 |
|
|
|
2013-11-17 |
1 |
31 |
|
|
|
2014-06-03 |
1 |
31 |
|
|
MASTER |
2013-06-26 |
1 |
21 |
|
|
|
2013-11-17 |
1 |
24 |
|
|
|
2014-06-03 |
1 |
24 |
|
|
LiDAR |
2010-07-21 |
23 |
- |
|
|
|
2013-11-15 |
23 |
- |
|
King |
AVIRIS |
2013-09-19 |
1 |
28 |
|
|
|
2014-11-17 |
1 |
31 |
|
|
MASTER |
2013-09-19 |
1 |
21 |
|
|
|
2014-09-19 |
1 |
24 |
|
|
|
2014-11-17 |
1 |
24 |
|
|
LiDAR |
2013-03-20 |
23 |
- |
|
|
|
2015-01-15 |
23 |
- |
|
|
|
Total files |
103 |
287 |
AVIRIS and MASTER file names are as follows:
FireName_Instrument_YYYYMMDD_L#v#-BandName.tif
Where:
• FireName is either RimFire or KingFire;
• Instrument may be either AVIRIS or MASTER;
• YYYYMMDD is the date of acquisition;
• L# is the data product as either Level 2 (L2) or Level 3 (L3);
• v# is the version number; and,
• BandName distinguishes the spectral band, operational metric, or structural summary statistic.
User notes:
Level 2 spectral band data from the AVIRIS sensor (200 bands) have been combined into one GeoTIFF file. Bands 105-114 and 155-168 were excluded.
Level 2 spectral band data from the MASTER sensor, including bands 1 - 25, 28 - 30, 43, 44, 47 - 49, and an LST band have been combined into one GeoTIFF file.
Table 2. AVIRIS L2 Bands
NOTE: For the latest calibration files for L0-L2 data please see the AVIRIS site directly.
| Band Numbers | Bandwidth (µm) | Spectral Range (µm) |
|---|---|---|
| 1-32 | 0.0094 | 0.41 - 0.70 |
| 33-97 | 0.0094 | 0.68 - 1.27 |
| 98-162 | 0.0097 | 1.25 - 1.86 |
| 163-224 | 0.0097 | 1.84 - 2.45 |
Table 3. MASTER L2 Bands
NOTE: For the most recent calibration information please visit the MASTER website directly.
| Band Number | Band Center (µm) | Bandwidth (µm) | Spectral Range |
|---|---|---|---|
| 1 | 0.46 | 0.04 | 0.440-0.480 |
| 2 | 0.5 | 0.04 | 0.480-0.520 |
| 3 | 0.54 | 0.04 | 0.520-0.560 |
| 4 | 0.58 | 0.04 | 0.560-0.600 |
| 5 | 0.66 | 0.06 | 0.630-0.690 |
| 6 | 0.71 | 0.04 | 0.690-0.730 |
| 7 | 0.75 | 0.04 | 0.730-0.770 |
| 8 | 0.8 | 0.04 | 0.780-0.820 |
| 9 | 0.865 | 0.04 | 0.845-0.885 |
| 10 | 0.905 | 0.04 | 0.885-0.925 |
| 11 | 0.945 | 0.04 | 0.925-0.965 |
| 12 | 1.625 | 0.05 | 1.600-1.650 |
| 13 | 1.675 | 0.05 | 1.650-1.700 |
| 14 | 1.725 | 0.05 | 1.700-1.750 |
| 15 | 1.775 | 0.05 | 1.750-1.800 |
| 16 | 1.825 | 0.05 | 1.800-1.850 |
| 17 | 1.875 | 0.05 | 1.850-1.900 |
| 18 | 1.925 | 0.05 | 1.900-1.950 |
| 19 | 1.975 | 0.05 | 1.950-2.000 |
| 20 | 2.075 | 0.05 | 2.050-2.100 |
| 21 | 2.16 | 0.05 | 2.135-2.185 |
| 22 | 2.21 | 0.05 | 2.185-2.235 |
| 23 | 2.26 | 0.05 | 2.235-2.285 |
| 24 | 2.3295 | 0.065 | 2.297-2.362 |
| 25 | 2.3945 | 0.065 | 2.362-2.427 |
| 28 | 3.45 | 0.15 | 3.375-3.525 |
| 29 | 3.6 | 0.15 | 3.525-3.675 |
| 30 | 3.75 | 0.15 | 3.675-3.825 |
| 43 | 8.7 | 0.4 | 8.50-8.90 |
| 44 | 9.1 | 0.4 | 8.90-9.30 |
| 47 | 10.625 | 0.65 | 10.30-10.95 |
| 48 | 11.3 | 0.7 | 10.95-11.65 |
| 49 | 12.05 | 0.5 | 11.80-12.30 |
Table 4. Level 3 products and BandNames for AVIRIS and MASTER sources as used in the respective GeoTIFF file names provided with this data set. Source products are listed side-by-side to show Level 3 products in common.
|
Product |
AVIRIS Level 3 Product |
Band Name |
MASTER Level 3 Product |
Band Name |
|---|---|---|---|---|
|
1 |
Anthocyanin Reflectance Index 1 |
ARI1 |
|
|
|
2 |
Anthocyanin Reflectance Index 2 |
ARI2 |
|
|
|
3 |
Atmospherically Resistant Vegetation Index |
ARVI |
|
|
|
4 |
|
|
Burned Area Index |
BAI |
|
5 |
Carotenoid Reflectance Index 1 |
CRI1 |
|
|
|
6 |
Carotenoid Reflectance Index 2 |
CRI2 |
|
|
|
7 |
Char Soil Index |
CSI |
Char Soil Index |
CSI |
|
8 |
|
|
Char Soil Index Thermal |
CSIT |
|
9 |
differenced Normalized Burn Ratio |
dNBR |
differenced Normalized Burn Ratio |
dNBR |
|
10 |
Enhanced Vegetation Index |
EVI |
Enhanced Vegetation Index |
EVI |
|
11 |
|
|
Global Environment Monitoring Index |
GEMI |
|
12 |
|
|
Global Environment Monitoring Index 3 |
GEMI3 |
|
13 |
|
|
Mid Infrared Burn Index |
MIRBI |
|
14 |
Modified Carotenoid Reflectance Index Green Model |
mCRIG |
|
|
|
15 |
Modified Carotenoid Reflectance Index Red Edge Model |
mCRIEE |
|
|
|
16 |
Modified Chlorophyll Absorption Ratio Index |
mCARI |
|
|
|
17 |
Modified Red Edge Normalized Difference Vegetation Index |
mNDVI705 |
|
|
|
18 |
Modified Red Edge Simple Ratio Index |
mSR705 |
|
|
|
19 |
Modified Soil Adjusted Vegetation Index |
mSAVI |
Modified Soil Adjusted Vegetation Index |
MSAVI |
|
20 |
Moisture Stress Index |
MSI |
|
|
|
21 |
|
|
Near-Shortwave Infrared Emissivity version 1 |
NSEv1 |
|
22 |
|
|
Near-Shortwave Infrared Emissivity version 2 |
NSEv2 |
|
23 |
|
|
Near-Shortwave Infrared Temperature version 1 |
NSTv1 |
|
24 |
|
|
Near-Shortwave Infrared Temperature version 2 |
NSTv2 |
|
25 |
Normalized Burn Ratio |
NBR |
Normalized Burn Ratio |
NBR |
|
26 |
|
|
Normalized Burn Ratio Thermal |
NBRT |
|
27 |
Normalized Difference Infrared Index |
NDII |
|
|
|
28 |
Normalized Difference Lignin Index |
NDLI |
|
|
|
29 |
Normalized Difference Nitrogen Index |
NDNI |
|
|
|
30 |
Normalized Difference Vegetation Index |
NDVI |
Normalized Difference Vegetation Index |
NDVI |
|
31 |
|
|
Normalized Difference Vegetation Index Thermal |
NDVIT |
|
32 |
Photochemical Reflectance Index |
PRI |
|
|
|
33 |
Plant Senescence Reflectance Index |
PSRI |
|
|
|
34 |
Red Edge Normalized Difference Vegetation Index |
NDVI705 |
|
|
|
35 |
Red Edge Position Index |
REPI |
|
|
|
36 |
Red Green Ration Index |
RGRI |
|
|
|
37 |
Relative Burn Ratio |
RBR |
Relative Burn Ratio |
RBR |
|
38 |
Relative difference Normalized Burn Ratio |
RdNBR |
Relative difference Normalized Burn Ratio |
RdNBR |
|
39 |
|
|
Shortwave Middle Infrared Index |
SMI |
|
40 |
Simple Ratio Index |
SR |
|
|
|
41 |
|
|
Soil Adjusted Vegetation Index |
SAVI |
|
42 |
|
|
Soil Adjusted Vegetation Index Thermal |
SAVIT |
|
43 |
Structure Insensitive Pigment Index |
SIPI |
|
|
|
44 |
|
|
Vegetation Index 3 |
VI3 |
|
45 |
|
|
Vegetation Index 6 Thermal |
VI6T |
|
46 |
Vogelmann Red Edge Index 1 |
VOG1 |
|
|
|
47 |
Water Band Index |
WBI |
|
|
LiDAR file names are as follows:
FireName_Instrument_YYYYMMDD_L#v#-BandName.tif
Where:
• FireName is either RimFire or KingFire;
• Instrument is LiDAR;
• YYYYMMDD is the date of acquisition;
• L# is the data product as either Level 2 (L2) or Level 3 (L3);
• v# is the version number; and,
• BandName distinguishes the spectral band, operational metric, or structural summary statistic.
For LiDAR metrics, there are 1, 1.5, and 30-m resolution products. The resolution is part of the BandName. 30-m resolution GeoTIFFs span the full extent of coverage.
Table 5. Level 2 products and BandNames for the LiDAR source as used in the respective GeoTIFF files names provided with this data set.
|
Product |
LIDAR Level 2 Product |
Band Name |
|
1 |
Canopy height model |
Canopy_height_model_1meter |
|
2 |
Intensity |
Intensity_1p5meter |
|
3 |
Count of all returns - 30 meter |
Count_all_returns_30meter |
|
4 |
Count of first returns - 30 meter |
Count_first_returns_30meter |
|
5 |
Canopy cover >2 m from first returns |
Cover_first_returns_above_2m_30meter |
|
6 |
Canopy cover >2 m from all returns |
Cover_all_returns_above_2m_30meter |
|
7 |
Canopy cover 2-8 m from all returns |
Cover_all_returns_above_2to8m_30meter |
|
8 |
Canopy cover 8-16 m from all returns |
Cover_all_returns_above_8to16m_30meter |
|
9 |
Canopy cover 16-32 m from all returns |
Cover_all_returns_above_16to32m_30meter |
|
10 |
Canopy cover >32 m from all returns |
Cover_all_returns_above_32m_30meter |
|
11 |
Mean height for all returns above 2 m |
Height_mean_all_returns_above_2m_30meter |
|
12 |
Height of 25th percentile for returns above 2 m |
Height_P25_all_returns_above_2m_30meter |
|
13 |
Height of 50th percentile for returns above 2 m |
Height_P50_all_returns_above_2m_30meter |
|
14 |
Height of 75th percentile for returns above 2 m |
Height_P75_all_returns_above_2m_30meter |
|
15 |
Height of 95th percentile for returns above 2 m |
Height_P95_all_returns_above_2m_30meter |
|
16 |
Standard deviation of all height returns above 2 m |
Height_stdev_all_returns_above_2m_30meter |
|
17 |
Rumple – rugosity of canopy surface |
Rumple_30meter |
|
18 |
Aspect |
Topography_aspect_30meter |
|
19 |
Elevation |
Topography_elevation_30meter |
|
20 |
Slope |
Topography_slope_30meter |
|
21 |
SRI – topographic Solar Radiation Index |
Topography_sri_30meter |
|
22 |
Intensity 95% |
Intensity_95percent_30meter |
|
23 |
Intensity mean |
Intensity_mean_30meter |
|
24 |
Canopy cover >2 m from first returns |
Cover_1st_returns_above_2m_30meter (RimFire files only.) |
Table 6. Rim Fire GeoTIFF file spatial data properties.
|
|
GeoTIFFs grouped by Sensor and Product Level |
|||||
|
Spatial Data Properties |
AVIRIS L2 |
AVIRIS L3 |
LIDAR 1-meter* |
LIDAR 30-meter |
MASTER L2 |
MASTER L3 |
|
Upper |
38.0971 |
38.0971 |
37.9832 |
37.9362 |
38.1016 |
38.1016 |
|
Lower |
37.697 |
37.697 |
37.6571 |
37.6591 |
37.6966 |
37.6966 |
|
Left |
-120.02 |
-120.02 |
-119.92 |
-119.86 |
-120.16 |
-120.16 |
|
Right |
-119.62 |
-119.62 |
-119.57 |
-119.63 |
-119.62 |
-119.62 |
|
Columns |
2282 |
2282 |
30181 |
669 |
1311 |
1311 |
|
Rows |
2926 |
2926 |
35191 |
1003 |
1242 |
1242 |
|
Cell Size |
14.8 |
14.8 |
1 |
30 |
35 |
35 |
|
Bands |
224 |
1 |
1 |
1 |
34 |
1 |
|
NoData Value |
-1.7e+308 |
-9999 |
-9999 |
-9999 |
-1.7e+308 |
-9999 |
|
Compression Type |
LZW |
LZW |
LZW |
LZW |
LZW |
LZW |
*Note: canopy height model intensity GeoTIFFs are 1-meter resolution. King Fire intensity is 1.5-meter.
Table 7. King Fire GeoTIFF file spatial data properties.
|
|
GeoTIFFs grouped by Sensor and Product Level |
||||||
|
Spatial Data Properties |
AVIRIS L2 |
AVIRIS L3 |
LIDAR 1-meter |
LIDAR 1.5-meter |
LIDAR 30-meter |
MASTER L2 |
MASTER L3 |
|
Upper |
39.1763 |
39.1763 |
39.2192 |
39.219 |
39.2191 |
39.1621 |
39.1621 |
|
Lower |
38.6536 |
38.6536 |
38.8968 |
38.8984 |
38.897 |
38.7392 |
38.7392 |
|
Left |
-120.81 |
-120.81 |
-120.68 |
-120.68 |
-120.68 |
-120.73 |
-120.73 |
|
Right |
-120.16 |
-120.16 |
-120.38 |
-120.44 |
-120.38 |
-120.35 |
-120.35 |
|
Columns |
3792 |
3792 |
25101 |
13360 |
836 |
892 |
892 |
|
Rows |
3872 |
3872 |
35121 |
23380 |
1170 |
1318 |
1318 |
|
Cell Size |
14.6 |
14.6 |
1 |
1.5 |
30 |
35 |
35 |
|
Bands |
200 |
1 |
1 |
1 |
1 |
34 |
1 |
|
NoData Value |
-1.7e+308 |
-9999 |
-9999 |
-9999 |
-9999 |
-1.7e+308 |
-9999 |
|
Compression Type |
LZW |
LZW |
LZW |
LZW |
LZW |
LZW |
LZW |
Shapefiles
Four shapefiles are provided, containing either (1) the perimeter boundaries of the respective fire areas or (2) the fire areas plus a 2-km buffer around the fire perimeters. There are no additional attributes provided.
Note that all of the spatial data products provided are clipped to this 2-km buffer area.
Fire perimeters:
- KingFirePerimeter.shp (KingFirePerimeter.zip)
- RimFirePerimeter.shp (RimFirePerimeter.zip)
Fire perimeters plus 2-km buffer:
- KingFireBuffer.shp (KingFireBuffer.zip)
- RimFireBuffer.shp (RimFireBuffer.zip)
Application and Derivation
Megafire frequency is predicted to increase in the future, necessitating a greater understanding of pre- and post-fire landscape characteristics. This data set provides unique before and after conditions that when combined with other data can be used to investigate megafire drivers and relationship to forest management practices with respect to forest structure, type, biomass, and condition, at unprecedented spatial resolution.
This data set includes high-resolution GeoTIFF products containing useful metrics for severity analyses of the August 2013 Rim and September 2014 King megafires in the Sierra Nevada Mountains of California.
Quality Assessment
Both AVIRIS and MASTER products have been validated in distinct studies as part of the pre-Hyperspectral Infrared Imager airborne campaign. The airborne campaign provides the basis for radiance measurement calibration and algorithm refinement for deriving level 2 reflectance, emissivity, and land surface temperature from radiance measurements. Level 2 products have been validated in other studies (Green et al., 1998; Hook et al., 2001).
To demonstrate the full utility of the indices derived from the level 2 products, in situ fire severity estimates represented by the Geo Composite Burn Index (GeoCBI) were gathered for the two fires (Van Wagtendonk et al., 2004). Each plot contained the full range of variation in fire severity found within the mixed conifer fuel type of the Sierra Nevadas. The plots were at least 200 m apart and chosen in relatively homogeneous areas of fuel type and fire severity.
Field sites were classified by GeoCBI fire severity classification to investigate differences in the spectral signatures (Figure 3). Field metrics were regressed against the mean index value of the pixels containing each field plot. The results are consistent with those derived from other broadband spectroscopic sensors (e.g., Landsat and MODIS) in that they indicate a drop in the near-infrared (NIR, 0.85-0.88 μm) as vegetation is removed and an increase in shortwave infrared (SWIR, 2.1-2.3 μm) as char and soil exposure remains.
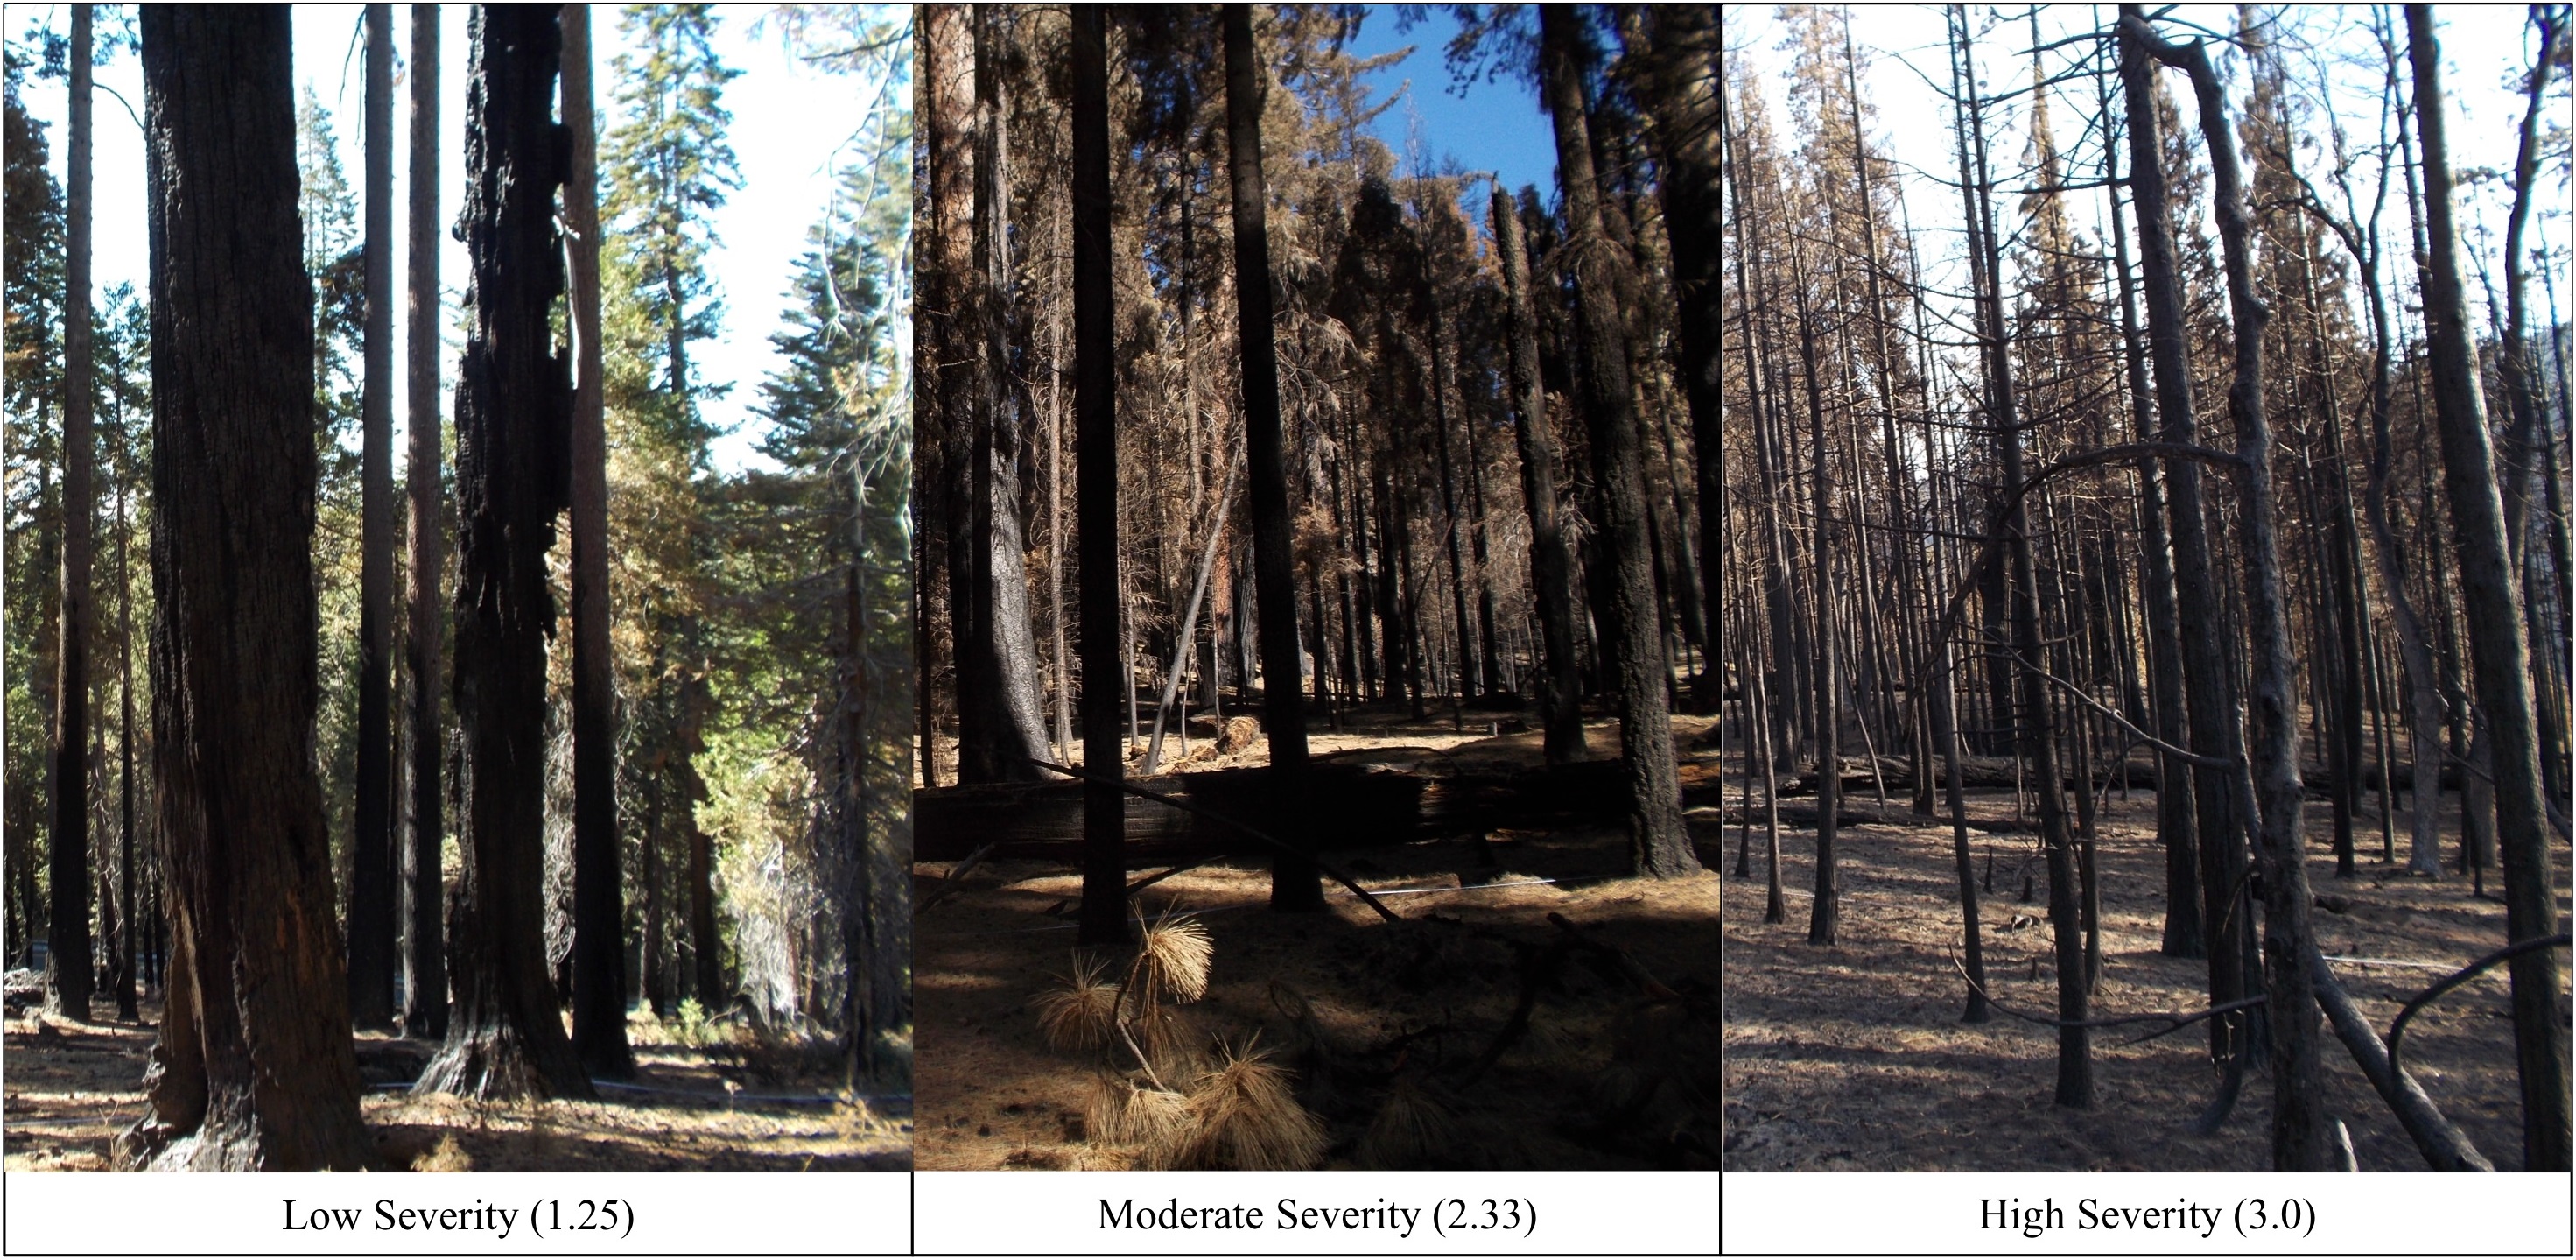
Figure 3. In situ fire severity classifications according to the Geo-Composite Burn Index (GeoCBI).
Level 2 LiDAR products were created using the well-established FUSION software (McGaughey, 2014), thus other studies are relied upon to demonstrate their utility and accuracy.
Data Acquisition, Materials, and Methods
There were three instruments used in the airborne campaigns imaging before and after each megafire: AVIRIS, MASTER, and LiDAR. Details of the data collection and processing are available in the related publication Stavros et al., 2016.
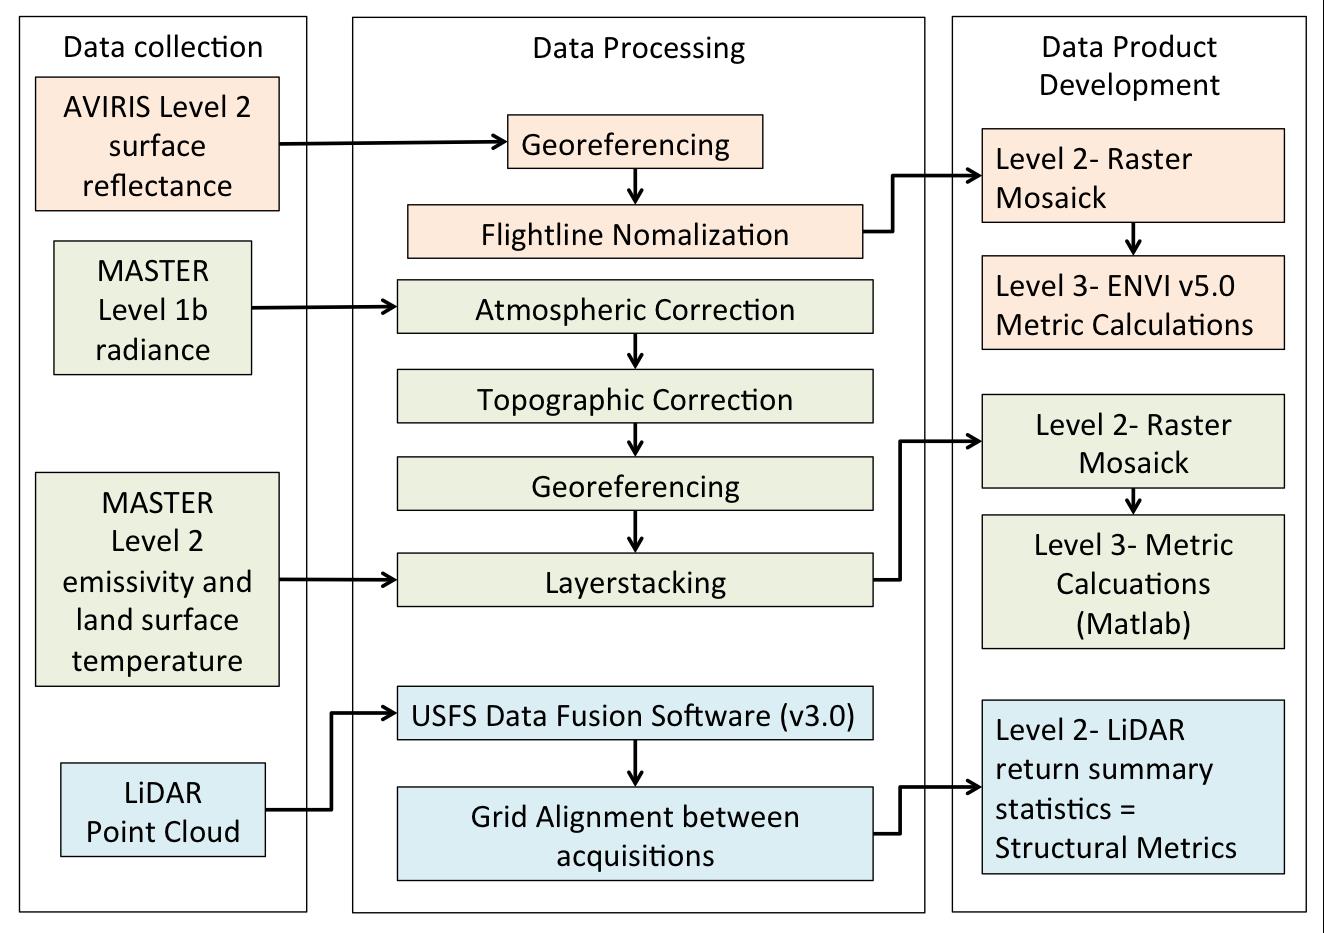
Figure 4. Processing stream for each airborne instrument: AVIRIS, MASTER, and LiDAR
AVIRIS Products:
AVIRIS is a spectroscopic imager that continually samples the visual to shortwave infrared wavelengths with high spectral resolution. AVIRIS collects 224 contiguous 0.01 μm channels spanning from 0.35 μm to 2.5 μm with a 14.8 m spatial resolution.
• For the Rim Fire, the pre-fire AVIRIS data were acquired on June 26, 2013 covering approximately 64% of the fire area and the post-fire were acquired on June 3, 2014.
• The swath width of AVIRIS is narrower than from MASTER, consequently less of the Rim Fire area was imaged before the fire.
• For the King Fire, AVIRIS data cover 100% of the fire with a 2 km buffer both before and after the fire.
Level 2, georectified and atmospherically-corrected surface reflectance and calculated Level 3 operational metrics are provided as rasters for the fire areas with a 2 km buffer. Products were derived by processing and mosaicking the Level 2 and Level 3 products as follows:
• For each flightline, the Atmosphere Removal Algorithm (ATREM) was used to convert radiance measurements to surface reflectance. Images were then manually georeferenced using 1 m digital orthophoto quarter quadrangle images, resampled to the same resolution as AVIRIS.
• Before mosaicking, flightlines were normalized to each other to reduce differences in the bidirectional reflectance distribution function, a step necessary to minimize the alternating North-South flight path for each line. The normalization used a modified version of the Canty normalization algorithm. The modified approach considers normalization by band rather than considering all 224 bands together. The advantage of implementing the modified approach was to reduce errors in the normalizations.
• Lastly flightlines were then mosaicked together to provide rasters of Level 2 surface reflectance (excluding high water absorption bands 105 to 114 and 155 to 168) and Level 3 operational metrics.
Operational metrics were selected that are most widely accepted and correlated with physiological phenomenon over a broad set of species.
• The bands used in the calculation for each metric (Table 2) were selected automatically from ENVI v5.0, which uses the scientific literature to define the optimal wavelengths for metric calculation.
• Differenced metrics (e.g., differenced Normalized Burn Ratio – dNBR) were determined based on the difference of the acquisition for which the metric is derived (e.g., November 17) and June 26, 2013 acquisition for the Rim Fire or the September 9, 2013 acquisition for the King Fire.
MASTER Products:
MASTER is a multi-spectral imager operating in the visible-shortwave infrared and thermal infrared (TIR) regions from 0.4 -13 um collected across 50 channels and allowing calculation of land surface temperature and emissivity from the multi-band thermal data.
• The airborne MASTER data extends over approximately 96% of the Rim Fire perimeter and approximately 92% of the perimeter with a 2 km buffer in the months preceding ignition (June 26, 2013) and to full extent of this boundary after the fire.
• For the King Fire, MASTER data cover 100% of the fire with a 2 km buffer in single flightline.
Data were downloaded as geolocated, calibrated radiances (Level 1B) for the visual (VIR), shortwave (SWIR), and middle infrared (MIR) regions and as land surface temperature (LST) and emissivity in the TIR (Level 2).
• The atmospheric radiative model MODTRAN was used to process Level 1B radiance to surface reflectance in the 25 bands from VIR to SWIR.
• Because the MIR is less sensitive to aerosols, the same methodology was employed as that proposed by Kaufman and Remer, to convert from radiance to reflectance. Both VISWIR and MIR were topographically corrected by implementing the modified c-correction method using the cosine of incidence.
• Lastly, in the TIR, we download Level 2 data directly, which uses a land surface temperature and emissivity separation algorithm.
Using the topographically, atmospherically-corrected, and georectified Level 2 data, indices were calculated for each acquisition date. These indices were calculated assuming optimal bands at distinguishing all char, green vegetation, substrate, and non-photosynthetic vegetation.
• Indices were determined based on literature and are provided as Level 3 data products.
• Differenced metrics were determined based on the difference of the acquisition for which the metric is derived and June 26, 2013 acquisition for the Rim Fire or the September 9, 2013 acquisition for the King Fire.
LiDAR Products:
LiDAR data can be used to develop high-resolution ground models and to study vegetation structure based on the height of returns from foliage and the intensity of returns.
Rim Fire
Two sets of airborne LiDAR data were collected over areas burned by the Rim Fire.
• The 2010 LiDAR acquisition (10,895 ha) was collected to enable studies of the interaction of fire with forests for the mixed-severity fires that had previously burned the area, approximately half of this area was subsequently burned by the Rim Fire.
• The 2013 post-fire LiDAR acquisition includes the entire area of the Rim Fire, the 2010 LiDAR acquisition, and a 2 km buffer around the area of the Rim Fire.
• The 2010 and 2013 LiDAR acquisitions were acquired using commercial, small footprint, discrete return instruments.
• One-meter resolution digital terrain models (DTM) were produced from each acquisition by its vendor.
King Fire
Two sets of airborne LiDAR data were collected over areas burned by the King Fire.
• In 2012, the King Fire LiDAR data covers 34% of the eventual fire area.
• In 2015, coverage was 100% with a 2 km buffer after the fire.
• The 2012 and 2015 LiDAR acquisitions were acquired using commercial, small-footprint, discrete return instruments.
• One-meter resolution digital terrain models (DTM) were produced from each acquisition by its vendor.
Processing:
THE USFS FUSION software package, version 3 (McGaughey, 2014) was used to produce raster data files of metrics from each vendor's LiDAR return data. The metrics from the two acquisitions were processed so that their grid arrays align. Metrics available are listed in Table 8. All canopy metrics are normalized to the height above ground.
LiDAR data layers available include:
• Return height metrics, calculated for returns >2 m in height to separate measurements of the tree canopy from ground and shrub returns.
• Canopy cover metrics were calculated as the proportion of returns within a height stratum, such as 2 to 8 m, divided by all returns in that stratum and below.
• The canopy surface models were calculated using the height of the highest return for each 1-1.5 m grid cell. The intensity image was produced using the maximum intensity for each 1-1.5 m grid cell. The topographic metrics were calculated from the 1 m digital terrain model.
Data Access
These data are available through the Oak Ridge National Laboratory (ORNL) Distributed Active Archive Center (DAAC).
Remote Sensing Data Before and After California Rim and King Forest Fires, 2010-2015
Contact for Data Center Access Information:
- E-mail: uso@daac.ornl.gov
- Telephone: +1 (865) 241-3952
References
Green, R. O., M.L. Eastwood, C.M. Sarture, T.G. Chrien, M. Aronsson, B.J. Chippendale, J.A. Faust, B.E. Pavri, C.J. Chovit, M. Solies, M.R. Olah, & O. Williams. 1998. Imaging spectroscopy and the Airborne Visisble/Infrared Imaging Spectrometer (AVIRIS). Remote Sens. Environ. 65, 225-248.
Hook, S.J., Myers, J.J.J., Thome, K.J., Fitzgerald, M. & Kayle, A. B. 2001. The MODIS/ASTER airborne simulator (MASTER) -- a new instrument for earth science studies. Remote Sens. Environ. 76, 93-102.
McGaughey, R.J. 2014. FUSION/LDV: Software for LiDAR data analysis and visualization.
Stavros, E.N., T. Zachary, V. Kane, S. Veraverbeke, R. McGaughey, J. Lutz, C. Ramirez, & D.S. Schimel. 2016. Unprecedented remote sensing data over the King and Rim Megafires in the Sierra Nevada Mountains of California. Ecology. In press.
Van Wagtendonk, J.W., Root, R.R. & Key, C.H. 2004. Comparison of AVIRIS and Landsat ETM+ detection capabilities for burn severity. Remote Sens. Environ. 92, 397-408.