Documentation Revision Date: 2017-08-30
Data Set Version: 1
Summary
There is one data file in GeoTIFF (.tif) format included in this dataset.
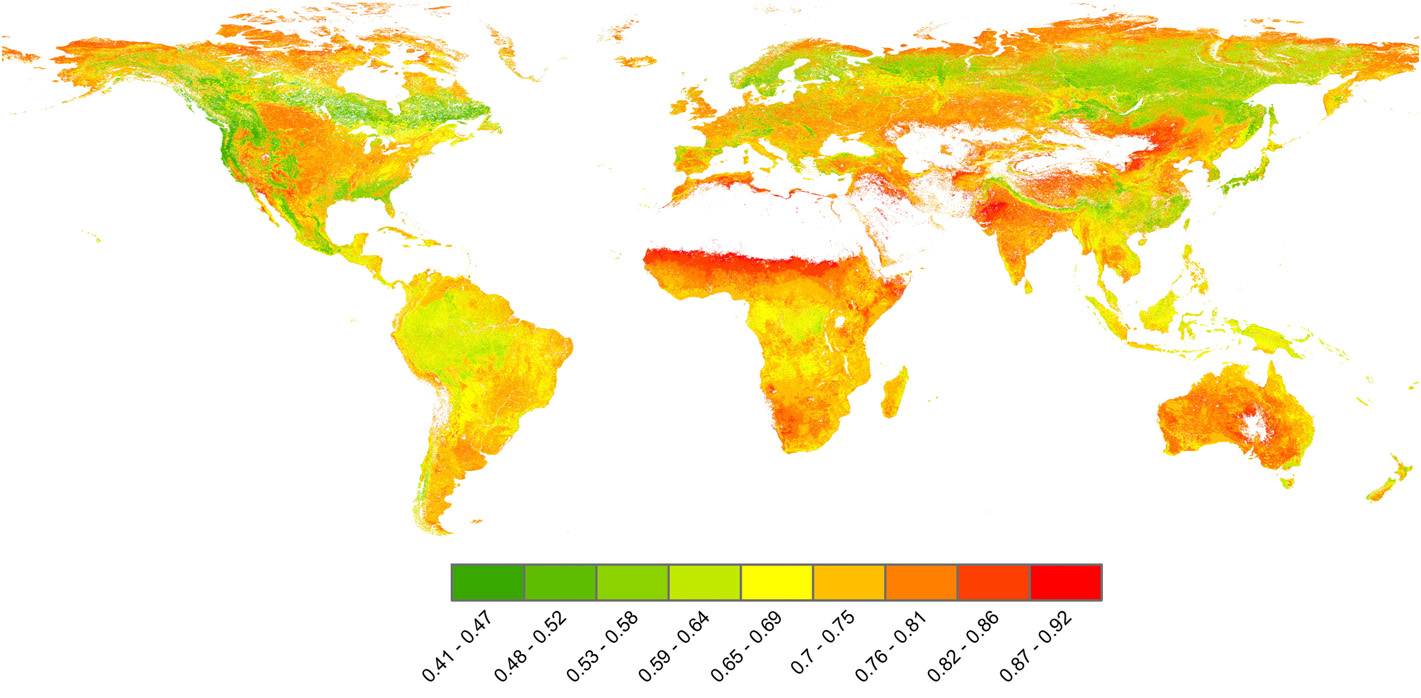
Figure 1. Global map of MODIS-derived clumping index in 2006 (from He et al. 2012). Clumping index values range from 0 to 1 (maximum clumping to minimum clumping) representing the degree of foliage grouping within distinct canopy structures, such as tree crowns, shrubs, and row crops, relative to a random distribution (CI=1).
Citation
He, L., J.M. Chen, J. Pisek, C. Schaaf, and A.H. Strahler. 2017. Global 500-m Foliage Clumping Index Data Derived from MODIS BRDF, 2006. ORNL DAAC, Oak Ridge, Tennessee, USA. https://doi.org/10.3334/ORNLDAAC/1531
Table of Contents
- Data Set Overview
- Data Characteristics
- Application and Derivation
- Quality Assessment
- Data Acquisition, Materials, and Methods
- Data Access
- References
Data Set Overview
This dataset provides global clumping index (CI) data for 2006 derived from the MODIS Bidirectional Reflectance Distribution Function (BRDF) data product. Clumping index is a key structural parameter of plant canopies which represents the degree of foliage grouping within distinct canopy structures relative to a random distribution. The data are provided at substantially higher resolution (500-m) than existing clumping index data products.
Acknowledgements:
This dataset was produced with funding from NASA's Earth Science Division/Terrestrial Ecology Program under grant number NNX08AE94A (PI Crystal Schaaf).
Related Publications:
He, L., J.M. Chen, J. Pisek, C.B. Schaaf, A.H. Strahler. 2012. Global clumping indexmap derived from the MODIS BRDF product, Remote Sensing of Environment 119: 118-130. https://doi.org/10.1016/j.rse.2011.12.008
Data Characteristics
Spatial Coverage: Global
Spatial Resolution: 500 m
Temporal Coverage: 20060101 - 20061231
Temporal Resolution: Once
Study Area (All latitude and longitude given in decimal degrees.)
| Site | Westernmost Longitude | Easternmost Longitude | Northernmost Latitude | Southernmost Latitude |
|---|---|---|---|---|
| Global | -180 | 180 | 90 | -90 |
Data File Information
This dataset contains a global clumping index (CI) map in GeoTIFF format (global_clumping_index.tif) based on data from 2006, as published in He et al. (2012). Clumping index values range from 0 to 1 (maximum clumping to minimum clumping) representing the degree of foliage grouping within distinct canopy structures, such as tree crowns, shrubs, and row crops, relative to a random distribution (CI=1).
Spatial Data Properties
Spatial Representation Type: Raster
Pixel Depth: 8 bit
Pixel Type: unsigned integer
Compression Type: LZW
Number of Bands: 1
Raster Format: TIFF
No Data Value: 255
Scale Factor: 0.01
Spatial Reference Properties
WGS_1984_Sinusoidal
Projection: Sinusoidal
false_easting: 0.0
false_northing: 0.0
central_meridian: 0.0
Linear Unit: Meter (1.0)
Geographic Coordinate System: GCS_sphere_modis
Angular Unit: Degree (0.0174532925199433)
Prime Meridian: Greenwich (0.0)
Datum: D_custom
Spheroid: custom
Semimajor Axis: 6371007.181
Semiminor Axis: 6371007.181
Inverse Flattening: 0.0
Application and Derivation
Clumping index is a key structural parameter of plant canopies and very useful in ecological and meteorological models. The 500-m resolution global clumping index map included in this dataset is at substantially higher resolution than the existing 6-km map derived from the POLDER data. This improvement is critical for global LAI mapping which is generally done at 1-km resolution.
Quality Assessment
Hotspot BRF derived from MODIS and POLDER data were very closely correlated after MODIS hotspot correction was applied (He et al., 2012).
Field-measured CI from 38 sites were used to evaluate the performance of hotspot-corrected Normalized Difference between Hotspot and Darkspot (NDHD) index and to tune the parameters to get accurate CI. The median values of MODIS-derived seasonal trajectories of CI for the 38 sites show a high correlation with field measurements. See He et al. (2012) for detailed descriptions of evaluation methods applied to the global CI product.
Data Acquisition, Materials, and Methods
Clumping Index
Clumping index (CI), quantifying the level of foliage grouping within distinct canopy structures relative to a random distribution, is a key structural parameter of plant canopies and very useful in ecological and meteorological models. Previous estimates of global CI relied on a combination of the Normalized Difference between Hotspot and Darkspot (NDHD) index and POLarization and Directionality of the Earth's Reflectances (POLDER) data for estimation at ~6-km resolution (Chen et al., 2005).
For the current dataset, NDHD was reconstructed using the red band of the MODIS Bidirectional Reflectance Distribution Function (BRDF) parameters product from 2006 (MCD43A1, collection 5) in order to generate a global CI map at 500-m resolution using an approach described in He et al. (2012).
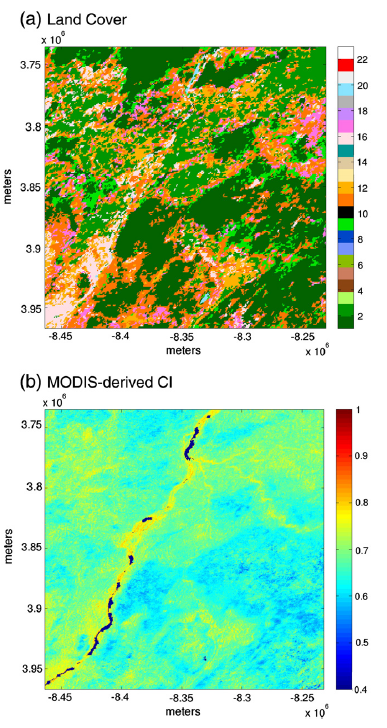
Figure 2. Comparison of MODIS-derived clumping index map with land cover. All land covers are broad-leaved forests. The CI clearly shows the pattern of evergreen broad-leaved forests in the land cover map (from He et al. 2012).
He et al. (2012) corrected the MODIS hotspot magnitude with co-registered POLDER data acquired at about the same time. After the MODIS hotspot was corrected and NDHD was calculated, MODIS CI was derived using the coefficients calculated from the second-order polynomial fit of the tabulated relationship between the CI and NDHD:
CI(θs) = A(θs)*NDHD+B(θs)
where A and B are coefficients determined through the linear regression and tabulated for different solar zenith angles (θs), crown shapes, and bands by model simulations (Chen et al., 2005). The GLC2000 land cover (GLC, 2003) was used to determine canopy crown shapes used by the algorithm. The land cover classification system is described in He et al. (2012), Table 2. Clumping index values range from 0 to 1 (maximum clumping to minimum clumping) representing the degree of foliage grouping relative to a random distribution (CI=1). CI greater than 1 indicates a regular distribution.
Ten broad-leaved forest sites were used in validation, too few for a reliable validation. However, for the broad-leaved forest area the global CI spatial pattern is very similar to the pattern of land cover distribution, suggesting that the MODIS-derived map has effectively captured the structural differences among cover types (see Figure 2).
See He et al. (2012) for a more detailed description of the MODIS CI derivation methods.
Data Access
These data are available through the Oak Ridge National Laboratory (ORNL) Distributed Active Archive Center (DAAC).
Global 500-m Foliage Clumping Index Data Derived from MODIS BRDF, 2006
Contact for Data Center Access Information:
- E-mail: uso@daac.ornl.gov
- Telephone: +1 (865) 241-3952
References
Chen, J.M., C.H. Menges, and S.G. Leblanc. 2005. Global mapping of foliage clumping index using multi-angular satellite data. Remote Sensing of Environment 97: 447–457. https://doi.org/10.1016/j.rse.2005.05.003
GLC 2003. Global land cover 2000 database. European Commission, Joint Research Centre, 2003.
He, L., J.M. Chen, J. Pisek, C.B. Schaaf, A.H. Strahler. 2012. Global clumping indexmap derived from the MODIS BRDF product, Remote Sensing of Environment 119: 118-130. https://doi.org/10.1016/j.rse.2011.12.008