Get Data
Summary:
This data set provides three data files in text format (.txt). One file contains monthly above-ground biomass measurements made in 1965 in a humid grass savanna at the Lamto Research Station, Cote Ivoire, Africa. The second file contains monthly above- and below-ground biomass measurements and calculations of carbon/nitrogen ratio of above-ground live and dead biomass and below-ground biomass from the same site for 1969-1987. The third file contains monthly and annual climate data for the study site for the period 1969-1990.
Total net primary production (NPP) of the Loudetia simplex grass savanna was estimated at 2,150 g/m2/yr, of which 1,320 g/m2/yr (61%) was below-ground production. Normally 50-90% of above-ground grass biomass is burned annually,
Revision Notes: Only the documentation for this data set has been modified. The data files have been checked for accuracy and are identical to those originally published in 1996.
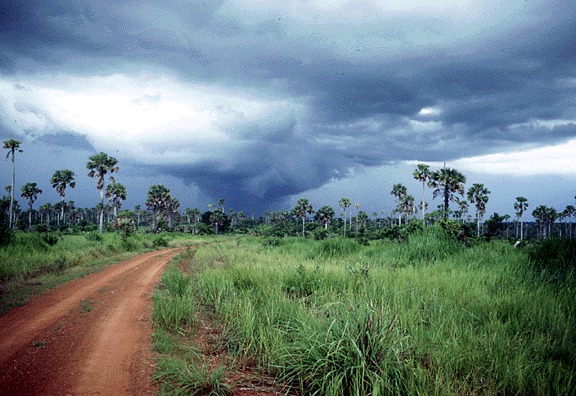
Figure 1. A storm during the rainy season at the Lamto grassland site, Cote d'Ivoire. (The track shows the tropical ferruginous soil. Note also the grass layer and palm trees. Photograph taken July 1989 by Dr. P. Mordelet, CESBIO, France).
Additional Documentation
The NPP data collection contains field measurements of biomass, estimated NPP, and climate data for terrestrial grassland, tropical forest, temperate forest, boreal forest, and tundra sites worldwide. Data were compiled from the published literature for intensively studied and well-documented individual field sites and from a number of previously compiled multi-site, multi-biome data sets of georeferenced NPP estimates. The principal compilation effort (Olson et al., 2001) was sponsored by the NASA Terrestrial Ecology Program. For more information, please visit the NPP web site at http://daac.ornl.gov/NPP/npp_home.shtml.
Data Citation:
Cite this data set as follows:
Menaut, J.-C. 2015. NPP Grassland: Lamto, Ivory Coast, 1965-1987, R1. Data set. Available on-line [http://daac.ornl.gov] from Oak Ridge National Laboratory Distributed Active Archive Center, Oak Ridge, Tennessee, USA. http://dx.doi.org/10.3334/ORNLDAAC/150
This data set was originally published as:
Menaut, J.-C. 1996. NPP Grassland: Lamto, Ivory Coast, 1965-1987. Data set. Available on-line [http://daac.ornl.gov] from Oak Ridge National Laboratory Distributed Active Archive Center, Oak Ridge, Tennessee, U.S.A.
Table of Contents:
- 1 Data Set Overview
- 2 Data Description
- 3 Applications and Derivation
- 4 Quality Assessment
- 5 Acquisition Materials and Methods
- 6 Data Access
- 7 References
1. Data Set Overview:
Project: Net Primary Production (NPP)
NPP was determined initially as part of a general study of the Lamto savanna region. Lamto is part of the SALT (Savannas in the Long-Term) transect running from Cote Ivoire across Burkina Faso to Niger. Later data synthesis took place with the support of CNRS (Centre Nationale de Recherche Scientifique) - Ecole Normale Superieure, Paris, France, under a collaborative SCOPE Project on modeling of grassland productivity and soil organic matter worldwide (Parton et al., 1993).
The 2,500-hectare Lamto Research Station (6.22 N -5.03 W) is situated near the edge of the rain forest domain, 200-km north of Abidjan near the town of Divo, at the southern edge of the humid savanna belt bordering the forest. The savanna is characterized by annual burning during the dry season in February, and by its high efficiency of nitrogen utilization. Nitrogen is remobilized from senescing leaves, and is very rapidly assimilated from decomposing plant residues without entering the soil pool of mineral nitrogen. There is little potential for denitrification (as NO2, N2 or N2O) due to the low level of soil mineral/organic N (Abbadie et al., 1992).
Productivity of the Lamto Loudetia simplex grass savanna is provided in two data files (.txt format); one year-long record for the grassland that was burned in January of 1965 and the other for the grassland that was burned annually 1969-1987. A discontinuous series of carbon/nitrogen ratio calculations is also provided for 1969-1987. A third file contains monthly and annual climate data recorded at a weather station located at the grassland for the period 1969-1990.
Total NPP of the Loudetia simplex grass savanna was estimated at 2,150 g/m2/yr, of which 1,320 g/m2/yr (61%) was below-ground production. Normally 50-90% of above-ground grass biomass is burned annually; i.e., more than half of above-ground grass production. NPP values for this site are also reported in other published accounts. Differences are due to different measurement and calculation methods (Table 1).
Table 1. ANPP, BNPP, and TNPP values for Lamto savanna reported by various published data sources.
| Source | Units | ANPP | BNPP | TNPP |
|---|---|---|---|---|
| Menaut and Cesar (1979)1 | g/m2/yr | 830 | 1,320 | 2,150 |
| Scurlock and Olson (2013)1 | ||||
| Esser (2013)1 | ||||
| GPPDI Class A Site #42 (MI 43) in Olson et al. (2013a) | gC/m2/yr | 192 | 58 | 250 |
| EMDI Class A site #42 in Olson et al. (2013b) |
Notes: MI = Measurement identification number. 1NPP values for Loudetia simplex grass savanna. Menaut and Cesar (1979) and Esser (2013) also report NPP values for 6 other types of savanna at Lamto.
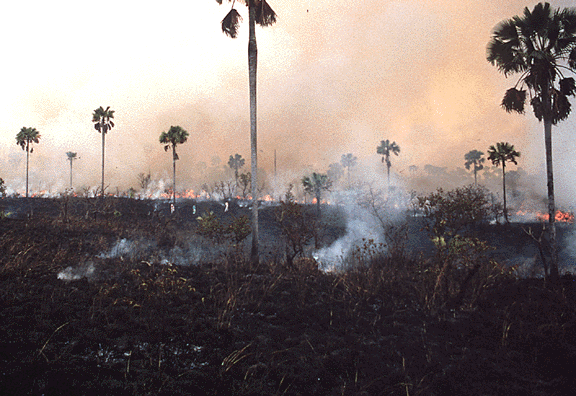
Figure 2. Bush fires in the middle of the dry season at the Lamto grassland site, Cote d'Ivoire. (Note the almost total combustion of grass biomass in the foreground. This results in the release of a large amount of smoke to the atmosphere; the sky tends to remain a dirty yellow color until the arrival of the first rains. Photograph taken January 1989 by Dr. P. Mordelet, CESBIO, France).
2. Data Description:
Spatial Coverage
Site: Lamto, Ivory Coast (Cote d'Ivoire)
Site Boundaries:(All latitude and longitude given in decimal degrees)
| Site (Region) | Westernmost Longitude | Easternmost Longitude | Northernmost Latitude | Southernmost Latitude | Elevation (m) |
|---|---|---|---|---|---|
| Lamto, Ivory Coast | -5.03 | -5.03 | 6.22 | 6.22 | 300 |
Spatial Resolution
Above-ground biomass sampling was carried out within 1-m square quadrats. Below-ground biomass was sampled from 20 x 20-cm soil cores.
Temporal Coverage
1965/01/15-1965/12/15 for savanna burned at the end of January 1965; 1969/04/15-1987/03/15 (discontinuous) for savanna burned in February of each year. Climate data are available from 1969/01/01-1990/12/31.
Temporal Resolution
Monthly
Data File Information
Table 2. Data file descriptions
| FILE NAME | TEMPORAL COVERAGE | FILE CONTENTS |
|---|---|---|
| lmt_npp.txt | 1969/04/15-1987/03/15 | Monthly biomass and carbon/nitrogen data for the Loudetia simplex grassland at Lamto, Ivory Coast (burned February each year) |
| lmt2_npp.txt | 1965/01/15-1965/12/15 | Monthly biomass data for the Loudetia simplex grassland at Lamto, Ivory Coast (burned end of January one year) |
| lmt_cli.txt | 1969/01/01-1990/12/31 | Climate data from a weather station at the Lamto grassland site |
NPP Data. The results of this study are provided in two text files (.txt format), one file for each treatment (Table 2). The variable values are delimited by semicolons. The first 18 lines are metadata; data records begin on line 19. Missing data are denoted by the value -999.9. Biomass units in <lmt_npp.txt> are expressed in g/m2 (dry matter weight). Biomass units in <lmt2_npp.txt> are expressed in g/m2 (fresh weight). Carbon/nitrogen ratio data are dimensionless.
Table 3. Column headings in file for savanna burned at the end of January 1965
| COLUMN HEADING | DEFINITION | UNITS |
|---|---|---|
| Site | Site where data were gathered (code refers to site identification) | text |
| Treatmt | Long term management of site (code refers to treatment described in metadata in data file) | |
| Year | Year in which data were collected | yyyy |
| Mn | Month in which data were collected | mm |
| Dy | Day on which data were collected | dd |
| Tyear | Date in decimal year (year plus the Julian date divided by 365) | numeric |
| AGbiomass | Above-ground biomass. | g/m2 (Fresh Weight) |
| Stdead | Standing dead matter |
Sample NPP Data Record <lmt2_npp.txt>
| Site;Treatmt;Year;Mn;Dy;Tyear;AGbiomass;stdead [units g/m2 FRESH WEIGHT] lmt;lngt_3 ;1965;01;15;1965.041; 0.0;1000.0;fresh weight lmt;lngt_3 ;1965;02;15;1965.126; 400.0; 0.0;fresh weight lmt;lngt_3 ;1965;03;15;1965.203; 700.0; 100.0;fresh weight lmt;lngt_3 ;1965;04;15;1965.288; 900.0; 100.0;fresh weight lmt;lngt_3 ;1965;05;15;1965.370;1000.0; 100.0;fresh weight ... |
Table 4. Column headings in file for savanna burned annually at the end of February <lmt_npp.txt>
| COLUMN HEADING | DEFINITION | UNITS |
|---|---|---|
| Site | Site where data were gathered (code refers to site identification) | text |
| Treatmt | Long term management of site (code refers to treatment described in metadata in data file) | |
| Year | Year in which data were collected | yyyy |
| Mn | Month in which data were collected | mm |
| Dy | Day on which data were collected | dd |
| Tyear | Date in decimal year (year plus the Julian date divided by 365) | numeric |
| AGbiomass | Above-ground biomass. | g/m2 Dry Weight |
| Stdead | Standing dead matter | |
| litter | Dead biomass found above ground | |
| AGtotmatter | Total above-ground biomass (live + dead + litter) | |
| BGtotmatter | Total below-ground biomass | |
| CN_AGB | Carbon/nitrogen ratio of above-ground biomass | dimensionless |
| CN_STD | Carbon/nitrogen ratio of standing dead matter | |
| CN_BGT | Carbon/nitrogen ratio of below-ground total matter |
Sample NPP Data Record <lmt_npp.txt>
| Site;Treatmt;Year;Mn;Dy;Tyear;AGbiomass;Stdead;litter;AGtotmatter;BGtotmatter;CN_AGB;CN_STD;CN_BGT lmt;lngt_2 ;1969;04;15;1969.288; 230.0; 0.0;-999.9; 230.0;1680.0;-999.9;-999.9;-999.9 lmt;lngt_2 ;1969;05;15;1969.370; 300.0; 0.0;-999.9; 300.0;1840.0;-999.9;-999.9;-999.9 ... lmt;lngt_2 ;1981;03;15;1981.203; 40.0; 0.0; 0.0; 40.0;1260.0; 41.0;-999.9; 119.0 lmt;lngt_2 ;1981;04;15;1981.288; 80.0; 0.0; 0.0; 80.0; 720.0;-999.9;-999.9; 98.0 lmt;lngt_2 ;1981;05;15;1981.370; 130.0; 20.0; 9.0; 150.0; 960.0; 49.0; 78.0; 108.0 lmt;lngt_2 ;1981;06;15;1981.455; 190.0; 50.0; 17.0; 240.0;1080.0;-999.9;-999.9; 104.0 lmt;lngt_2 ;1981;07;15;1981.537; 340.0; 90.0; 15.0; 430.0;1350.0; 85.0; 119.0; 93.0 ... |
Climate Data. Climate data are provided in one text file (.txt format). The first 18 lines are metadata; data records begin on line 19. The variable values are delimited by semicolons. There are no missing values.
Sample Climate Data Record
| Site;Temp;Parm; Jan; Feb; Mar; Apr; May; Jun; Jul; Aug; Sep; Oct; Nov; Dec; Year lmt;mean;prec; 17.5; 56.4;104.3;153.9;159.8;195.0; 97.7; 70.6;102.7;109.0; 69.9; 28.1;1164.9 lmt;mean;tmax; 34.6; 35.8; 35.5; 35.1; 33.9; 32.0; 30.8; 31.2; 31.8; 32.9; 32.9; 33.0; 36.3 lmt;mean;tmin; 21.5; 23.1; 23.4; 23.5; 23.1; 22.6; 22.0; 22.0; 22.4; 22.5; 22.3; 21.6; 20.9 lmt;numb;prec; 22.0; 22.0; 22.0; 22.0; 22.0; 22.0; 22.0; 22.0; 22.0; 22.0; 22.0; 22.0; 22.0 lmt;numb;tmax; 22.0; 22.0; 22.0; 22.0; 22.0; 22.0; 22.0; 22.0; 22.0; 22.0; 22.0; 22.0; 22.0 lmt;numb;tmin; 22.0; 22.0; 22.0; 22.0; 22.0; 22.0; 22.0; 22.0; 22.0; 22.0; 22.0; 22.0; 22.0 lmt;stdv;prec; 27.8; 42.0; 46.3; 57.9; 67.4; 93.8; 69.0; 64.3; 70.1; 51.4; 50.9; 29.8; 193.7 lmt;stdv;tmax; 0.6; 1.8; 0.9; 0.9; 1.0; 0.8; 0.8; 1.9; 0.6; 0.7; 2.1; 0.6; 1.1 lmt;stdv;tmin; 1.1; 0.5; 0.6; 0.5; 0.4; 0.4; 0.5; 0.7; 0.3; 0.3; 0.4; 0.8; 0.7 lmt;1969;prec; 0.0; 41.0;139.0;130.0; 73.0;121.0; 35.0; 77.0; 54.0;141.0;116.0; 14.0; 941.0 lmt;1969;tmax; 33.6; 35.4; 35.2; 34.0; 34.6; 31.6; 30.0; 29.7; 31.3; 32.2; 32.4; 32.9; 35.4 lmt;1969;tmin; 21.5; 22.8; 23.1; 23.3; 23.0; 22.8; 22.0; 22.0; 22.4; 22.6; 22.1; 22.6; 21.5 ... Where, Temp (temporal) - specific year or long-term statistic: mean = mean based on all years numb = number of years stdv = standard deviation based on all years Parm (parameter): prec = precipitation for month or year (mm) tmax = mean maximum temperature for month or year (C) tmin = mean minimum temperature for month or year (C) |
3. Data Application and Derivation:
Data on net primary production of particular ecosystem types worldwide is in demand from modelers working at a variety of scales from Global Climate Models (GCMs) to regional or national estimates of carbon fluxes between atmosphere, biosphere and soils. In view of the importance of tropical grass-containing ecosystems (grasslands and savannas), as perhaps the largest terrestrial biome (Hall and Scurlock, 1991), it was an important objective of the SCOPE Project to adapt biogeochemical models, like CENTURY, for modeling of grassland productivity and soil organic matter worldwide. Observed field data from Lamto, and from 10 other globally-distributed grassland sites, were used to test the grassland version of CENTURY (Parton et al., 1993).
Prior to this study, little field research had been conducted the productivity of humid savannas similar to Lamto. Although discontinuous, the detailed monthly above- and below-ground biomass data obtained for the Lamto grass savanna are particularly suitable for validation of models running on a monthly time step.
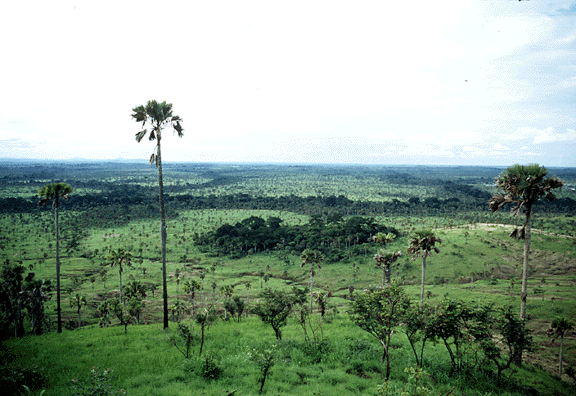
Figure 3. General view about 20-km from the Lamto grassland site, Cote d'Ivoire. (Typical physiognomy of a humid (guinean) savanna, with a continuous layer of tufted grasses, scattered shrubs and the palm Borassus aethiopium. The gallery forest along the temporary rivers makes up a conspicuous network isolating the savanna areas. Photograph taken July 1989 by Dr. P. Mordelet, CESBIO, France).
4. Quality Assessment:
NPP of grasslands is subject to a number of different methods of estimation from biomass data, some of which may be inappropriate for particular biome types. Methodology of estimation/calculation needs to be taken into account, as well as methodology of measurement, when making comparisons between different regions. Errors in biomass measurement may also occur between different study sites. For short time series of data it may be assumed that measurement methodology remains consistent; however, over very long time series changes in staff, tools, etc. may lead to "calibration" errors.
Components of NPP were difficult to estimate with accuracy in the Lamto savanna. Even though special attention was paid to the decay of living and dead matter of above- and below-ground parts and calculations took into account herbivory and translocation between above- and below-ground organs, the data presented in this data set and in Menaut and Cesar (1979) and Esser (2013) give only an imperfect estimate of production.
Few productivity studies have been conducted in savannas similar to Lamto. The lack of details on the functioning of these ecosystems makes it difficult to compare the results presented here (Menaut 1979). However, the Trachypogon llanos in Venezuela have an above ground productivity (9.1 Mg- ha- 1. yr 1) close to that of the Loudetia simplex grass savannas (San Jose and Medina, 1977; San Jose and Montes, 2013). In West Africa, the quantitative data given by Egunjobi (1974) for Guinea savannas in Nigeria are very similar to those of Lamto and the thorough research of Hopkins (1968, 1970) has shown that the derived savannas of Nigeria have structure and function very close to that of Lamto.
5. Data Acquisition Materials and Methods:
Site Information
The landscape at Lamto is a forest-savanna mosaic. Savannas are intersected by fringing forests along the intermittent rivers and by remnants of the semi deciduous forest situated on the richest plateau soils. Seven grassland facies are recognized within a mosaic of grass, shrub, and tree savannas distributed according to drainage, slope, and micro-topology (Menaut and Cesar, 1979; Abbadie et al., 1992). Loudetia spp. predominate in the grass savannas, while Andropogoneae (Hyperrhenia spp.) provide the main grasses in the shrub and tree savannas. Grasses make up the majority of NPP, even in the tree savanna, where tree root turnover seems to contribute little to NPP.
This data set concerns productivity of the Loudetia simplex grassland (Figure 3). Productivity of the other six savanna facies is provided in Menaut and Cesar (1979) and Esser (2013).
The pseudogley soils of the lower part of the cantena slope are covered by the Loudetia simplex grass savanna. Trees and shrubs are rare, occur mostly on termite mounds, and with the exception of the palms, rarely grow above the grass layer. The most humid facies appear at the bottom of the slope which bears either a fringing forest or a swamp with sedges.
The annual cycle of the vegetation is controlled by the dry season which occurs from December to January: the vegetation withers, annuals die, and leaf fall occurs. Fires occur at the height of the dry season (end of January) and only make this rhythm more extreme than in unburned areas where leaf fall spreads over several weeks. A rapid regrowth and a first wave of flowering of the herbaceous species occurs even before the onset of the rains. Vegetative growth continues during the main wet season (March-July). A drier period occurs in August but the vegetation generally does not seem to suffer from it. A second wave of flowering occurs during the little wet season (October-November); growth then stops and withering starts.
Table 5. Site characterisics
| Description | Values |
|---|---|
| mean annual precipitation | 1,164.9 mm |
| mean monthly minimum temperature | 21.5 degrees C (Jan) |
| mean monthly maximum temperature | 35.8 degrees C (Feb) |
| vegetation type | humid savanna |
| dominant species | Loudetia simplex (C4) |
| historical long-term management regime | annual burning in February |
| max above-ground live biomass (typical month) | 450 g/m2 (Nov) |
| soil type | ferruginous hydromorphic pseudogley |
| soil pH | 6.0 |
| soil texture (sand/ silt/ clay) | 0.85 / 0.10 / 0.05 |
| soil carbon content | 1,800 g/m2 (0-20 cm) |
| soil nitrogen content | 150 ? g/m2 (0-20 cm) |
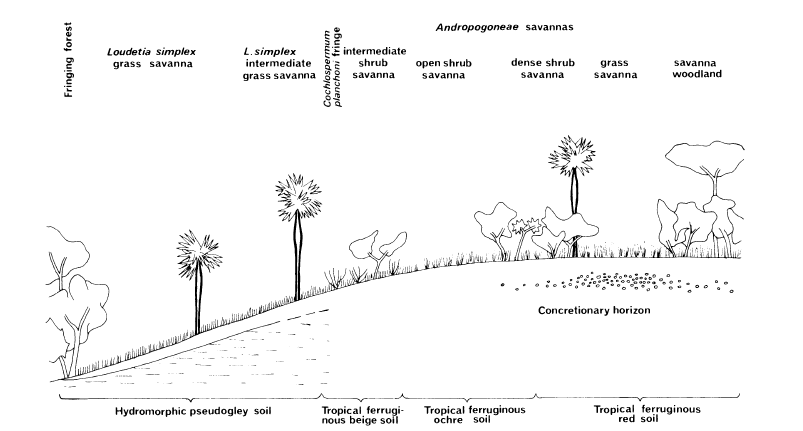
Figure 4. Distribution of the main savanna facies on a schematic catena at Lamto. In the field, the facies always occur in the present
order but one or more may be absent on a catena. Source: Menaut and Cesar (1979).
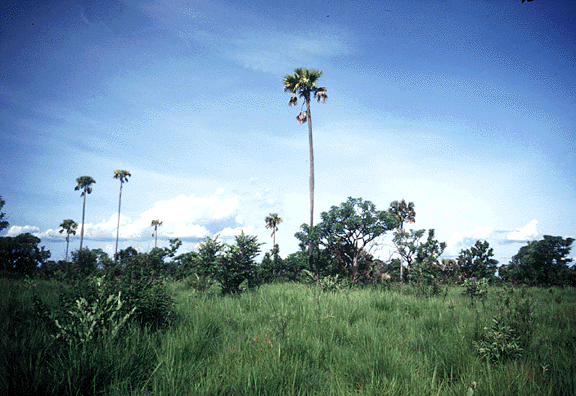
Figure 5. Regrowth of the savanna during the rainy season at the Lamto grassland site, Cote d'Ivoire. (Note the three components: a continuous herbaceous layer, mostly tufted grasses; a tree/shrub layer, mostly gathered into clumps; and the palm tree overstory. Photograph taken between March and June 1989 by Dr. P. Mordelet, CESBIO, France).
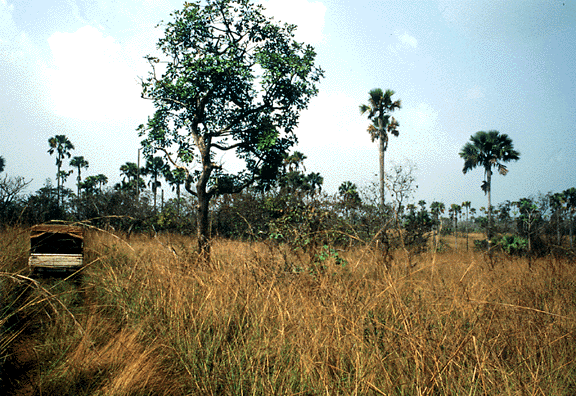
Figure 6. Beginning of the dry season at the Lamto grassland site, Cote d'Ivoire. (The grass layer has reached its maximum height. Photograph taken November 1988? by Dr. P. Mordelet, CESBIO, France).
Methods
Changes in above- and below-ground live and dead biomass were measured at monthly intervals (Menaut and Cesar, 1979).
Dry weight of each above ground category was determined each month by clipping to ground level within 16 quadrats of 1.0-m2, selected randomly from a total of 192 potential quadrat locations. Clipped material was immediately sorted into live and standing dead, and litter (fallen dead matter) was harvested from the ground. Samples were weighed fresh before drying.
Below-ground plant matter was sampled by extracting blocks of soil, 20-cm x 20-cm, in successive 10-cm layers to a depth of 1.0 m. The soil was considered too gravely and too hard in the dry season to permit use of soil augers or corers (gouges). Only four soil blocks were sampled per month. Eighty percent of root biomass was found in the top 30 cm. Soil cores were washed over a 2-mm sieve, and live and dead roots were separated from only one soil block per month.
All sorted plant matter was weighed fresh before oven drying to constant weight at 95 degrees C.
Decomposition above-ground was accounted for by estimating a mean monthly disappearance rate for leaf litter (7.6% for Loudetia savanna) according to the methods of Wiegert and Evans (1964) and Lomnicki et al. (1968).
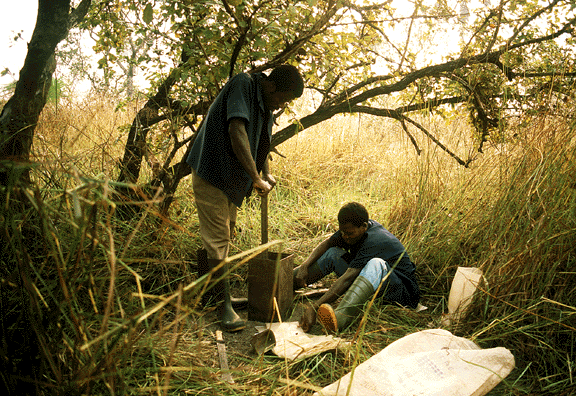
Figure 7. Field measurements at the beginning of the dry season at the Lamto grassland site, Cote d'Ivoire. (Photograph taken 1989 by Dr. P. Mordelet, CESBIO, France).
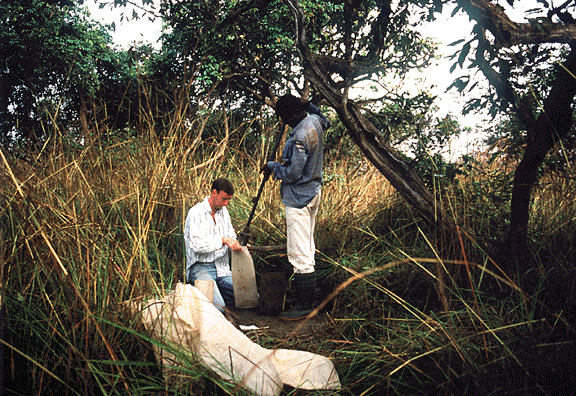
Figure 8. Above-ground biomass sampling was carried out within one-metre square quadrats. Below-ground biomass was sampled from 20 x 20-cm soil cores. (Photograph taken 1989 by Dr. P. Mordelet, CESBIO, France).
6. Data Access:
This data set is available through the Oak Ridge National Laboratory (ORNL) Distributed Active Archive Center (DAAC).
Data Archive:
Web Site: http://daac.ornl.gov
Contact for Data Center Access Information:
E-mail: uso@daac.ornl.gov
Telephone: +1 (865) 241-3952
7. References:
Abbadie, L., A. Mariotti, and J.-C. Menaut. 1992. Independence of savanna grasses from soil organic matter for their nitrogen supply. Ecology 73: 608-613. doi:10.2307/1940766
Egunjobi, J.K. 1974. Dry matter, nitrogen, and mineral element distribution in an unburnt savanna during the year. Oecologia Plantarum 9: 1-10.
Esser, G. 2013. NPP Multi-Biome: Global Osnabruck Data, 1937-1981, R1. Data set. Available on-line [http://daac.ornl.gov] from Oak Ridge National Laboratory Distributed Active Archive Center, Oak Ridge, Tennessee, USA. doi:10.3334/ORNLDAAC/214
Hopkins, B. 1968. Vegetation of the Olokemeji Forest Reserve, Nigeria. V. The vegetation on the savanna site with special reference to its seasonal changes. Journal of Ecology 56: 97-115. doi:10.2307/2258070
Hopkins, B. 1970. Vegetation of the Olokemeji Forest Reserve, Nigeria. VII. The plants on the savanna site with special reference to their seasonal growth. Journal of Ecology 58: 795-825.
Lomnicki, A., E. Bandola, and K. Jankovska. 1968. Modification of the Wiegert-Evans method for estimation of net primary production. Ecology 49: 147-149.
Long, S.P., E. Garcia Moya, S.K. Imbamba, A. Kamnalrut, M.T.F. Piedade, J.M.O. Scurlock, Y.K. Shen and D.O. Hall. 1989. Primary productivity of natural grass ecosystems of the tropics: a reappraisal. Plant and Soil 115: 155-166. doi:10.1046/j.1365-2486.2001.00448.x
Menaut, J-C., and J. Cesar. 1979. Structure and primary productivity of Lamto savannas, Ivory Coast. Ecology 60: 1197-1210. doi:10.2307/1936967
Olson, R.J., K.R. Johnson, D.L. Zheng, and J.M.O. Scurlock. 2001. Global and Regional Ecosystem Modeling: Databases of Model Drivers and Validation Measurements. ORNL Technical Memorandum TM-2001/196. Oak Ridge National Laboratory, Oak Ridge, Tennessee, U.S.A.
Olson, R.J., J.M.O. Scurlock, S.D. Prince, D.L. Zheng, and K.R. Johnson (eds.). 2013a. NPP Multi-Biome: Global Primary Production Data Initiative Products, R2. Data set. Available on-line [http://daac.ornl.gov] from the Oak Ridge National Laboratory Distributed Active Archive Center, Oak Ridge, Tennessee, U.S.A. doi:10.3334/ORNLDAAC/617
Olson, R.J., J.M.O. Scurlock, S.D. Prince, D.L. Zheng, and K.R. Johnson (eds.). 2013b. NPP Multi-Biome: NPP and Driver Data for Ecosystem Model-Data Intercomparison, R2. Data set. Available on-line [http://daac.ornl.gov] from the Oak Ridge National Laboratory Distributed Active Archive Center, Oak Ridge, Tennessee, U.S.A. doi:10.3334/ORNLDAAC/615
Parton, W.J., J.M.O. Scurlock, D.S. Ojima, T.G. Gilmanov, R.J. Scholes, D.S. Schimel, T. Kirchner, J-C. Menaut, T. Seastedt, E. Garcia Moya, Apinan Kamnalrut, and J.I. Kinyamario. 1993. Observations and modeling of biomass and soil organic matter dynamics for the grassland biome worldwide. Global Biogeochemical Cycles 7: 785-809. doi:10.1029/93GB02042
San Jose, J.J., and E. Medina. 1977. Produccion de materia organica en la sabana de Trachvpogon, Calabozo, Venezuela. Boletin de la Sociedad Venezolana de Ciencias Naturales 33: 75-100.
San Jose, J., and R.A. Montes. 2013. NPP Grassland: Calabozo, Venezuela, 1969-1987, R1. Data set. Available on-line [http://www.daac.ornl.gov] from Oak Ridge National Laboratory Distributed Active Archive Center, Oak Ridge, Tennessee, U.S.A. doi:10.3334/ORNLDAAC/206
Scurlock, J.M.O., and R.J. Olson. 2013. NPP Multi-Biome: Grassland, Boreal Forest, and Tropical Forest Sites, 1939-1996, R1. Data set. Available on-line [http://daac.ornl.gov] from Oak Ridge National Laboratory Distributed Active Archive Center, Oak Ridge, Tennessee, U.S.A. doi:10.3334/ORNLDAAC/653
Wiegert, R.G,. and F.C. Evans. 1964. Primary production and the disappearance of dead vegetation on an old field in south-eastern Michigan. Ecology 45: 49-63. doi:10.2307/1937106