Get Data
Summary:
This data set contains two ASCII text files; one providing above-ground biomass, productivity, and bioelement concentration data for a derived savanna at Cañas (10.4 N 85.1 W Elevation 45 m) in northwestern Costa Rica, and the other providing climate data from the La Pacifica weather station near Cañas and rom other sources. Monthly dynamics of above-ground plant matter were monitored from July 1969 to June 1970 using harvest procedures within an exclosure to restrict grazing. The climate data are available from three time periods: 1951-1960, 1963, and 1969-1970. The climate is characterized by a dry season from late November to April, with little seasonal differences in temperature.
The Cañas study site is dominated almost exclusively by Hyparrhenia rufa, a perennial grass of African origin introduced extensively throughout the tropics. The original vegetation cover was closed semideciduous forest. The study area was deforested and converted to a grass savanna around January 1947, 22.5 years before the start of the present study. Light grazing by cattle and horses is accompanied by burning of the Cañas savanna annually between December and April.
Above-ground net primary productivity (ANPP) was estimated by two methods: maximum standing crop of herbaceous shoot tissue (peak live + dead matter) (968 g/m2/year); and the sum of monthly estimates of shoot production (including estimated mortality) (1,387 g/m2/year). End-of-season (November, 1969) live root biomass estimates of 1,220 g/m2 at 0-20 cm depth and 2,254 g/m2 at 0-100 cm depth are available in the literature.
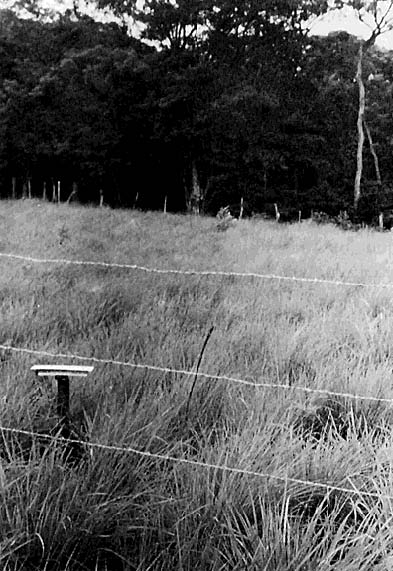
Figure 1. Appearance of Hyparrhenia rufa within the exclosure at the Cañas grassland site, Costa Rica, in July 1969 when harvests began. Harvesting was restricted to the area in the immediate foreground. The instrument shelter was 53 cm high. (Photograph taken by Dr. R. Daubenmire, Washington State University, USA. Reproduced by kind permission of Mrs. Jean Daubenmire and Botanical Gazette - University of Chicago Press).
Revision Notes: Only the documentation for this data set has been revised. The data were checked for accuracy and are identical to those originally published in 1997.
Additional Documentation
The Net Primary Productivity (NPP) data collection contains field measurements of biomass, estimated NPP, and climate data for terrestrial grassland, tropical forest, temperate forest, boreal forest, and tundra sites worldwide. Data were compiled from the published literature for intensively studied and well-documented individual field sites and from a number of previously compiled multi-site, multi-biome data sets of georeferenced NPP estimates. The principal compilation effort (Olson et al., 2001) was sponsored by the NASA Terrestrial Ecology Program. For more information, please visit the NPP web site at http://daac.ornl.gov/NPP/npp_home.html.
Data Citation:
Cite this data set as follows:
Daubenmire, J. 2014. NPP Grassland: Cañas, Costa Rica, 1969-1970, R1. Data set. Available on-line [http://daac.ornl.gov] from Oak Ridge National Laboratory Distributed Active Archive Center, Oak Ridge, Tennessee, USA doi:10.3334/ORNLDAAC/191
This data set was originally published as:
Daubenmire, J. 1997. NPP Grassland: Cañas, Costa Rica, 1969-1970. Data set. Available on-line [http://daac.ornl.gov]
from Oak Ridge National Laboratory Distributed Active Archive Center, Oak Ridge, Tennessee, U.S.A.
Table of Contents:
- 1 Data Set Overview
- 2 Data Description
- 3 Applications and Derivation
- 4 Quality Assessment
- 5 Acquisition Materials and Methods
- 6 Data Access
- 7 References
1. Data Set Overview:
Project: Net Primary Productivity (NPP)
Productivity of a derived savanna was determined at the Cañas study site in north-western Costa Rica. Monthly dynamics of above-ground plant matter (live biomass, total live + dead standing crop, and estimated mortality) were monitored using harvest procedures from July 1969 to June 1970. A single end-of-season sample of live root biomass was extracted in November 1969.
The Cañas study site (10.4 N, -85.1 W, Elevation 45 m) is situated 8 km northwest of the town of Cañas in Guanacaste Province. The study site, an exclosure to restrict grazing, contained 65 quadrats, each 0.5-m x 2.0-m, within a relatively uniform area of a savanna dominated almost exclusively by Hyparrhenia rufa, a perennial grass of African origin introduced extensively throughout the tropics. The original vegetation cover was a closed semideciduous forest. The study area was deforested and converted to a grass savanna around January 1947, 22.5 years before the start of the present study. Light grazing by cattle and horses is accompanied by burning of the Cañas savanna between December and April each year. Evidence of grazing by insects and non-domestic vertebrates was rare.
A volcanic explosion one year before the present study deposited a light layer of ash over the study site and may have contributed to available P and K. Limited experiments with N fertilization resulted in little change in N content of above-ground biomass, although production was increased. A sample from an unburned stand contained twice as much N at the end of the growing season, suggesting that burning significantly depletes N in the ecosystem.
Above-ground net primary productivity (ANPP) was estimated by two methods: maximum standing crop of herbaceous shoot tissue (peak live + dead matter) (968 g/m2); and the sum of monthly estimates of shoot production (including estimated mortality) (1,387 g/m2) (Esser, 2013; Scurlock and Olson, 2002). The November 1969 below-ground biomass estimates are 1,220 g/m2 at 0-20 cm depth and 2,254 g/m2 at 0-100 cm depth. Productivity values are also reported in Olson et al. (2013a; b), but do not agree with the values given here because different calculation methods, rounding rules, and conversion factors were used.
Climate data for the study site are available from the La Pacifica weather station operated by the Servicio Meteorologico Nacional, 1.8-km from the study site and from other sources. The region is characterized by a dry season from late November to April, with little seasonal differences in temperature. Median rainfall was 1,538.8 mm per year over the 1951-1960 period. Mean maximum temperature was 32.4 degrees C and mean minimum temperature was 23.1 degrees C in 1963.
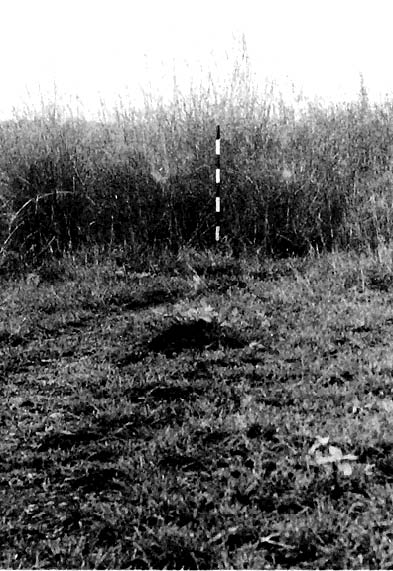
Figure 2. Mature Hyparrhenia rufa just outside the exclosure at the Cañas grassland site, Costa Rica, illustrating the alternation of heavily grazed and ungrazed patches in the savanna, all of which was freely available to livestock. The stake is 1.0 m tall. (Photograph taken by Dr. R. Daubenmire, Washington State University, USA. Reproduced by kind permission of Mrs. Jean Daubenmire and Botanical Gazette - University of Chicago Press).
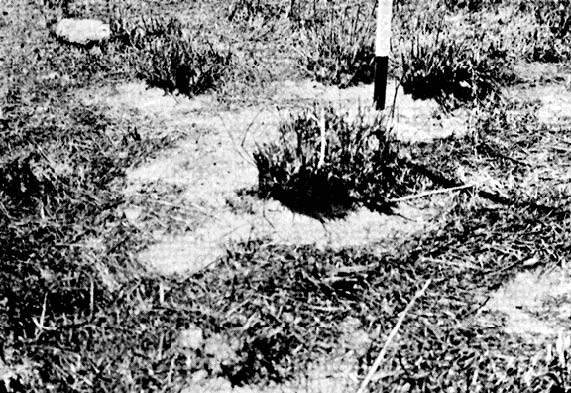
Figure 3. Pedestalled plants of Hyparrhenia rufa shortly after the savanna fire of 17th April 1970, at the Cañas grassland site, Costa Rica. The rod is marked in 10-cm units, and the larger pedestals are approximately 11 cm high. A considerable amount of litter was not consumed by the fire, and its redistribution by the wind is evident. (Photograph taken by Dr. R. Daubenmire, Washington State University, USA. Reproduced by kind permission of Mrs. Jean Daubenmire and Tropical Ecology - International Society for Tropical Ecology, Varanasi, India).
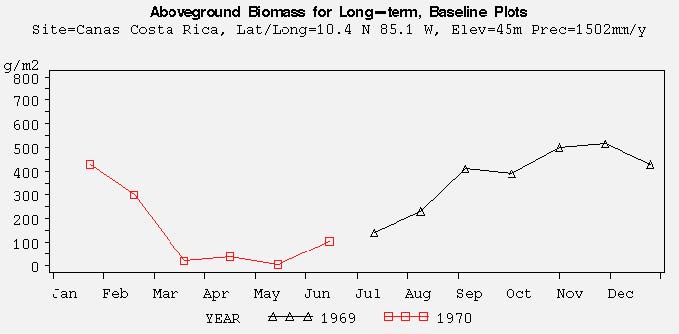
Figure 4. Above-ground biomass dynamics for the Cañas grassland site, Costa Rica.
2. Data Description:
Spatial Coverage
Site: Cañas, Costa Rica
Site Boundaries: (All latitude and longitude given in decimal degrees)
| Site (Region) | Westernmost Longitude | Easternmost Longitude | Northernmost Latitude | Southernmost Latitude | Elevation (m) |
|---|---|---|---|---|---|
| Cañas, Costa Rica | -85.1 | -85.1 | 10.4 | 10.4 | 45 |
Table 1. File names and descriptions
| FILE NAME | TEMPORAL COVERAGE | FILE CONTENTS |
|---|---|---|
| cns_npp.txt | 1969/07/10 - 1970/06/14 | Living and dead above-ground biomass, ANPP, and plant nutrient content data for the derived Cañas grassland in Costa Rica |
| cns_cli.txt | 1951-1960, 1963, and 1969-1970 | Climate data from three sources. See text for details |
NPP Data. Living and dead above-ground biomass, ANPP estimates, and plant nutrient data for the Cañas site are provided in one ASCII file (.txt format). The first 18 lines are metadata; data records begin on line 19. The variable values are tab-delimited. Biomass and ANPP units are in g/m2 (dry matter weight); nutrients values are percentage (%) of oven-dry weight. The values -9.99, -9.999, and -999.9 are used to denote missing values.
Table 2. Column headings in NPP file
| COLUMN HEADINGS | DEFINITION | UNITS |
|---|---|---|
| Site | Site where data were gathered (code refers to site identification) | Text |
| Treatmt | Long term management of site (code refers to treatment described in metadata in data file) | Text |
| Year | Year in which data were collected | Numeric |
| Mn | Month in which data were collected | |
| Dy | Day on which data were collected | |
| Tyear | Date in decimal year (year plus the Julian date divided by 365) | |
| AGbiomass | Above-ground living biomass (standing green tissue) | g/m2 |
| AGtotclp | Above-ground total biomass (living plus newly dead material) | |
| newdead | Above-ground newly dead tissue biomass (dead leaf tips dropped to the ground in the past 4 weeks) | |
| ANPP | Above-ground total shoot production (shoot biomass produced in the past 4 weeks) | |
| ash | Ash content of whole Hyparrhenia tillers | % |
| protein | Crude content of whole Hyparrhenia tillers | |
| fibre | Fiber content (mainly indigestible lignin plus cellulose) of whole Hyparrhenia tillers | |
| N-AGbio | Nitrogen content of whole Hyparrhenia tillers from unfertilized areas in the exclosure | |
| P-AGbio | Phosphorus content of whole Hyparrhenia tillers |
Notes: The savanna was burned on April 17, 1970. The total shoot production estimate for June 14, 1970 was made by interpolation. All data are from Daubenmire (1972a; b).
Sample NPP Data Record
|
Site;Treatmt;Year;Mn;Dy;Tyear;AGbiomass;AGtotclp;newdead;ANPP
;ash;protein;fibre;N-AGbio;P-AGbio cns;none ;1969;07;10;1969.523; 140.9;-999.9;-999.9; 134.3; 20.40; 3.86; 36.10; 0.640; 0.063 cns;none ;1969;08;08;1969.603; 230.5; 384.3; 44.7; 306.4; 20.10; 3.00; 32.10; 0.550; 0.080 cns;none ;1969;09;04;1969.677; 410.7; 571.4; 126.2; 82.5; 17.30; 3.00; 37.50; 0.860; 0.045 ... |
Climate Data. Climate data for Cañas from three sources are provided in one ASCII file (.txt format). The variable values are delimited by semicolons. BE AWARE: THE PARAMETERS AND ORGANIZATION OF THE THREE SETS OF DATA IN THIS DATA FILE DIFFER FROM OTHER NPP CLIMATE DATA FORMAT.
The climate data sources were: data from the La Pacifica weather station provided by the Servicio Meteorologico Nacional, Costa Rica; data read from published tables (Daubenmire, 1972a; 1972b); and data transcribed from published graphs (Daubenmire,1972a; 1972b).
Measurements from the La Pacifica weather station include monthly and annual precipitation and monthly average temperature for 1969 and 1970. Data extracted from published tables included monthly and annual median precipitation 1951-1960, monthly mean minimum and maximum temperatures 1951-1960, monthly and annual precipitation 1963, 1969-1970, and monthly minimum and maximum temperatures 1963, 1969-1970. Data transcribed from published graphs included monthly precipitation, minimum temperature and maximum temperatures, and average soil temperature for 1969 and 1970.
Sample Climate Data Record
| COLUMN HEADINGS | DEFINITION |
|---|---|
| Site | Unique 3-character code for each site based on the first three consonants in the site name (e.g., CNS for Canas) |
| Temp (Temporal) |
Indicates whether the values in that row are either long-term (i.e, mulit-year) or annual data for the specified parameter. For multi-year, the values are: mean=mean values (monthly and annual) calculated for the years of data as noted in the documentation numb=number of years of data included in a reported mean value stdv=standard deviation of a mean value Annual data: 19XX=monthly and annual parameter values for the specified year (e.g., 1972) |
| Parm | Parameter, indicates the meteorological data reported in that row. prec-total precipitation for the month or year tmax=maximum temperature for the month or year reported in degrees C tmin=minimum temperature for the month or year reported in degrees C |
|
Description of specific Temp and Parm data values: Long-term data: site;medi;prec; Multi-year median of total precipitation for each month [Jan, Feb, Mar, …, Dec] and median of total annual precipitation across all years [Year] (mm) site;mean;tmax; Multi-year mean of maximum temperature for each month [Jan, Feb, Mar, …, Dec] and mean of annual maximum temperature across all years [Year] (C) site;mean;tmin; Multi-year mean of minimum temperature for each month [Jan, Feb, Mar, …, Dec] and mean of annual minimum temperature across all years [Year] (C) … site; numb and stdv; repeat for prec, tmax, and tmin; Annual data: site;19XX;prec; Total precipitation for each month [Jan, Feb, Mar,.....Dec] and total precipitation for the year 19XX [Year] (mm) site;19XX;tmax; Maximum temperature for each month [Jan, Feb, Mar,.....Dec] and maximum for the year 19XX [Year] (C) site;19XX;tmin; Minimum temperature for each month [Jan, Feb, Mar,.....Dec] and minimum for the year 19XX [Year] (C) … site;19XX;(prec, tmax, and tmin); repeat for reported years. Annual data missing value note: If a monthly parm value is missing, the parm value for [Year] is also set to missing (-999.9). |
|
DATA READ FROM PUBLISHED TABLES Site;Temp;Parm; Jan; Feb; Mar; Apr; May; Jun; Jul; Aug; Sep; Oct; Nov; Dec; Year CNS;medi;prec; 0.0; 0.0; 0.0; 7.6;165.2;259.1;149.1;186.0;350.0;358.4; 63.4; 0.0;1538.8 CNS;aver;tmnA; 22.0; 20.5; 23.0; 20.5; 22.5; 21.0; 21.5; 20.5; 20.5; 20.0; 20.0; 20.0; -99.9 CNS;aver;tmxA; 35.0; 35.5; 35.5; 35.0; 35.5; 36.0; 34.5; 35.0; 36.5; 34.5; 33.0; 34.0; -99.9 CNS;1963;prec;-99.9;-99.9;-99.9;-99.9;-99.9;-99.9;-99.9;-99.9;-99.9;-99.9;-99.9;-99.9; -99.9 CNS;1963;tmax; 31.5; 32.6; 33.3; 32.7; 34.1; 32.5; 32.5; 33.5; 33.8; 32.3; 30.0; 30.4; 34.1 CNS;1963;tmin; 23.2; 22.5; 24.6; 23.6; 24.4; 23.3; 22.8; 23.3; 22.1; 21.8; 22.5; 23.5; 21.8 … Where, Temp (temporal) - specific year or long-term statistic: medi; prec = median precipitation 1951-1960 (mm) aver; tmnA = average ABSOLUTE minimum temperature for month 1951-1960 (C) aver; tmxA = average ABSOLUTE maximum temperature for month 1951-1960 (C) Parm (parameter): prec = precipitation for month or year (mm) tmax = mean maximum temperature for month or year (C) tmin = mean minimum temperature for month or year (C) |
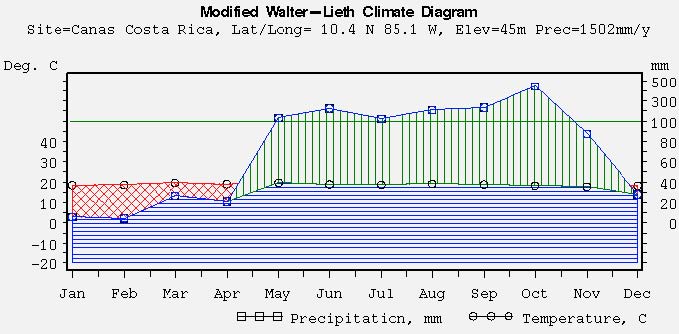
Figure 5. Modified Walter-Lieth climate diagram based upon mean monthly temperature and precipitation data for the Cañas grassland site, Costa Rica. (crisscross red shading, where present - period of relative drought; vertical green shading - period of relative humid season) .
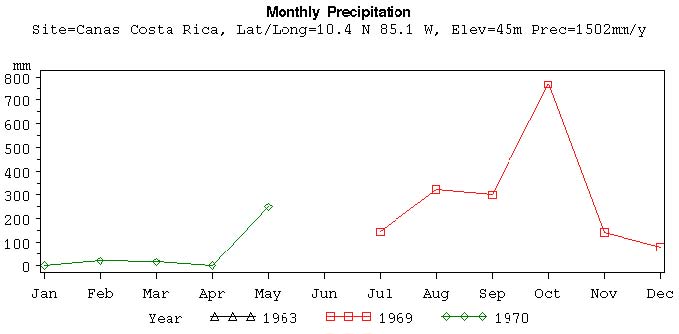
Figure 6. Monthly precipitation for the Cañas grassland site, Costa Rica.
3. Data Application and Derivation:
This study was conducted to follow the phenology and other features of Hyparrhenia rufa through a year and to determine NPP in relation to climate. The results account for above-ground NPP, estimated by two methods: maximum standing crop (peak live + dead matter) which builds up between annual fires; and the sum of monthly estimates of shoot production (including estimated mortality) during the study period.
The monthly grassland biomass dynamics data for the Cañas study site are provided for comparison with models and estimation of NPP. Climate data are provided for use in driving ecosystem/NPP models.
4. Quality Assessment:
The relative validity of the results of this study can best be judged by comparing them with other production estimates for tropical and subtropical grasslands. Data for the Cañas savanna showed very good agreement when the very high rainfall there is taken into account. The sum of the monthly values was more nearly correct, especially considering that 80 g of tissue was produced following attainment of maximum standing crop (Daubenmire, 1972b).
Sources of Error
The sampling plots exhibited considerable differences in phytomass, despite the physiognomic uniformity of the stand as a whole. As a result, the biomass samples yielded considerable variation in dry weight among the replicates harvested each month whereby an estimate of sampling error would not be meaningful.
A possible source of error stems from how Hyparrhenia net shoot production was calculated. The sampling error of one set of plots used to estimate the amount of green tissue at the start of a month may add to or offset the sampling error involved in the harvest of another set of plots at the end of the month, for both values must be used in the calculation. The estimates of annual shoot production based on summing monthly values can be accepted only if it is assumed that monthly errors are randomly scattered about their parameters, and so tend to cancel each other in the final summation. Judging from the relation of the Cañas data to other production estimates in grasslands elsewhere, this assumption appears reasonable.
NPP estimated from maximum standing crop of tissue (living plus dead) ignores production that may continue beyond the date of the maximum standing crop, as occurs at Cañas, and involves an assumption that the decay of litter that has accumulated since the last fire has been negligible. Both errors lead to an underestimation of production, and the latter is especially serious at Cañas where the first litter to fall may lie on the ground for seven months. The alternative method (i.e., independently estimating monthly production, then summing these estimates to obtain the annual value) assumes that the removal of dead leaves and leaf tips from the shoots and litter from the soil four weeks before harvest had no influence on the metabolism of the remaining green tissue.
5. Data Acquisition Materials and Methods:
Site Information
The Cañas study site is situated 8 km northwest of the town of Cañas in Guanacaste Province in the seasonally dry northwestern part of Costa Rica, just beyond the western foothills of the mountainous backbone of the country. The study site is a derived Hyparrhenia savanna (modified Bailey ecoregion humid savanna, #413) at an elevation of 45 m. There is a distinct dry season from late November through April and little seasonal difference in temperature. During the dry season strong, gusty winds prevail. The mean annual precipitation was 1,926 mm for the 1951-1963 period (Daubenmire, 1972a; 1972b). [The climate data file provides an estimate of median annual precipitation amount (1,538.8 mm) for 1951-1960 and average annual minimum and maximum temperatures for 1969 (21.8 degrees C and 34.1 degrees C, respectively).]
The study area contained 65 quadrats (0.5-m x 2.0-m each), within a relatively uniform area of a stand dominated almost exclusively by Hyparrhenia rufa, a perennial grass of African origin introduced extensively throughout the tropics. This grass alone flourishes where savanna is burned annually. Under the most favorable conditions in the vicinity of Cañas, H. rufa has the capacity of reaching a height exceeding 4 m during each wet season. It is disease- and pest-free, highly productive, and very palatable to cattle. However, it has low nutritional value, with only 7.4% protein when young, declining to 1.4% as the tillers dry. The caryopses have no dormancy, and their viability remains unimpaired for at least 14 months, but they require light for good germination and are intolerant of heat from grass fires.
The original vegetation cover was a closed semideciduous forest. The study area was deforested and converted to a grass savanna around January 1947, 22.5 years before the start of the present study. Light grazing by cattle and horses is accompanied by annual burning of the savanna between December and April. The annual fires clear the soil of all litter between growing seasons. Grazing was restricted during this study. Evidence of grazing by insects and non-domestic vertebrates was rare. The Hyparrhenia stand contained a few woody invaders which are killed back to the ground annually by the fires, and very few forbs, the most common being the herbaceous liana Calopogonium mucunoides.
Soil type at the study site was silty clay loam (sand/silt/clay 0.00/0.00/0.00; pH 6.45). Depth to the subtending country rock, pumice, was about 1 m. Soil carbon content was 2.72% (0-20 cm) and nitrogen 0.085% (0-20 cm). A volcanic explosion one year before the present study deposited a light layer of ash over the study site.
Climate data are available from three sources: the La Pacifica weather station operated by the Servicio Meteorologico Nacional located 1.8-km from the study site; data read from published tables (Daubenmire, 1972a; 1972b); and data transcribed from published graphs (Daubenmire, 1972a; 1972b).
Spatial Resolution
Sixty-five (65) plots of 0.5 x 2.0-m in size were laid out in a grid pattern within an exclosure to restrict grazing. A 1-m walking path and buffer spacewas left between rows and between plots in each row. Four plots were harvested at 4-week intervals using a random system.
Temporal Coverage
Above-ground biomass measurements were made monthly from 1969/07/10 through 1970/06/14. A single harvest of below-ground biomass was made in 11/1969 (data not included in data file). Climate data are available from three time periods: 1951-1960, 1963, and 1969-1970.
Temporal Resolution
Above-ground biomass measurements were made by harvest methods at 4-week intervals. ANPP estimates are based on plant dry matter (living and dead) accumulation during the 4-week intervals, expressed as g/m2/year. Nutrient content measurements are percentages of oven-dry weight of whole plant tillers collected on each harvest date. Climate data are expressed monthly and annually.
Harvests were made of live tissue, dead matter, and litter at 4-week intervals from July 10, 1969 to June 14, 1970 in a savanna dominated almost exclusively by the perennial grass Hyparrhenia rufa. ANPP was estimated by two methods: from the maximum standing crop which builds up between annual fires, and by summing monthly estimates of production (including estimated mortality). A single end-of-season (November 1969) estimate of live root biomass was also calculated (not in data file, but shown in Table 3).
Above-ground Biomass. Within an exclosure to restrict grazing, 65 plots 0.5 x 2.0-m in size were laid out in a grid pattern, leaving 1-m walking and buffer space between rows and between plots in each row. Using a random system, four plots were harvested at 4-week intervals. All plants were clipped within 5 mm of the ground surface.
Four weeks before harvesting one set of replicates, the plots were cleaned of all litter, including attached dead leaves and leaf tips and post dissemination inflorescences, so that only green tissue remained. At the end of the 4-week period, all green tissue and newly dead tissue was harvested from the same series of plots, and immediately separated indoors for air drying. The material included the green tissue left in the plots 4 weeks earlier, plus its living and dead products. Thus the combined weight minus the initial green tissue equaled net shoot production. The initial green weight in the plots was assumed to be equal to that of four plots of another series that had been harvested in similar fashion at the start of the 4-week period. Thus, each month one series of plots was harvested to complete bareness, and the next month's series was cleaned of all accumulated dead tissue. After harvested material was air dried, subsamples were oven dried (100 degrees C for 24 hours) so that all data could be expressed on an oven-dry basis.
Dead tissue not of Hyparrhenia origin was so poorly represented that it was not segregated from grass litter when the plots were cleaned, and the rare root sprouts of woody plants were ignored.
Two methods of estimating net annual production of grassland herbage where used: (1) maximum standing crop of tissue (living plus dead); and (2) monthly production estimates summed to obtain the annual value.
Root Biomass (not included in data set but provided here for information purposes):
In November 1969, when the Hyparrhenia shoots had approximated their fullest development, five auger holes 82-mm in diameter were taken to the maximum possible depth of soil over pumice bedrock (approximately 1 m), and each 20-cm segment of a core was washed separately to extract the roots it contained. Before oven drying, the air-dried material was teased apart under a lens and sand-size particles of pumice removed by forceps.
Table 3. Vertical distribution of Hyparrhenia roots (Daubenmire, 1972a)
| Depth (cm) | g/m2 (sd) |
|---|---|
| 0-20 | 1,220 ± 273 |
| 20-40 | 322 ± 93 |
| 40-60 | 277 ± 188 |
| 60-80 | 258 ± 194 |
| 80-100 | 177 ± 50 |
Nutrient Analysis:
On each sampling date, ten or more of the tallest whole Hyparrhenia tillers, each from a different ungrazed plant in the exclosure area, were cut at the soil surface to comprise each sample. Dead lower leaves were discarded. Sampling began when new basal shoots were approximately 24 cm tall, and ended when the mature tillers had very little green tissue and dissemination had just finished, but new basal and auxiliary shoots were not yet evident. Nutrient content determinations were made following methods in Horowitz (1970).
Climate Data:
Climate data were available from three sources: the La Pacifica weather station operated by the Servicio Meteorologico Nacional located 1.8-km from the study site; data read from published tables (Daubenmire, 1972a; 1972b); and data transcribed from published graphs (Daubenmire, 1972a; 1972b). Measurements from the weather station included monthly and annual precipitation amounts, minimum temperature, and maximum temperature for 1969-1970. Data extracted from published tables included values based on long-term statistics (1951-1960), including median precipitation and average minimum and maximum temperatures, as well as monthly precipitation amounts, minimum temperature, and maximum temperature for 1963 and 1969-1970. Data transcribed from published graphs included monthly precipitation, minimum temperature for month, maximum temperature, and average soil temperature for month for 1969 and 1970.
The climate data accompanying this NPP data set was compiled from daily observations of Tmax, Tmin, and precip amount.
For a given month, the maximum value of the daily Tmax for that month and the minimum value of the Tmin for that month is provided. For the year, the maximum value of the monthly Tmax is the annual Tmax and for the year the minimum value of the monthly Tmin values is the annual Tmin. Daily precipitation amount is summed to yield a monthly precipitation amount and the monthly precipitation is summed to provide an annual precipitation amount.
The multi-year mean monthly Tmax is the average of the Tmax values for that month for each year of the record. For example the mean monthly Tmax for April is the mean of each April’s Tmax for the observation period of record. Mean monthly Tmin and TMedian monthly precip amount are calculated similarly.
6. Data Access:
This data is available through the Oak Ridge National Laboratory (ORNL) Distributed Active Archive Center (DAAC).
Data Archive Center:
Contact for Data Center Access Information:
E-mail: uso@daac.ornl.gov
Telephone: +1 (865) 241-3952
7. References:
Daubenmire, R. 1972a. Ecology of Hyparrhenia rufa in derived savanna in north-western Costa Rica. J. Applied Ecology 9: 11-23.
Daubenmire, R. 1972b. Standing crops and primary production in savanna derived from semi-deciduous forest in Costa Rica. Botanical Gazette 133: 395-401.
Olson, R.J., K.R. Johnson, D.L. Zheng, and J.M.O. Scurlock. 2001. Global and Regional Ecosystem Modeling: Databases of Model Drivers and Validation Measurements. ORNL Technical Memorandum TM-2001/196. Oak Ridge National Laboratory, Oak Ridge, Tennessee, U.S.A.
Additional Sources of Information:
Daubenmire, R. 1972c. Some ecological consequences of converting forest to savanna in north-western Costa Rica. Tropical Ecology 13: 31-51.
Esser, G. 2013. NPP Multi-Biome: Global Osnabruck Data, 1937-1981. Data set. Available on-line [http://daac.ornl.gov] from Oak Ridge National Laboratory Distributed Active Archive Center, Oak Ridge, Tennessee, USA. doi:10.3334/ORNLDAAC/214
Horowitz, W. (ed.). 1970. Official Methods of Analysis, Association of Official Analytical Chemists.
Olson, R.J., J.M.O. Scurlock, S.D. Prince, D.L. Zheng, and K.R. Johnson (eds.). 2013a. NPP Multi-Biome: Global Primary Production Data Initiative Products, R2. Data set. Available on-line [http://daac.ornl.gov] from the Oak Ridge National Laboratory Distributed Active Archive Center, Oak Ridge, Tennessee, USA. doi:10.3334/ORNLDAAC/617
Olson, R.J., J.M.O. Scurlock, S.D. Prince, D.L. Zheng, and K.R. Johnson (eds.). 2013b. NPP Multi-Biome: NPP and Driver Data for Ecosystem Model-Data Intercomparison, R2. Data set. Available on-line [http://daac.ornl.gov] from the Oak Ridge National Laboratory Distributed Active Archive Center, Oak Ridge, Tennessee, USA. doi:10.3334/ORNLDAAC/615
Scurlock, J.M.O., and R.J. Olson. 2002. Terrestrial net primary productivity - A brief history and a new worldwide database. Environ. Rev. 10(2): 91-109. doi:10.1139/a02-002
Scurlock, J.M.O., and R.J. Olson. 2013. NPP Multi-Biome: Grassland, Boreal Forest, and Tropical Forest Sites, 1939-1996, R1. Data set. Available on-line [http://daac.ornl.gov] from Oak Ridge National Laboratory Distributed Active Archive Center, Oak Ridge, Tennessee, USA. doi:10.3334/ORNLDAAC/653
Scurlock, J.M.O., K. Johnson, and R.J. Olson. 2002. Estimating net primary productivity from grassland biomass dynamics measurements. Global Change Biology 8(8): 736-753. DOI: 10.1046/j.1365-2486.2002.00512.x