Get Data
Summary:
This data set contains eight data files (.txt format): three net primary productivity (NPP) data files and five climate data files. The NPP estimates are based on field measurements of litterfall accumulation at three tropical rainforest sub-sites near Atherton, Queensland, in northeast Australia. Additional NPP component data include standing litter biomass, leaf decomposition rates, and nutrient concentrations in litter, where available. Precipitation and temperature data are provided from measurements at two of the study sites, nearby weather stations, and from published literature sources.
Annual litterfall estimates are based on weekly or bi-weekly measurements for 3-4 years (1974/5-1978) at the Wongabel (17.32 S 145.50 E) and the Gadgarra (17.30 S 145.72 E) State Forest Reserves, and weekly measurements for 5 years (1980-1985) at Tableland (17.28 S 145.57 E) near Atherton. Additional measurements were made at Wongabel and Gadgarra including branchfall (monthly); litter on the forest floor (quarterly); rainfall and throughfall (weekly); and trace element concentrations in litterfall (weekly or bi-weekly). In a related study at Gadgarra, litterfall and standing litter crop were sampled at approximately 19-day intervals from 1974 to 1976 and at approximately 3-month intervals 1976 to 1978.
Total litterfall averaged 905 g/m2/year at Wongabel, 987 g/m2/year at Gadgarra, and 1,103 g/m2/year at Tableland, giving minimum estimates of above-ground NPP for this region of Australia and an indication of tropical forest productivity south of the Equator.
Revision Notes: Only the documentation for this data set has been modified. The data files have been checked for accuracy and are identical to those originally published in 2001.
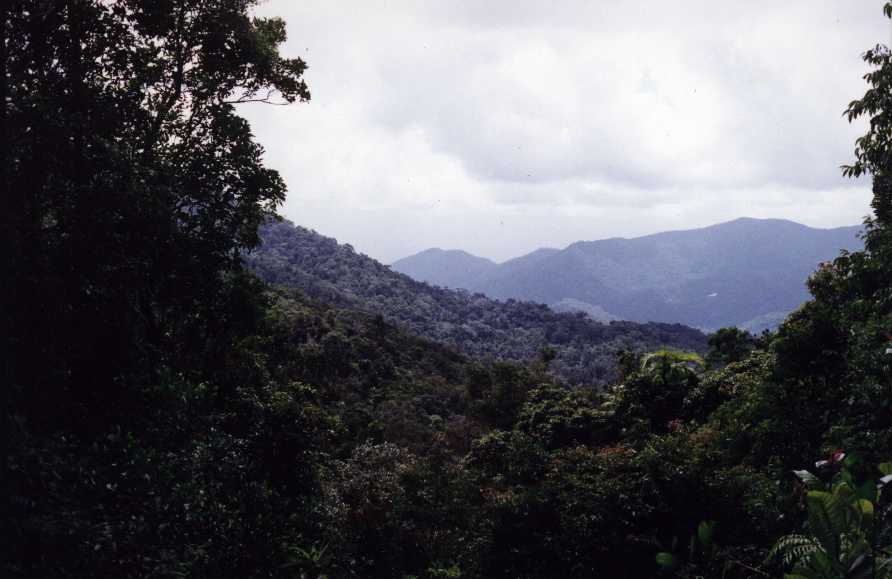
Figure 1. View looking roughly East-South-East from a point about 17.20 S 145.87 E, to the north-east of the Atherton tropical forest site, Australia. (Photograph taken October 1999 by Lazaros Kastanis, Queensland Department of Natural Resources, Australia).
Additional Documentation:
The NPP data collection contains field measurements of biomass, estimated NPP, and climate data for terrestrial grassland, tropical forest, boreal forest, and tundra sites worldwide. Data were compiled from the published literature for intensively studied and well-documented individual field sites and from a number of previously compiled multi-site, multi-biome data sets of georeferenced NPP estimates. The principal compilation effort (Olson et al., 2001) was sponsored by the NASA Terrestrial Ecology Program. For more information, please visit the NPP web site at http://daac.ornl.gov/NPP/npp_home.html.
Data Citation:
Cite this data set as follows:
Stocker, G.C. 2013. NPP Tropical Forest: Atherton, Australia, 1974-1985, R1. Data set. Available on-line [http://daac.ornl.gov] from Oak Ridge National Laboratory Distributed Active Archive Center, Oak Ridge, Tennessee, USA. doi:10.3334/ORNLDAAC/577
This data set was originally published as:
Stocker, G.C. 2001. NPP Tropical Forest: Atherton, Australia, 1974-1985.
Data set. Available on-line [http://daac.ornl.gov] from Oak Ridge
National Laboratory Distributed Active Archive Center, Oak Ridge,
Tennessee, U.S.A.
Table of Contents:
- 1 Data Set Overview
- 2 Data Description
- 3 Data Applications and Derivation
- 4 Quality Assessment
- 5 Data Acquisition Materials and Methods
- 6 Data Access
- 7 References
1. Data Set Overview:
Project: Net Primary Productivity (NPP)
The NPP measurements represent the quantity and temporal distribution of litterfall in three rainforest sites in northeast Australia. The three study sites are located on the Atherton Tableland, which is a flat-to-undulating plateau at 680 m to 820 m elevation. Prior to European settlement, towards the end of the nineteenth century almost the whole of the Atherton Tableland was clothed in rainforest. Patches of the original vegetation remain in forest reserves and on private land. The Wongabel and Gadgarra sites are well-developed rainforests with no evidence of disturbance while the Tableland site was severely disturbed by drought and forest fires in 1915 and a cyclone in 1918.
The NPP data file for each study site contains estimates of annual litterfall accumulation based on field measurements as well as standing litter biomass, nutrient content of litter, and leaf decomposition rates, where available. Total litterfall averaged 905 g/m2/year at Wongabel, 987 g/m2/year at Gadgarra, and 1,103 g/m2/year at Tableland (Scurlock and Olson, 2012; Stocker et al., 1995), providing minimum estimates of above-ground NPP in this region of Australia and an indication of productivity of tropical forests south of the Equator. Precipitation and temperature data are provided in separate climate data files.
2. Data Description:
This data set contains eight text files: three NPP data files and five climate data files. The NPP files contain field measurements of annual litterfall accumulation recorded at three tropical rainforest sites near Atherton, Queensland, in northeast Australia. Additional site-specific data include standing litter biomass, nutrient content of litter, and leaf decomposition rates where available. Climate data are provided from measurements at two of the study sites, at nearby weather stations, and from published sources.
Spatial Coverage
Site: Atherton, Australia
Site Boundaries (All latitude and longitude given in decimal degrees)
| Site (Region) | Westernmost Longitude | Easternmost Longitude | Northernmost Latitude | Southernmost Latitude | Elevation (m) |
|---|---|---|---|---|---|
| Atherton, Australia | 145.50 | 145.72 | -17.28 | -17.32 | 700-760 |
Sub-Site Boundaries (All latitude and longitude given in decimal degrees)
| Site (Region) | Westernmost Longitude | Easternmost Longitude | Northernmost Latitude | Southernmost Latitude | Elevation (m) | MAP(mm) |
|---|---|---|---|---|---|---|
| Atherton, Australia | 145.50 | 145.72 | -17.28 | -17.32 | 700-760 | 1,560 |
| Gadgarra | 145.72 | 145.72 | -17.30 | -17.30 | 700 | 2,100 |
| Tableland | 145.57 | 145.57 | -17.28 | -17.28 | 720 | 1,427 |
MAP = mean annual precipitation
Site Information
The Atherton study sites are located about 24 km apart on the Atherton tableland, a flat to undulating plateau developed mainly on Cainozoic basalt flows and pyroclasts and varying in altitude from 680 to 820 m. The eastern edge of the tableland is deeply incised by streams flowing into the Coral Sea about 30 km to the east. The climate is tropical with summer rains and only moderate change in temperature from summer to winter.
Soils at the Wongabel and Gadgarra sites are typical krasnozems that have developed on the Atherton basalts. The Wongabel site lies adjacent to a well-defined cinder cone and the surface is littered with many pyroclastic bombs and other debris. The soil of the Gadgarra site is less stony and has a greater depth of weathering.
The Tableland site is on a relatively level Holocene vesicular basalt flow at 720 m elevation. The dark red soil is derived from basalt with a silty-clay top soil and clay subsoil. Stones and small boulders of vesicular basalt cover the surface of much of the plot. The soil is very similar to that of the nearby Wongabel site.
Prior to European settlement, towards the end of the nineteenth century almost the whole of the Atherton Tableland was clothed in rainforest. Although most of the area was soon cleared for maize and dairy farming, patches of the original vegetation remain in forest reserves and on private land. Within the forest reserves, some of the rainforest has been converted to plantations of the conifer Araucaria cunninghamii. A belt of rainforest (~ 100 m and continuous with larger blocks of rainforest) was left undisturbed around these plantations to serve as a firebreak. The Wongabel and Gadgarra sites are well-developed rainforests with no evidence of disturbance while the Tableland site was severely disturbed by drought and forest fires in 1915 and a cyclone in 1918.
The Wongabel site is within the 635-ha Wongabel State Forest Reserve. The rainforest fits Webb's (1959) description of a complex mesophyll vine forest but with a simpler structure and species composition. At this site, a nearly complete canopy at 20-25 m dominated by Dendrocnide photinophylla and Castanospora alphandii permits only diffuse light to penetrate to the strata below. This seems to favor a relatively uniform understory, 1-3 m high, dominated by the shrub Hodgkinsonia frutescens. Other species in this layer include seedlings of the trees Castanospermum australe, C. alphandii, Austromyrtus sp. and Rhodomyrtus macrocarpa, and the climbing palm Calamus caryotoides.
The Gadgarra site is within the 15,820-ha Gadgarra State Forest Reserve. This complex mesophyll vine forest has more variety in both structure and composition than the Wongabel rainforest. There is no uniform canopy layer, as scattered emergent stems (30-35 m) overtop smaller trees varying from 10 to 20 m in height. Dominant canopy species is Rockinghamia angustifolia. The gaps in the upper canopy admit patches of direct sunlight to the understory, which, unlike that at Wongabel, is both variable in height and composed of a wide variety of species such as Calamus moti, Melicope fareana, Argyrodendron peralatum, Macaranga inamoena, Aglaia ferruginea, and Synima cordieri.
The vegetation of the Tableland site is classified as complex notophyll vine forest (type 8) (Knowlton et al., 1995). The site, also in a state forest, is characterized by a 40-45 m canopy dominated by Toona australis and Aleurites moluccana with a fairly dense shrub layer about 1.5 m in height. The shrub stratum is comprised predominantly of Hodgkinsonia frutescens and to a lesser extent Phaleria octandra and the shrub stage of the vine Dichapetalum papuanum. The scrambling stage of C. caryotoides is also very prominent in this layer. The present size and distribution of T. australis and A. moluccana appear strongly influenced by drought, fire, and cyclone events of the early 1900s. Most large trees of A. moluccana were senescent and not being replaced by recruitment during studies of Stocker et al. (1995).
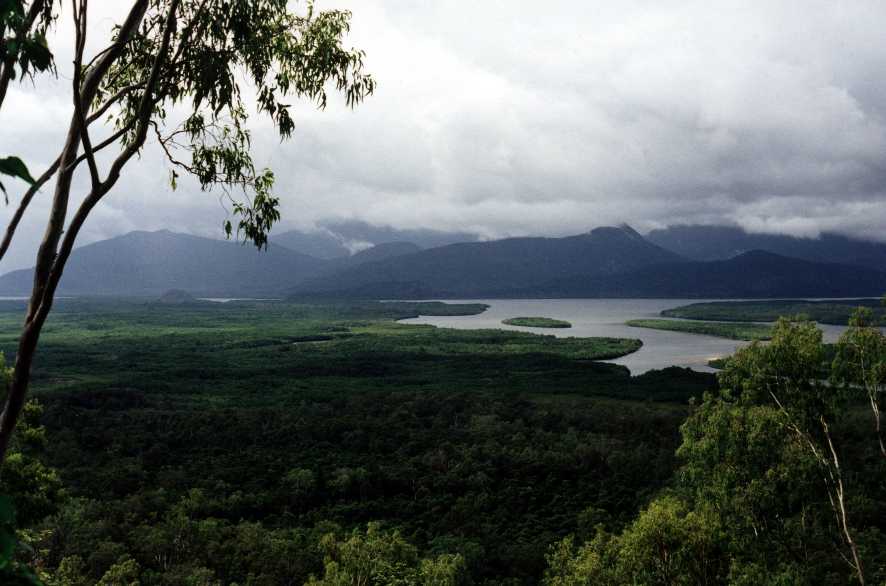
Figure 2. View looking East from a point about 18.51 S 146.19 E, about 50-100 km south of the Atherton tropical forest site, Australia, where the rainforest and mangrove zones meet. The island in the distance is Hinchinbrook Island. N.B. This image adjoins the preceding one. (Photograph taken October 1999 by Lazaros Kastanis, Queensland Department of Natural Resources, Australia).
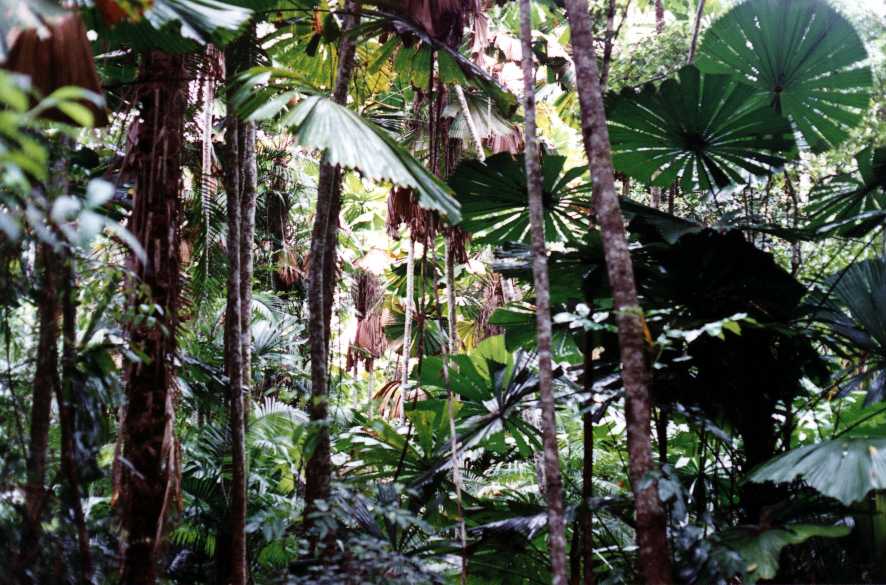
Figure 3. View looking West from a point about 17.68 S 146.09 E, to the south-east of the Atherton tropical forest site, Australia. (Photograph taken October 1999 by Lazaros Kastanis, Queensland Department of Natural Resources, Australia).
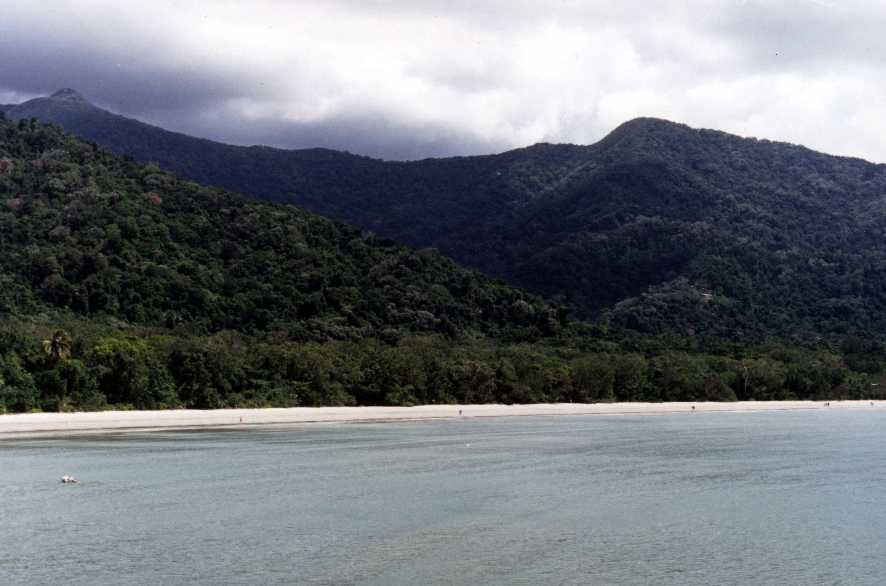
Figure 4. View looking North-East from a point about 15.84 S 145.35 E, near the Atherton tropical forest site, Australia. (Photograph taken by Lazaros Kastanis, Queensland Department of Natural Resources, Australia).
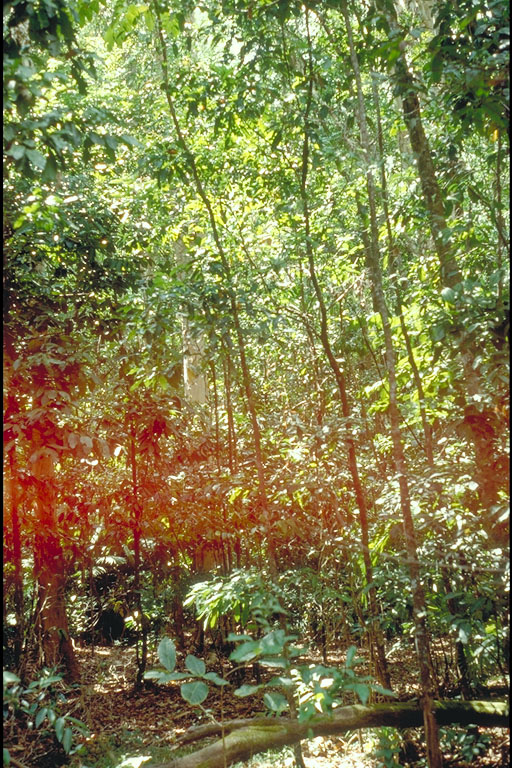
Figure 5. View looking West from a point about 17.20 S 145.87 E, to the north-east of the Atherton tropical forest site, Australia. (Photograph taken October 1999 by Lazaros Kastanis, Queensland Department of Natural Resources, Australia).
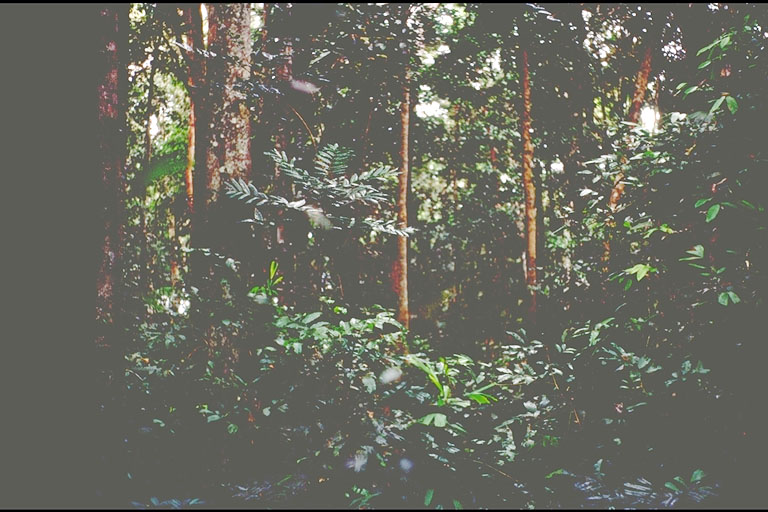
Figure 6. Another view looking West from a point about 17.20 S 145.87 E, to the north-east of the Atherton tropical forest site, Australia. (Photograph taken October 1999 by Lazaros Kastanis, Queensland Department of Natural Resources, Australia).
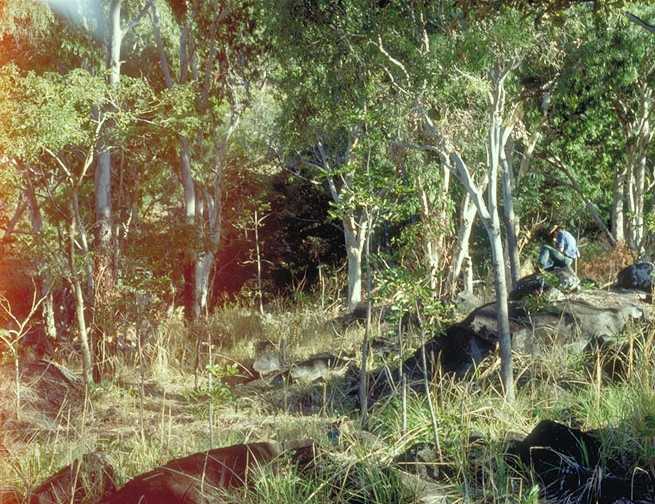
Figure 7. View looking East from a point about 16.09 S 145.35 E (near the edge of the rainforest zone), about 50-100 km north of the Atherton tropical forest site, Australia. (Photograph taken October 1999 by Lazaros Kastanis, Queensland Department of Natural Resources, Australia).
Spatial Resolution
The study plots at both Wongabel and Gadgarra were 50 x 50-m in size. Each plot contained circular litter traps with collecting areas of 0.5 m2 (Spain, 1984) or 0.7 m2 (Brasell et al., 1980). Brasell et al. (1980) also established 5 x 5-m subplots for branchfall (> 2 cm diameter) and 50 x 50-cm quadrats for sampling litter on the forest floor. Spain (1984) collected 31.6 x 31.6-cm samples of litter standing crop. Soil samples were taken at 0-10, 10-20 and 20-30-cm depths within each 50 x 50-m plot (Brasell et al., 1980). The Tableland study area was a 0.5 ha plot (50 x 100-m) containing circular litter traps with collecting areas of 0.65-m2 (Stocker et al., 1995).
Temporal Coverage
Litterfall, branchfall, and litter on the forest floor were collected at the Wongabel site from 1974/07/01 through 1978/07/31 and at the Gadgarra site from 1975/07/01 through 1978/07/31 (Brasell et al., 1980). Rainfall and throughfall were collected at Wongabel and Gadgarra from 1976/01/01 through 1977/06/30 (Brasell and Sinclair, 1983). In a separate study (Spain, 1984), leaf, wood, and fruit fall were collected at Gadgarra from 1975/01/01 through 1977/12/31, and litter standing crop was harvested from 1974/11/04 through 1978/01/31. Leaf, twig, fruit, and other litterfall were collected at the Tableland site for 5 years, from 1980/05/01 through 1985/04/30 (Stocker et al., 1995). Climate data are available for several time periods from the 1880s to 1990s.
Temporal Resolution
Litterfall was collected weekly at all three sites (Brasell et al., 1980; Brasell and Sinclair, 1983; Stocker et al., 1995). A two-week sampling interval was maintained for the dry season at the Wongabel and Gadgarra sites, except for a few monthly collections when litter production was at its lowest level. Additional litter collections were made at Wongabel and Gadgarra: branchfall, monthly; litter on the forest floor, quarterly; and rainfall and throughfall, weekly. In a related study at Gadgarra (Spain, 1984), litterfall and litter standing crop were sampled at approximately 19-day intervals from November 1974 until January 1976 and at approximately 3-monthly intervals from April 1976 to January 1978.
The litterfall production rates are based on plant dry matter accumulation. At Wongabel and Gadgarra, annual production rates are expressed as g/m2/year for total litterfall and litterfall components. Monthly litter accumulation at Gadgarra (g/m2) is also estimated. Nitrogen and phosphorus concentration in litterfall are expressed as % of dry weight. Rainfall and throughfall data (mm/week) are provided in the literature. At the Tableland site, litterfall estimates are expressed as 5-year mean monthly rates (g/m2/month) for total litterfall and 5-year mean annual rates (g/m2/year) for total litterfall and for each litterfall component.
Climate data are expressed as monthly and annual precipitation amounts (mm) and monthly and annual average temperature and maximum/minimum temperature (C). Monthly and annual climatic means are provided for several time periods from the 1880s to 1990s.
Data File Information
Table 1. Data files in this data set archive
| FILE NAME | TEMPORAL COVERAGE | FILE CONTENTS |
|---|---|---|
| ath1_npp.txt | 1974/07/01-1978/07/31 | Litterfall, branchfall, and litter mineral-element composition data for Wongabel sub-site |
| ath2_npp.txt | 1974/11/04-1978/07/31 | Leaf, wood, and fruit fall, litterfall, branchfall, leaf decomposition, and litter mineral-element composition data for Gadgarra sub-site |
| ath3_npp.txt | 1980/05/01-1985/04/30 | Leaf, twig, fruit, other, and total litterfall data for the Tableland sub-site |
| ath1_cli.txt | 1974/09/01-1985/12/31 | Monthly and annual climate data measured at the three sub-sites (data read from graphs and/or reported in text/tables of references) |
| ath2_cli.txt | 1880s-1990s (see Table 8) | Mean monthly and annual climate data for the three sub-sites from nearby weather stations |
| ath3_cli.txt | 1957/01/01-1998/12/31 | Monthly and annual climate data for Wongabel from a nearby weather station (interpolated values) |
| ath4_cli.txt | 1957/01/01-1998/12/31 | Monthly and annual climate data for Gadgarra from a nearby weather station (interpolated values) |
| ath5_cli.txt | 1957/01/01-1998/12/31 | Monthly and annual climate data for Tableland from a nearby weather station (interpolated values) |
NPP Data. NPP estimates for the Atherton sites are provided in three text files (.txt format) files, one for each sub-site (Table 1). The variable values are delimited by semicolons. The first 18 lines are metadata; data records begin on line 19. The value -999.9 is used to denote missing values.
Table 2. Column headings in NPP files
| COLUMN HEADING | DEFINITION | UNITS |
|---|---|---|
| Site | Site where data were gathered (code refers to sub-site identification) | Text |
| Treatmt | Long term management of site (code refers to treatment described in metadata in data file) | |
| Year | Year(s) in which data were collected | Numeric |
| Month | Month in which data were collected | |
| Day | Day on which data were collected | |
| parameter | Parameter measured (see definitions in Tables 3, 4, and 5) | Text |
| amount | Data value | Numeric |
| units | Units of measure | Text |
| References/Comments | Reference to primary data sources and/or explanatory comments |
Table 3. Definition of parameters <ath1_npp.txt> file (Wongabel)
| PARAMETER | DEFINITION | UNITS |
|---|---|---|
| height | Top height of emergent stems | m |
| Totlittfall | Total litterfall (leaf material plus reproductive parts, branchlets up to 2 cm diameter, bark, moss, lichen, and animal, bird and insect matter) | g/m2/year |
| branchfall | Branch litterfall (branches > 2 cm diameter) | |
| litter-N | Nitrogen concentration in total litterfall | % of dry weight |
| litter-P | Phosphorus concentration in total litterfall | |
| branchfall-N | Nitrogen concentration in branch litterfall | g/m2/year |
| branchfall-P | Phosphorus concentration in branch litterfall |
Sample NPP Data Record <ath1_npp.txt>
| Site; Treatmt; Year; Month; Day; parameter; amount; units; Reference/ Comments atw; none; -999.9; -999.9; -999.9; height; 35; m atw; none; 1974-75; 7; -999.9; Totlittfall; 930; g/m2/year; Brasell et al. (1980) atw; none; 1975-76; 7; -999.9; Totlittfall; 900; g/m2/year; Brasell et al. (1980) atw; none; 1976-77; 7; -999.9; Totlittfall; 870; g/m2/year; Brasell et al. (1980) ... |
Table 4. Definition of parameters <ath2_npp.txt> (Gadgarra)
| PARAMETER | DEFINITION | UNITS |
|---|---|---|
| height | Top height of emergent stems | m |
| Totlittfall | Total litterfall (leaf material plus reproductive parts, branchlets up to 2 cm diameter, bark, moss, lichen, and animal, bird and insect matter) | g/m2/year |
| leaflittfall | Leaves and leafy material including sheathing stipules in litterfall | |
| woodlittfall | Fine woody material including twigs, fine branches (2.5 cm diameter), and bark in litterfall | |
| frtflolittfall | Reproductive structures (flowers, fruit, and seeds) in litterfall | |
| Totlittfall | Total litterfall (leaf + fine wood + reproductive material plus amorphous, finely divided material) | |
| branchfall | Branch litterfall (branches > 2 cm diameter) | |
| litter-N | Nitrogen concentration in total litterfall | % of dry weight |
| litter-P | Phosphorus concentration in total litterfall | |
| branchfall-N | Nitrogen concentration in branch litterfall | g/m2/year |
| branchfall-P | Phosphorus concentration in branch litterfall | |
| leafdecomp (k) | Estimate of the annual decomposition coefficient (k) based on ratio of litterfall to litter standing crop | dimensionless |
| litter | Monthly total forest floor litter standing crop (leaf + fine wood + reproductive + amorphous material; estimated from graphs) | g/m2 |
Sample NPP Data Record <ath2_npp.txt>
| Site; Treatmt; Year; Month; Day; parameter; amount; units; Reference/ comments atg; none; -999.9; -999.9; -999.9; height; 35; m; Brasell et al. (1980) atg; none; 1975-76; 7; -999.9; Totlittfall; 1030; g/m2/year; Brasell et al. (1980) Jul-Jun atg; none; 1976-77; 7; -999.9; Totlittfall; 1060; g/m2/year; Brasell et al. (1980) Jul-Jun atg; none; 1977-78; 7; -999.9; Totlittfall; 870; g/m2/year; Brasell et al. (1980) Jul-Jun ... |
Table 5. Definition of parameters <ath3_npp.txt> file (Tableland)
| PARAMETER | DEFINITION | UNITS |
|---|---|---|
| height | Top height of emergent stems | m |
| Totlittfall | Total litterfall (twigs up to 1 cm diameter + old leaves including phyllodes, leaflets, and rachii + fresh leaves + flower buds + flowers + immature fruit + mature fruit + stipules + bark) | g/m2/month |
| leaflittfall | Old and fresh leaves and leafy material in litterfall | g/m2/year |
| twiglittfall | Twigs and fine branches (up to 1 cm diameter) in litterfall | |
| frtflolittfall | Reproductive structures (flower buds + mature flowers + immature flowers + immature fruit + mature fruit) in litterfall | |
| otherlittfall | Other litterfall material (remnants + invertebrate & vertebrate feces + invertebrate & vertebrate animal parts + galls + stipules + bark + fungi & lichens) | |
| Totlittfall | Total litterfall (leaf + twig + reproductive + other litter material) |
Sample NPP Data Record <ath3_npp.txt>
| Site; Treatmt; Year; Month; Day; parameter; amount; units; Reference/ Comments att; none; -999.9; -999.9; -999.9; height; 40-45; m; all data from Stocker et al. (1995) att; none; 1980-84; 5; -999.9; Totlittfall; 76.3; g/m2/month; mean of 5 years att; none; 1980-84; 6; -999.9; Totlittfall; 56.3; g/m2/month; mean of 5 years att; none; 1980-84; 7; -999.9; Totlittfall; 75.4; g/m2/month; mean of 5 years ... |
Climate Data. Climate data for the Atherton sites are provided in five text files (.txt format) (see Table 3). The variable values are delimited by semicolons. The first 18 lines are metadata; data records begin on line 19. Precipitation values are in mm; temperature in degrees C. The value -999 is used to denote missing values.
Table 6. Contents of climate files
| File Name | Sub-Site | Parameter | Temporal Coverage | Temporal Resolution |
|---|---|---|---|---|
| ath1_cli.txt | atw (Wongabel) | Precipitation amount | 1974/08/01-1978/06/30 | Month and year |
| atg (Gadgarra) | Precipitation amount | 1975/05/01-1978/05/31 | Month and year | |
| att (Tableland) | Mean precipitation, average temperature | 1980/01/01-1985/12/31 | Month and year | |
| Mean precipitation, maximum/minimum temperature | 1980/01/01-1985/12/31 | Annual | ||
| ath2_cli.txt | Wongabel | Mean precipitation | 1880s-1990s | Month and year |
| Maximum/minimum temperature | 1950s-1990s | Month and year | ||
| Gadgarra | Mean precipitation | 1880s-1990s | Month and year | |
| Maximum/minimum temperature | 1950s-1990s | Month and year | ||
| Tableland | Mean precipitation | 1910s-1990s | Month and year | |
| Maximum/minimum temperature | 1960s-1990s | Month and year | ||
| ath3_cli.txt | Wongabel | Mean precipitation, mean maximum/minimum temperature | 1957-1998 | Month and year |
| Precipitation amount, mean maximum/minimum temperature | 1957/01/01-1998/12/31 | Month and year | ||
| ath4_cli.txt | Gadgarra | Mean precipitation, mean maximum/minimum temperature | 1957-1998 | Month and year |
| Precipitation amount, mean maximum/minimum temperature | 1957/01/01-1998/12/31 | Month and year | ||
| ath5_cli.txt | Tableland | Mean precipitation, mean maximum/minimum temperature | 1957-1998 | Month and year |
| Precipitation amount, mean maximum/minimum temperature | 1957/01/01-1998/12/31 | Month and year |
Table 7. Weather station information
| Sub-Site | Location of Weather Station | Weather Station Elevation (m) | Weather Station Longitude | Weather Station Latitude |
|---|---|---|---|---|
| atw (Wongabel) | Onsite | 760 | 145.50 | -17.32 |
| atg (Gadgarra) | Onsite | 700 | 145.72 | -17.30 |
| att (Tableland) | Onsite | 700 | 145.57 | -17.28 |
| Wongabel | Herberton Post Office, Queensland | 899 | 145.38 | -17.39 |
| Gadgarra | Herberton Post Office, Queensland | 899 | 145.38 | -17.39 |
| Tableland | Kairi Research Station, Queensland | 715 | 145.57 | -17.22 |
Sample Climate Data Record (example from ath3_cli.txt)
| Site;Temp;Parm; Jan; Feb; Mar; Apr; May; Jun; Jul; Aug; Sep; Oct; Nov; Dec; Year atw ;mean;prec; 265; 257; 259; 111; 75; 44; 30; 26; 22; 32; 90; 142; 1352 atw ;mean;tmax; 28.4; 27.8; 26.6; 24.9; 23.0; 21.6; 21.3; 22.8; 25.2; 27.4; 29.0; 29.1; 29.9 atw ;mean;tmin; 19.0; 19.2; 18.3; 16.6; 14.8; 11.8; 11.0; 11.6; 13.1; 15.3; 17.2; 18.4; 10.2 atw ;numb;prec; 42; 42; 42; 42; 42; 42; 42; 42; 42; 42; 42; 42; 42 atw ;numb;tmax; 42; 42; 42; 42; 42; 42; 42; 42; 42; 42; 42; 42; 42 atw ;numb;tmin; 42; 42; 42; 42; 42; 42; 42; 42; 42; 42; 42; 42; 42 atw ;stdv;prec; 205; 147; 209; 63; 39; 27; 21; 33; 25; 28; 67; 73; 351 atw ;stdv;tmax; 1.3; 1.2; 0.9; 1.0; 0.9; 0.9; 1.1; 1.5; 1.2; 1.5; 1.0; 1.1; 0.8 atw ;stdv;tmin; 0.6; 0.6; 0.7; 1.0; 1.2; 1.5; 1.7; 1.4; 1.5; 1.1; 0.9; 0.7; 1.3 atw ;1957;prec; 521; 233; 199; 57; 51; 114; 35; 5; 0; 14; 109; 46; 1384 atw ;1957;tmax; 27.2; 29.4; 25.8; 25.9; 22.6; 21.5; 22.2; 24.5; 25.8; 29.5; 29.9; 30.0; 30.0 atw ;1957;tmin; 18.0; 19.0; 17.5; 15.5; 12.4; 11.3; 12.5; 10.7; 11.0; 14.1; 16.9; 17.6; 10.7 … Where, Temp (temporal) - specific year or long-term statistic: mean = mean based on all years numb = number of years stdv = standard deviation based on all years Parm (parameter): prec = precipitation for month or year (mm) tmax = mean maximum temperature for month or year (C) tmin = mean minimum temperature for month or year (C) |
3. Data Application and Derivation:
The accumulation of biomass, or NPP, is the net gain of carbon by photosynthesis that remains after plant respiration. While there are many fates for this carbon, this data set accounts for rates of litterfall in tropical rainforests and associated mineral elements, giving a minimum estimate of ANPP. The data represent an important pathway for the transfer of dry matter and minerals from the vegetation to the soil surface. Although NPP was not measured, the extensive site descriptions and litterfall data and the rarity of measurements in tropical forests south of the Equator make these data valuable. Prior to the current efforts, there had been no similar studies undertaken in the forests of tropical Australia.
The tropical forest data for the Atherton sites are provided for comparison with models and estimation of NPP. Climate data are provided for use in driving ecosystem/NPP models.
4. Quality Assessment:
The data are comparable to the mean masses of total litterfall, seasonal and annual variation in rainforest litterfall, and mineral-element concentrations in litterfall determined for tropical equatorial forests elsewhere. The standing crop of litter at the Atherton study sites is in the upper range of data reported for other tropical and sub-tropical rainforests. Total litterfall at the Tablelands was high for rainforests (see Brasell et al., 1980; Spain, 1984; Stocker et al., 1995).
Litter decomposition coefficients, based on input litterfall and the standing crops of litter, are intended to reflect the turnover of organic matter on the forest floor. Because the assumptions of simple exponential breakdown are unlikely to be met, the k estimates presented here must be considered as imperfect indices of the turnover of standing crops of litter. As far as litter standing crop is concerned, turnover rates may be better expressed as the total organic matter of litterfall and the standing crop of litter catabolized per unit area in an appropriate time period.
Sources of Error
Information not available.
5. Data Acquisition Materials and Methods:
Litter and Litterfall
Litterfall samples were collected at Wongabel and Gadgarra from 50 x 50 m plots (Brasell et al., 1980; Spain, 1984). Within each plot, ten circular litter traps with a collecting area of 0.7 m2 were randomly located on a 10 x 10-m grid. The traps were constructed from steel rod with fiberglass-gauze collecting surface (mesh 1.8 x 1.6-mm) and mounted 0.5 m above ground level. Litterfall was collected weekly and analyzed monthly.
Litterfall samples were oven-dried, weighed, ground, and passed through a 2-mm sieve. Total nitrogen was derived by semi-micro-Kjeldahl techniques using a sulphuric-peroxide digest (Baseden et al., 1974) and total phosphorus by Murphy and Riley's (1962) phospho-molybdate colorimetric method.
Brasell et al. (1980) collected branchfall (> 2 cm diameter) monthly from three random 5 x 5-m subplots. Litter on the forest floor was collected from ten random 50 x 50-cm quadrats at intervals of 3 months and approximately corresponding to the transition between the dry, storm, wet, and drizzle seasons. Branchfall and forest floor litter were analyzed as for litterfall.
Soil samples, from 0-10, 10-20 and 20-30-cm depths, were taken from five random points within each plot (Brasell et al., 1980). Following air-drying, the soils were ground in a mill (2-mm mesh). Soil particle-size distribution was determined by the hydrometer method and pH by a 1:5 soil:water suspension using a glass-calomel electrode system. Total nitrogen was determined by the Honda (1962) modification of the semi-micro-Kjeldahl digestion procedure, and total phosphorus by the colorimetric method of Murphy and Riley (1962) using a perchloric-nitric acid digest (Baseden et al., 1974).
In Spain's (1984) study at Gadgarra, litter collection traps were circular with a 1.5-mm mesh and collecting area of 0.5 m2; the rims were horizontal and approximately 1 m above the ground. Twenty traps were placed in each plot, with ten located randomly in each of two strata of 50 x 25-m to permit a more even sampling intensity across the plot than that available by simple random placement. Samples were oven dried and weighed. Ten samples of litter standing crop, each from a 31.6 x 31.6-cm area, were taken at random in each of two strata. All dead plant material was removed (except that adhering intimately to the Al horizon or mostly incorporated within it) and dried at 80 C. Samples were collected at approximately 19-day intervals (November 1974 to January 1976) and 3-monthly intervals (April 1976 to January 1978). The litterfall and litter standing crop samples were sorted into: (i) leaves and leafy material including sheathing stipules; (ii) fine woody material including twigs, fine branches (2.5 cm diameter) and bark; (iii) reproductive structures (flowers, fruits, and seeds); and (iv) amorphous, finely divided material.
Litterfall samples at Tableland were collected from a 0.5-ha plot (50 x 100-m) using thirty randomly-placed circular traps, each with collecting area of 0.65 m2 (Stocker et al., 1995). Trap design was similar to that of Brasell et al. (1980). Litterfall was collected weekly. After drying at 70-80 degrees C for 24 hours or more, litterfall was sorted into twigs (up to 1-cm diameter), old leaves (including phyllodes, leaflets, and rachii), fresh leaves, flower buds, flowers, immature fruit, mature fruit, stipules, bark, and other material. Old leaves were those which showed signs of senescence; fresh leaves ranged from leaf buds to mature leaves. All the vegetative components were further separated by plant species. Vegetative material which could not be identified was classed as remnants. Another sorting category included vertebrate feces, invertebrate feces, vertebrate body parts, invertebrate body parts, fungi, galls, and lichen. Litter masses were summed over the thirty traps, the weeks of each month, and all species to yield mean monthly litterfall rates for each litterfall component.
Rainfall and Throughfall
Within each plot at Wongabel and Gadgarra (Brasell and Sinclair, 1983), twenty 'Marquis' rain gauges, of 10-cm diameter and 280-mm rainfall capacity, were located at random to collect throughfall. Ten were adjacent to the litterfall traps at each site (Brasell et al., 1980). An additional rain gauge was located in a small clearing (less than 200 m from each rainforest plot) to measure rainfall. Samples of rainfall and throughfall were collected weekly and analyzed for mineral-element concentrations as for litterfall without filtration, digestion or concentration.
Climate Data
Air temperature and precipitation data in the climate files are available from several sources: (1) extracted from graphs, text, and/or tables in references; (2) measured at nearby weather stations; and (3) measured onsite. The nearest weather station to Wongabel and Gadgarra is at the Herberton Post Office, Queensland (17.39 S 145.38 E Elevation 899 m) and the weather station nearest to Tableland is at the Kairi Research Station, Queensland (17.22 S 145.57 E Elevation 715 m).
6. Data Access:
These data are available through the Oak Ridge National Laboratory (ORNL) Distributed Active Archive Center (DAAC).
Data Archive Center:
Contact for Data Center Access Information:
E-mail: uso@daac.ornl.gov
Telephone: +1 (865) 241-3952
7. References:
Brasell, H. M., and D. F. Sinclair. 1983. Elements returned to forest floor in two rainforest and three plantation plots in tropical Australia. Journal of Ecology 71: 367-378.
Brasell, H. M., G. L. Unwin, and G. C. Stocker. 1980. The quantity, temporal distribution and mineral element content of litterfall in two forest types at two sites in tropical Australia. Journal of Ecology 68: 123-139.
Olson, R. J., K.R. Johnson, D.L. Zheng, and J.M.O. Scurlock. 2001. Global and Regional Ecosystem Modeling: Databases of Model Drivers and Validation Measurements. ORNL Technical Memorandum TM-2001/196. Oak Ridge National Laboratory, Oak Ridge, Tennessee, U.S.A.
Spain, A. V. 1984. Litterfall and the standing crop of litter in three tropical Australian rainforests. Journal of Ecology 72: 947-961.
Stocker, G. C., W. A. Thompson, A. K. Irvine, J. D. Fitzsimon, and P. R. Thomas. 1995. Annual patterns of litterfall in a lowland and tableland rainforest in tropical Australia. Biotropica 27: 412-420.
Additional Sources of Information:
Baseden, S., A. Woolley, and P. W. Moody. 1974. Methods of Analysis of Soils, Plants and Waters. Department of Northern Territory, Darwin, Australia.
Honda, C. 1962. Acceleration of decomposition in nitrogen analysis of soil by the Kjeldahl method. Journal of the Science of Soil and Manure 33: 195-200.
Knowlton, R., G. Carpenter, and I. Webb. 1995. Soils information on the Permanent Plot Series of the Tropical Forest Research Centre. CSIRO Technical Bulletin, Queensland, Australia.
Murphy, J., and J. P. Riley. 1962. A modified single solution method for the determination of phosphate in natural waters. Analytica Chimica Acta 27: 31-36.
Scurlock, J.M.O., and R.J. Olson. 2002. Terrestrial net primary productivity – A brief history and a new worldwide database. Environ. Rev. 10(2): 91–109. doi:10.1139/a02-002
Scurlock, J.M.O., and R.J. Olson. 2012. NPP Multi-Biome: Grassland, Boreal Forest, and Tropical Forest Sites, 1939-1996, R1. Data set. Available on-line [http://daac.ornl.gov] from Oak Ridge National Laboratory Distributed Active Archive Center, Oak Ridge, Tennessee, U.S.A. doi:10.3334/ORNLDAAC/653
Spain, A. V., and R. P. le Feuvre. 1987. Breakdown of four litters of contrasting quality in a tropical Australian rainforest. Journal of Applied Ecology 24: 279-288.
Webb, L. J. 1959. A physiognomic classification of Australian rainforests. Journal of Ecology 47, 551-570.