Get Data
Revision Date: February 28, 2017
|
Please note that this version was superseded by Version 2 on 2017-02-28.
Follow this link to the latest version: Duchesne, R.R., M.J. Chopping, and K.D. Tape. 2016. NACP Woody Vegetation Characteristics of 1,039 Sites across North Slope, Alaska, V2. ORNL DAAC, Oak Ridge, Tennessee, USA. http://dx.doi.org/10.3334/ORNLDAAC/1365 Email us if you need additional assistance. |
Summary:
This data set provides the results of (1) field measurements of woody vegetation (shrubs) at 26 diverse sites across the North Slope of Alaska during 2010 and 2011, (2) field-based statistical estimates of site shrub structural characteristics, (3) high-resolution panchromatic satellite imagery-based estimates of the field site shrub characteristics using the Canopy Analysis with Panchromatic Imagery (CANAPI) model, and (4) adjusted CANAPI estimates of shrub characteristics at 1,013 selected sites widely distributed across the North Slope.
A site characterization file is included with the assigned “Physiognomic vegetation class”, which was one of the criteria for the selection of the 1013 CANAPI sites, and with the sources of the high resolution imagery used to obtain CANAPI estimates. The CANAPI crown detection algorithm (Chopping, 2011) is also provided as a companion file.
In total, there are five *.csv files and one companion *.txt file.
As part of a NASA-funded research project to map changes in tall shrub (taller than 0.5 m) abundance in Arctic tundra, a 3-week field campaign was carried out in both 2010 and 2011 on the North Slope of Alaska to statistically survey shrub structural characteristics at 26 sites. The field data presented include genus, crown height, crown radius, and spatial coordinates of all shrubs sampled at each 250 x 250-m site. These measurements were correlated with raw CANAPI structural estimates and the derived regression coefficients were applied to adjust CANAPI estimates for the field sites and additional sites across the North Slope. Together, the field measurements and image-based CANAPI estimates allowed the construction of a robust and extensive data resource of tall shrub characteristics at 1,039 tundra sites.
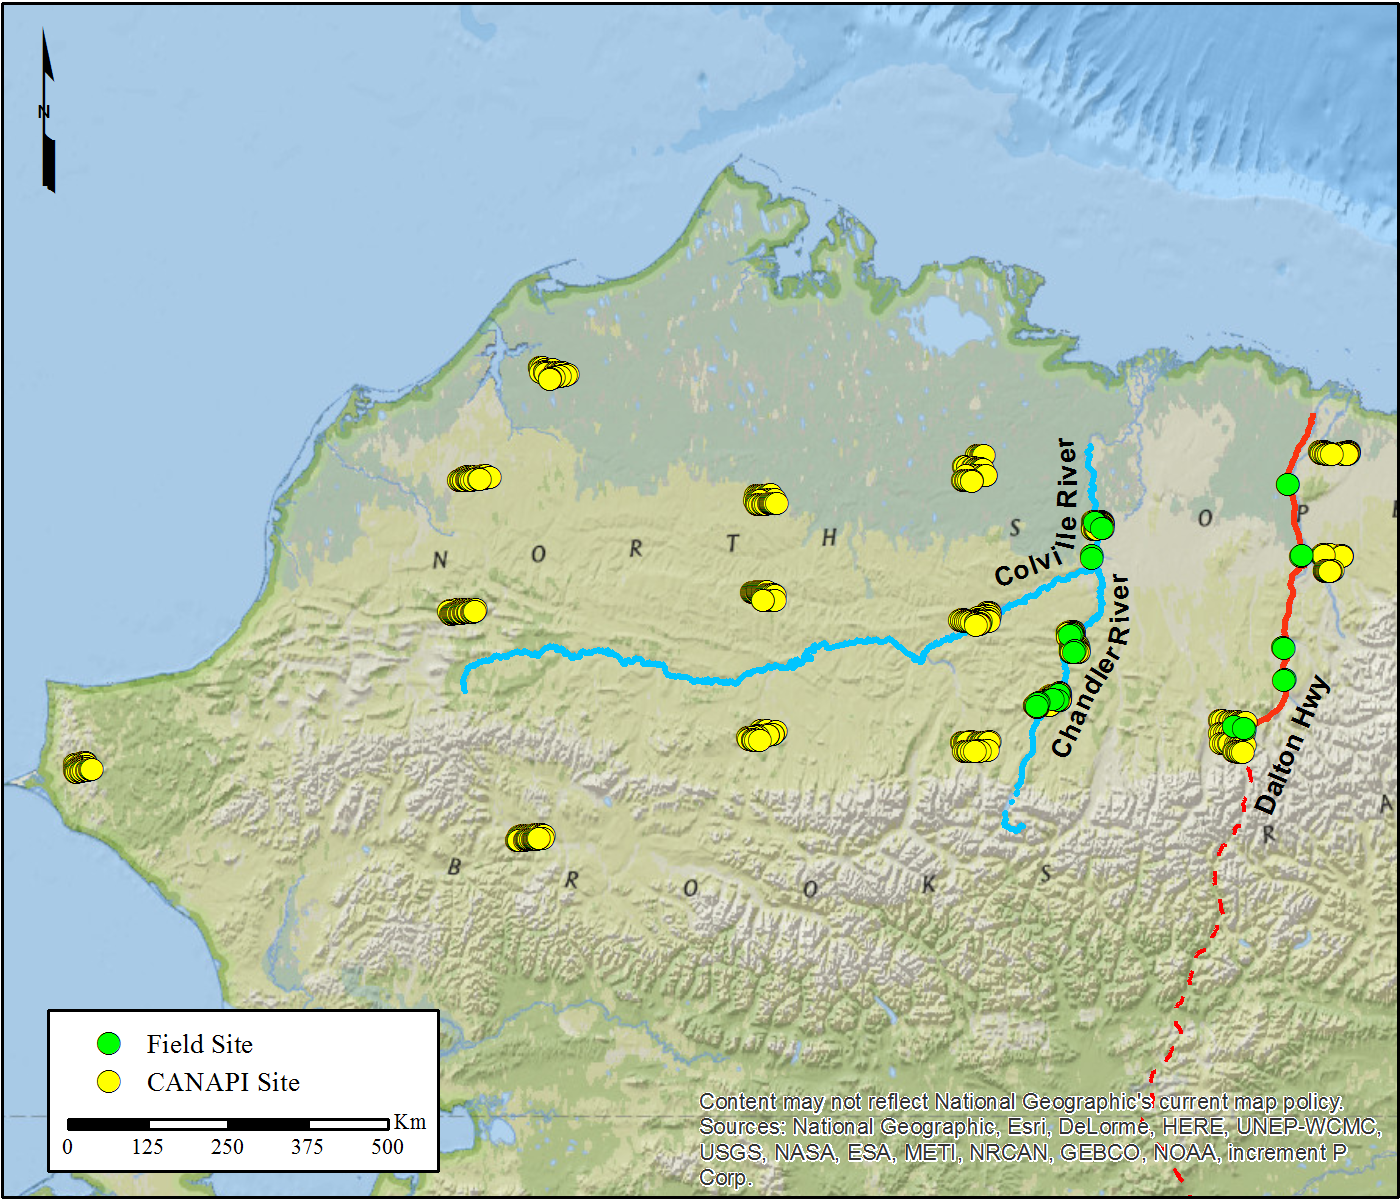
Figure 1. Locations of the 26 field sites and the 1,013 selected CANAPI sites, North Slope of Alaska.
Acknowledgement
Mapping Changes in Shrub Abundance and Biomass in Arctic Tundra using NASA Earth Observing System Data: A Structural Approach (NASA grant NNX09AL03G; PI: Mark Chopping)
Data and Documentation Access:
Get Data: http://daac.ornl.gov/cgi-bin/dsviewer.pl?ds_id=1270
Companion File:
A copy of the CANAPI model (Chopping M., 2011) is provided as a companion file. The file is named CANAPI_AK.txt.
Data Citation:
Cite this data set as follows:
Duchesne, R.R., M.J. Chopping, and K.D. Tape. 2015. NACP Woody Vegetation Characteristics of 1,039 Sites across the North Slope, Alaska. Data set. Available online [http://daac/ornl.gov/] from Oak Ridge National Laboratory Distributed Active Archive Center, Oak Ridge, Tennessee, USA. http://dx.doi.org/10.3334/ORNLDAAC/1270
Table of Contents:
- 1 Data Set Overview
- 2 Data Characteristics
- 3 Applications and Derivation
- 4 Quality Assessment
- 5 Acquisition Materials and Methods
- 6 Data Access
- 7 References
1. Data Set Overview:
Project: North American Carbon Program (NACP)
The NACP (Denning et al., 2005; Wofsy and Harriss, 2002) is a multidisciplinary research program to obtain scientific understanding of North America's carbon sources and sinks and of changes in carbon stocks needed to meet societal concerns and to provide tools for decision makers. Successful execution of the NACP has required an unprecedented level of coordination among observational, experimental, and modeling efforts regarding terrestrial, oceanic, atmospheric, and human components. The project has relied upon a rich and diverse array of existing observational networks, monitoring sites, and experimental field studies in North America and its adjacent oceans. It is supported by a number of different federal agencies through a variety of intramural and extramural funding mechanisms and award instruments.
This data set provides the results of (1) field measurements of woody vegetation (shrubs) at 26 diverse sites across the North Slope of Alaska during 2010 and 2011, (2) field-based statistical estimates of site shrub structural characteristics, (3) high-resolution panchromatic satellite imagery-based estimates of the field site shrub characteristics using the Canopy Analysis with Panchromatic Imagery (CANAPI) model, and (4) adjusted CANAPI estimates of shrub characteristics at 1,013 selected sites widely distributed across the North Slope.
A site characterization file is included with the assigned “Physiognomic vegetation class”, which was one of the criteria for the selection of the 1013 CANAPI sites, and with the sources of the high resolution imagery used to obtain CANAPI estimates. The CANAPI crown detection algorithm (Chopping, 2011) is also provided.
In total, there are five *.csv files and one companion *.txt file.
As part of a NASA-funded research project to map changes in tall shrub (taller than 0.5 m) abundance in Arctic tundra, a 3-week field campaign was carried out in both 2010 and 2011 on the North Slope of Alaska to statistically survey shrub structural characteristics at 26 sites. The field data presented include genus, crown height, crown radius, and spatial coordinates of all shrubs sampled at each 250 x 250-m site. These measurements were correlated with raw CANAPI structural estimates and the derived regression coefficients were applied to adjust CANAPI estimates for the field sites and additional sites across the North Slope. Together, the field measurements and image-based CANAPI estimates allowed the construction of a robust and extensive data resource of tall shrub characteristics at 1,039 tundra sites.
2. Data Characteristics:
Spatial Coverage
North Slope, Alaska
Spatial Resolution
Plots of 250 x 250-m are distributed across the North Slope. See Figure 1.
Temporal Coverage
The field work was conducted during the summers of 2010 and 2011 -- beginning 2010-07-28 and ending 2011-08-04.
High resolution panchromatic images used for estimating shrub characteristics were from various dates between 2002-07-19 and 2012-06-21.
Temporal Resolution
These are one-time measurements and estimates of shrub characteristics at field and selected CANAPI sites.
Site boundaries: (All latitude and longitude given in decimal degrees, datum: WGS84)
| Site (Region) | Westernmost Longitude | Easternmost Longitude | Northernmost Latitude | Southernmost Latitude |
|---|---|---|---|---|
| North slope of Alaska | -167 | -145 | 71.4 | 65 |
Projection Parameters
Projection Type: Albers Conical Equal Area Spheroid Name: WGS 84
Datum: WGS 84
Latitude of 1st standard parallel: 55N
Latitude of 2nd standard parallel: 65N
Longitude of central meridian: 154W
Latitude of origin of projection: 50N
False easting at central meridian: 0 meters False northing at origin: 0 meters
Data File Information
Field Shrub Canopy Structure Data
The structural characteristics of woody vegetation (genus, height, crown radius, and geographic location) were surveyed at fourteen 250 x 250-m sites along the Chandler and Colville rivers and at twelve 250 x 250-m sites along the Dalton Highway.
Results are contained in the files:
colville_shrub_data.csv
dalton_shrub_data.csv
Table 1. Variable descriptions for Colville_shrub_data.csv and dalton_shrub_data.csv data files.
| Column | Description | Units/format |
|---|---|---|
| Site | Unique identifier of site: The letters describe the name of the expedition, the following 4 digits are the collection year, and the last digits indicate the sites sequence north to south. | |
| Sp_genus | Scientific genus name up to 25 characters | |
| Canopy_height | Shrub height from ground to top most branch | Meters |
| Crown_radius | Shrub crown radius measured as half the distance from the left most branch to the right most branch | Meters |
| X_coordinate | Shrub location X coordinate (UTM, zone 5N) | Meters |
| Y_coordinate | Shrub location Y coordinate (UTM, zone 5N) | Meters |
Sample Data Records:
|
Site,Sp_genus,Canopy_height,Crown_radius,X_coordinate,Y_coordinate ,,Meters,Meters,Meters,Meters Colville201001,Alnus sp.,1.32,0.73,558010,7729420 Colville201001,Alnus sp.,1.34,1.05,558010,7729420 Colville201001,Alnus sp.,1.27,0.7,558022,7729439 Colville201001,Alnus sp.,1.18,1.35,558055,7729407 … Colville201014,Salix sp.,1.18,0.79,528109,7626599 Colville201014,Salix sp.,0.7,0.79,528127,7626600 Colville201014,Alnus sp.,1.05,0.49,528140,7626603 Colville201014,Alnus sp.,0.87,1.31,528161,7626608 |
Field Estimates Data
This data file contains estimates of mean crown radius, mean shrub height, total number of shrubs, and fractional cover for the 14 sites along the Chandler and Colville rivers and 12 sites along the Dalton Highway that were surveyed using the belt transect method.
Estimates of the structural characteristics of woody vegetation are contained
in the file field_estimates_data.csv.
Table 2. Variable descriptions for field_estimates_data.csv.
| Column | Description | Units/format |
|---|---|---|
| Site | Unique identifier of site: The letters describe the name of the expedition, the following 4 digits are the collection year, and the last digits indicate the sites sequence north to south. | |
| Number_of_shrubs_per_unit_area | Estimate of the total number of shrubs at each sampling site. Sites are 250 x 250 meters (6.25 ha). | Count |
| Canopy_height_mean | Shrub mean height estimated as the average height of all shrubs surveyed. | Meters |
| Crown_radius_mean | Shrub mean crown radius estimated as the average crown radius of all individual shrubs surveyed. | Meters |
| Shrub_area_fraction | Shrub fractional cover was estimated by dividing the “sum of all shrub crown area” by the area of the belt transects sampled at each site. | Range 0 to 1 |
| X_coordinate | X_coordinate of site center point. In Alaska Albers Equal Area Conic Projection, Spheroid WGS 84, Datum WGS 84 | Meters |
| Y_coordinate | Y_coordinate of site center point. In Alaska Albers Equal Area Conic Projection, Spheroid WGS 84, Datum WGS 84 | Meters |
Sample Data Records:
|
Site,Number_of_shrubs_per_unit_area,Canopy_height_mean,Crown_radius_mean,Shrub_area_fraction,X_coordinate,Y_coordinate ,,Count,Meters,Meters,Range 0 to 1,Meters,Meters Colville201001,18,1.22,1.142,0.001,98250,2190000 Colville201002,1520,1.582,1.007,0.126,102500,2187250 Colville201003,365,1.231,0.986,0.026,97750,2172250 … Dalton201110,570,0.656,0.529,0.023,189000,2081250 Dalton201111,360,0.63,0.67,0.009,182750,2082000 Dalton201112,0,0,0,0,188500,2081250 |
CANAPI Estimates Data
The adjusted image-based estimates for the 26 field sites and the 1013 selected sites, using the CANAPI (Canopy Analysis with Panchromatic Imagery) crown detection recognition algorithm (Chopping 2011), are in the file canapi_estimates.csv.
Table 3. Variable descriptions for canapi_estimates.csv.
| Column | Description | Units/format |
|---|---|---|
| Site | Unique identifier of site: Year of collection of high resolution imagery followed by four sequential digits. | |
| Adj_number_of_shrubs_per_unit_area | Adjusted CANAPI total number of shrubs after applying regression coefficients based on calibrated field measurements. Sites are 250 x 250 meters (6.25 ha). | Count |
| Adj_crown_radius_mean | Adjusted CANAPI shrub mean crown radius estimate after applying regression coefficients based on calibrated field measurements. | Meters |
| Adj_shrub_area_fraction | Adjusted CANAPI shrub fractional cover estimate after applying regression coefficients based on calibrated field measurements. | Range 0 to 1 |
| X_coordinate | Center point X coordinate in 250 x 250-m plot projected in an Albers Conical grid, Spheroid WGS 84, Datum WGS 84 | Meters |
| Y_coordinate | Center point Y coordinate in 250 x 250-m plot projected in an Albers Conical grid, Spheroid WGS 84, Datum WGS 84 | Meters |
Sample Data Records:
|
Site,Adj_number_of_shrubs_per_unit_area,Adj_crown_radius_mean,Adj_shrub_area_fraction,X_coordinate,Y_coordinate ,,Count,Meters,Range 0 to 1,Meters,Meters 20100001,953,0.8583,0.0653,90000,2120000 20100002,739,0.7538,0.0351,90250,2120000 20100003,631,0.8377,0.0402,89750,2119500 20100004,535,0.9534,0.0523,90250,2119500 … 20101010,253,0.766,0.013,186500,2068000 20101011,278,0.789,0.016,187500,2068000 20101012,173,0.746,0.008,188000,2068000 20101013,486,0.699,0.02,189000,2068000 |
Vegetation Class and Imagery Source Data
All sites have been assigned a “Physiognomic vegetation class” according to the circumpolar vegetation map of the CAVM Team (2003). Vegetation class diversity was one of the criteria for the selection of the 1,013 sites for CANAPI estimates. Also included in this file is the source of the high resolution imagery used to obtain CANAPI estimates for all sites.
The file containing the physiognomic vegetation class and imagery source data is CAVM-class_sensor-info.csv.
Table 4. Variable descriptions for CAVM-class_sensor-info.csv.
| Column | Description | Units/format |
|---|---|---|
| Site | Unique identifier of site: for field sites -- The letters describe the name of the expedition, the following 4 digits are the collection year, and the last digits indicate the sites sequence north to south. For selected and estimated sites -- Year of collection of high resolution imagery followed by four sequential digits. | |
| X_coordinate | Center point X coordinate in 250 x 250-m plot projected in an Albers Conical grid, Spheroid WGS 84, Datum WGS 84 | Meters |
| Y_coordinate | Center point Y coordinate in 250 x 250-m plot projected in an Albers Conical grid, Spheroid WGS 84, Datum WGS 84 | Meters |
| CAVM_class | Physiognomic vegetation class of sampling sites according to the CAVM Team (B=Barrens, G=Graminoid tundra, S=Erect-shrub tundra, W=Wetland) (CAVM Team. 2003) | |
| Sensor | Provenance of high resolution imagery used for obtaining CANAPI estimates for the entire reference database | |
| Acquisition_date | Date of acquisition of high resolution imagery | yyyy-mm-dd |
Sample Data Records:
|
Site,X_coordinate,Y_coordinate,CAVM_class,Sensor,Acquisition_date, ,,Meters,Meters,,yyyy-mm-dd Colville201001,98250,2190000,W,,-999 Colville201002,102500,2187250,W,QuickBird,2009-09-05 Colville201003,97750,2172250,S,,-999 Colville201004,97750,2171000,S,,-999 Colville201005,87750,2128750,G,QuickBird,2004-08-17 … 20101010,186500,2068000,G,GeoEye,2010-06-21 20101011,187500,2068000,G,GeoEye,2010-06-21 20101012,188000,2068000,G,GeoEye,2010-06-21 20101013,189000,2068000,G,GeoEye,2010-06-21 |
3. Data Application and Derivation:
The field data reported includes species name, crown height, crown radius, and spatial coordinates of all shrubs sampled at each site. The image-based estimates presented include mean height, mean crown radius, and fractional cover of shrubs at 1,013 sites. Only shrubs taller than 0.5 m were surveyed; the purpose of this data collection was to document the structural characteristics of the woody vegetation taller than 0.5 meters at the field sites, which were used for the training and validation of the empirical-boosted regression tree model that can retrieve shrub cover from bidirectional reflectance data (e.g., from the Earth-orbiting NASA Multiangle Imaging Spectro-Radiometer) and terrain variables.
4. Quality Assessment:
Accuracy of the regression equations used to adjust the CANAPI estimates for each vegetation parameter was assessed and reported in terms of the R-squared and the root mean square error (RMSE).
Table 5. R-squared and the root mean square error (RMSE)
| Vegetation Characteristic | R-squared | RMSE |
|---|---|---|
| Total number of shrubs | 0.54 | 446 shrubs |
| Mean crown radius | 0.80 | 0.28 meters |
| Fractional cover | 0.83 | 0.01 |
5. Data Acquisition Materials and Methods:
Field Site Descriptions
The structural characteristics of woody vegetation were surveyed at fourteen 250 x 250-m sites along the Chandler and Colville rivers and at twelve 250 x 250-m sites along the Dalton Highway (Figure 2). Sampling sites are in an altitudinal and latitudinal climatic gradient with the southernmost Dalton Highway sites at higher elevations and influenced by the continental climate coming from the Brook Range, while the northernmost Chandler and Colville river sites are located at a much lower elevations, where maritime climate conditions prevail.
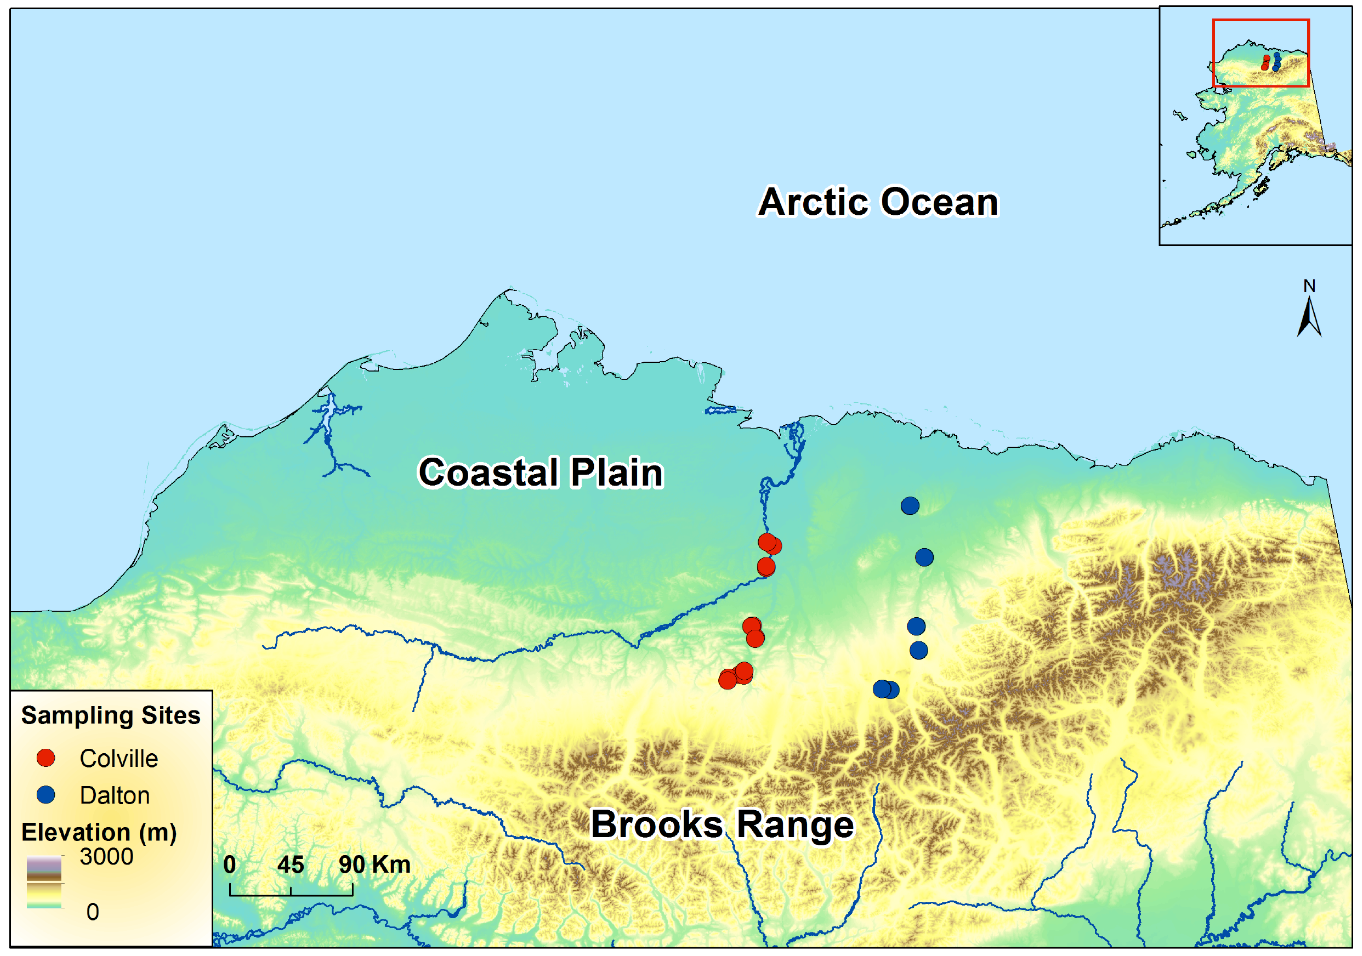
Figure 2. Field Sites: Sampling sites along the Colville and Chandler Rivers (on the left) and sampling sites along the Dalton Highway (on the right). (Source: AlaskaMapped SDMI WCS layers [downloaded file]. Alaska Mapped, Statewide Digital Mapping Initiative. URL: http://www.alaskamapped.org/data/arcgis-layer-files: [20 February, 2015])
The coordinates and elevation were determined using a Global Positioning System (GPS). Elevation data are +/- 30 m, and horizontal locations +/- 10 m. The X and Y coordinates are the center point in a 250 x 250-m site in standard Albers Conical Equal Area grid for Alaska, Spheroid WGS 84, Datum WGS 84.
Table 6. Field site descriptions. Note that for Site Identifier, Colville and Dalton denote the names of the 2010 and 2011 expeditions, respectively. The following 4 digits are the collection year, and the last digits indicate the site sequence north to south. Site Feature values identify either the river or highway near the field site.
| Site Identifier | Site Feature | X Coordinate | Y Coordinate | Elevation (m) | Number of Transects | Sampling Date | Available Photo |
|---|---|---|---|---|---|---|---|
| Colville201001 | Colville River | 98250 | 2190000 | 94 | Not applicable. Entire site surveyed. | 08/11/2010-08/12/2010 | |
| Colville201002 | Colville River | 102500 | 2187250 | 96 | 5 | 08/10/2010 | Figure 6 |
| Colville201003 | Colville River | 97750 | 2172250 | 96 | 10 | 08/09/2010 | |
| Colville201004 | Colville River | 97750 | 2171000 | 96 | 5 | 08/09/2010 | |
| Colville201005 | Chandler River | 87750 | 2128750 | 150 | 5 | 08/05/2010 | |
| Colville201006 | Chandler River | 86750 | 2128250 | 145 | 10 | 08/05/2010 | |
| Colville201007 | Chandler River | 89750 | 2120000 | 143 | 5 | 08/03/2010 | Figure 3 |
| Colville201008 | Chandler River | 89500 | 2119000 | 222 | 5 | 08/03/2010 | |
| Colville201009 | Chandler River | 81500 | 2095500 | 249 | 10 | 08/02/2010 | |
| Colville201010 | Chandler River | 81000 | 2092000 | 249 | 5 | 08/01/2010 | |
| Colville201011 | Chandler River | 78000 | 2092500 | 297 | 10 | 07/30/2010-07/31/2010 | |
| Colville201012 | Chandler River | 70000 | 2090500 | 287 | 5 | 07/29/2010 | |
| Colville201013 | Colville River | 69750 | 2090000 | 289 | 10 | 07/28/2010 | |
| Colville201014 | Colville River | 69250 | 2088250 | 290 | 10 | 07/29/2010 | Figure 4 |
| Dalton201101 | Dalton Highway | 203250 | 2216500 | 76 | 5 | 07/30/2011 | |
| Dalton201102 | Dalton Highway | 203500 | 2216750 | 78 | 5 | 07/30/2011 | |
| Dalton201103 | Dalton Highway | 213750 | 2178750 | 203 | 5 | 07/29/2011 | |
| Dalton201104 | Dalton Highway | 214000 | 2179000 | 225 | 5 | 07/29/2011 | |
| Dalton201105 | Dalton Highway | 207750 | 2128250 | 392 | 5 | 07/26/2011 | |
| Dalton201106 | Dalton Highway | 208250 | 2128000 | 392 | 5 | 07/26/2011 | |
| Dalton201107 | Dalton Highway | 209750 | 2110750 | 409 | 5 | 07/25/2011 | |
| Dalton201108 | Dalton Highway | 209750 | 2110250 | 438 | 5 | 07/25/2011 | |
| Dalton201109 | Dalton Highway | 183000 | 2082250 | 790 | 5 | 07/22/2011 | |
| Dalton201110 | Dalton Highway | 189000 | 2081250 | 752 | 5 | 08/04/2011 | |
| Dalton201111 | Dalton Highway | 182750 | 2082000 | 768 | 5 | 07/22/2011 | |
| Dalton201112 | Dalton Highway | 188500 | 2081250 | n/a | 5 | 08/04/2011 | Figure 5 |
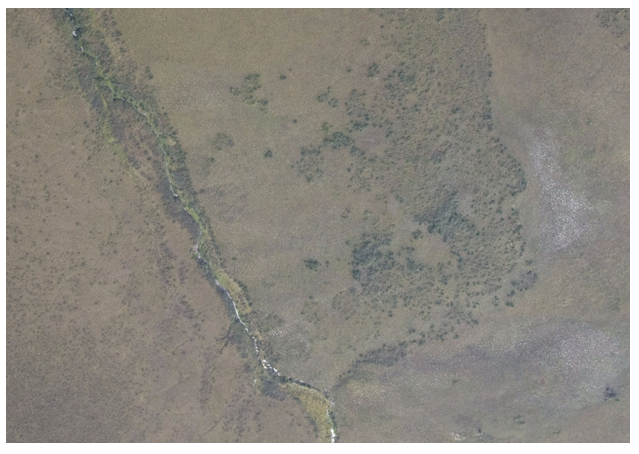
Figure 3. Aerial photograph of the Colville201007 field sampling site and surrounding landscape. The top of the image is north. Photo credit: Ken Tape (University of Alaska, Fairbanks).
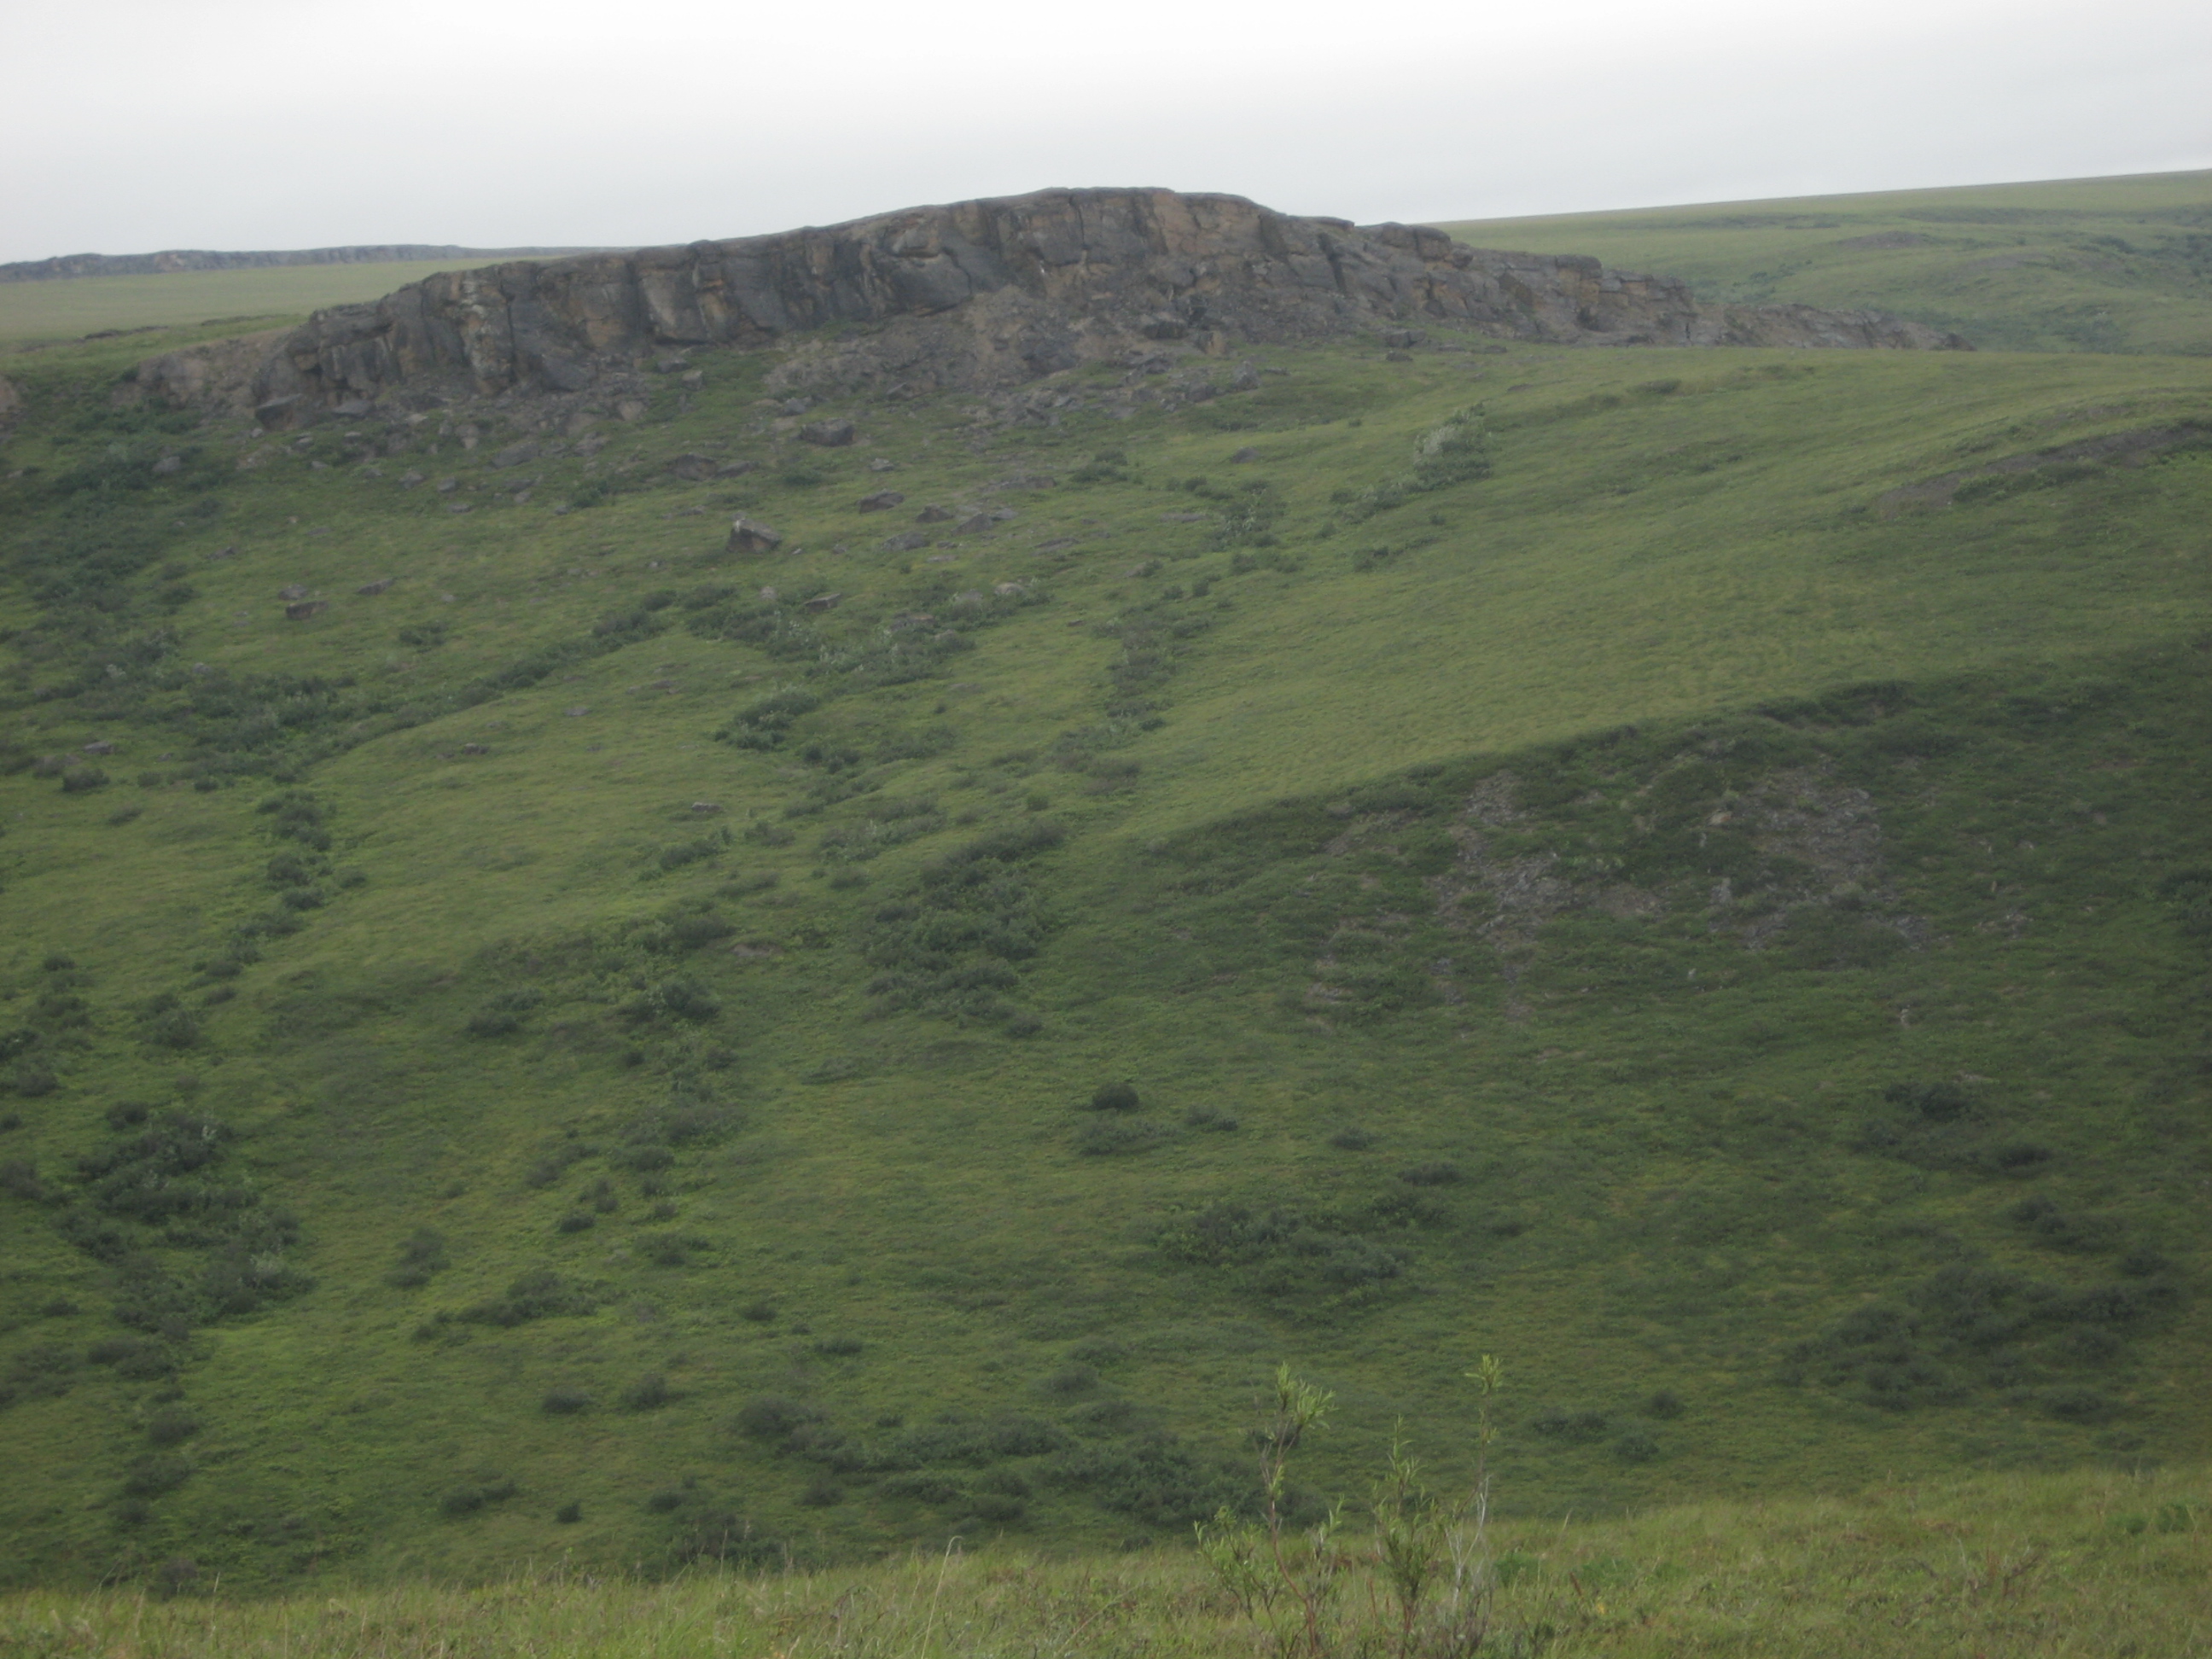
Figure 4. Portion of Colville201014 site.
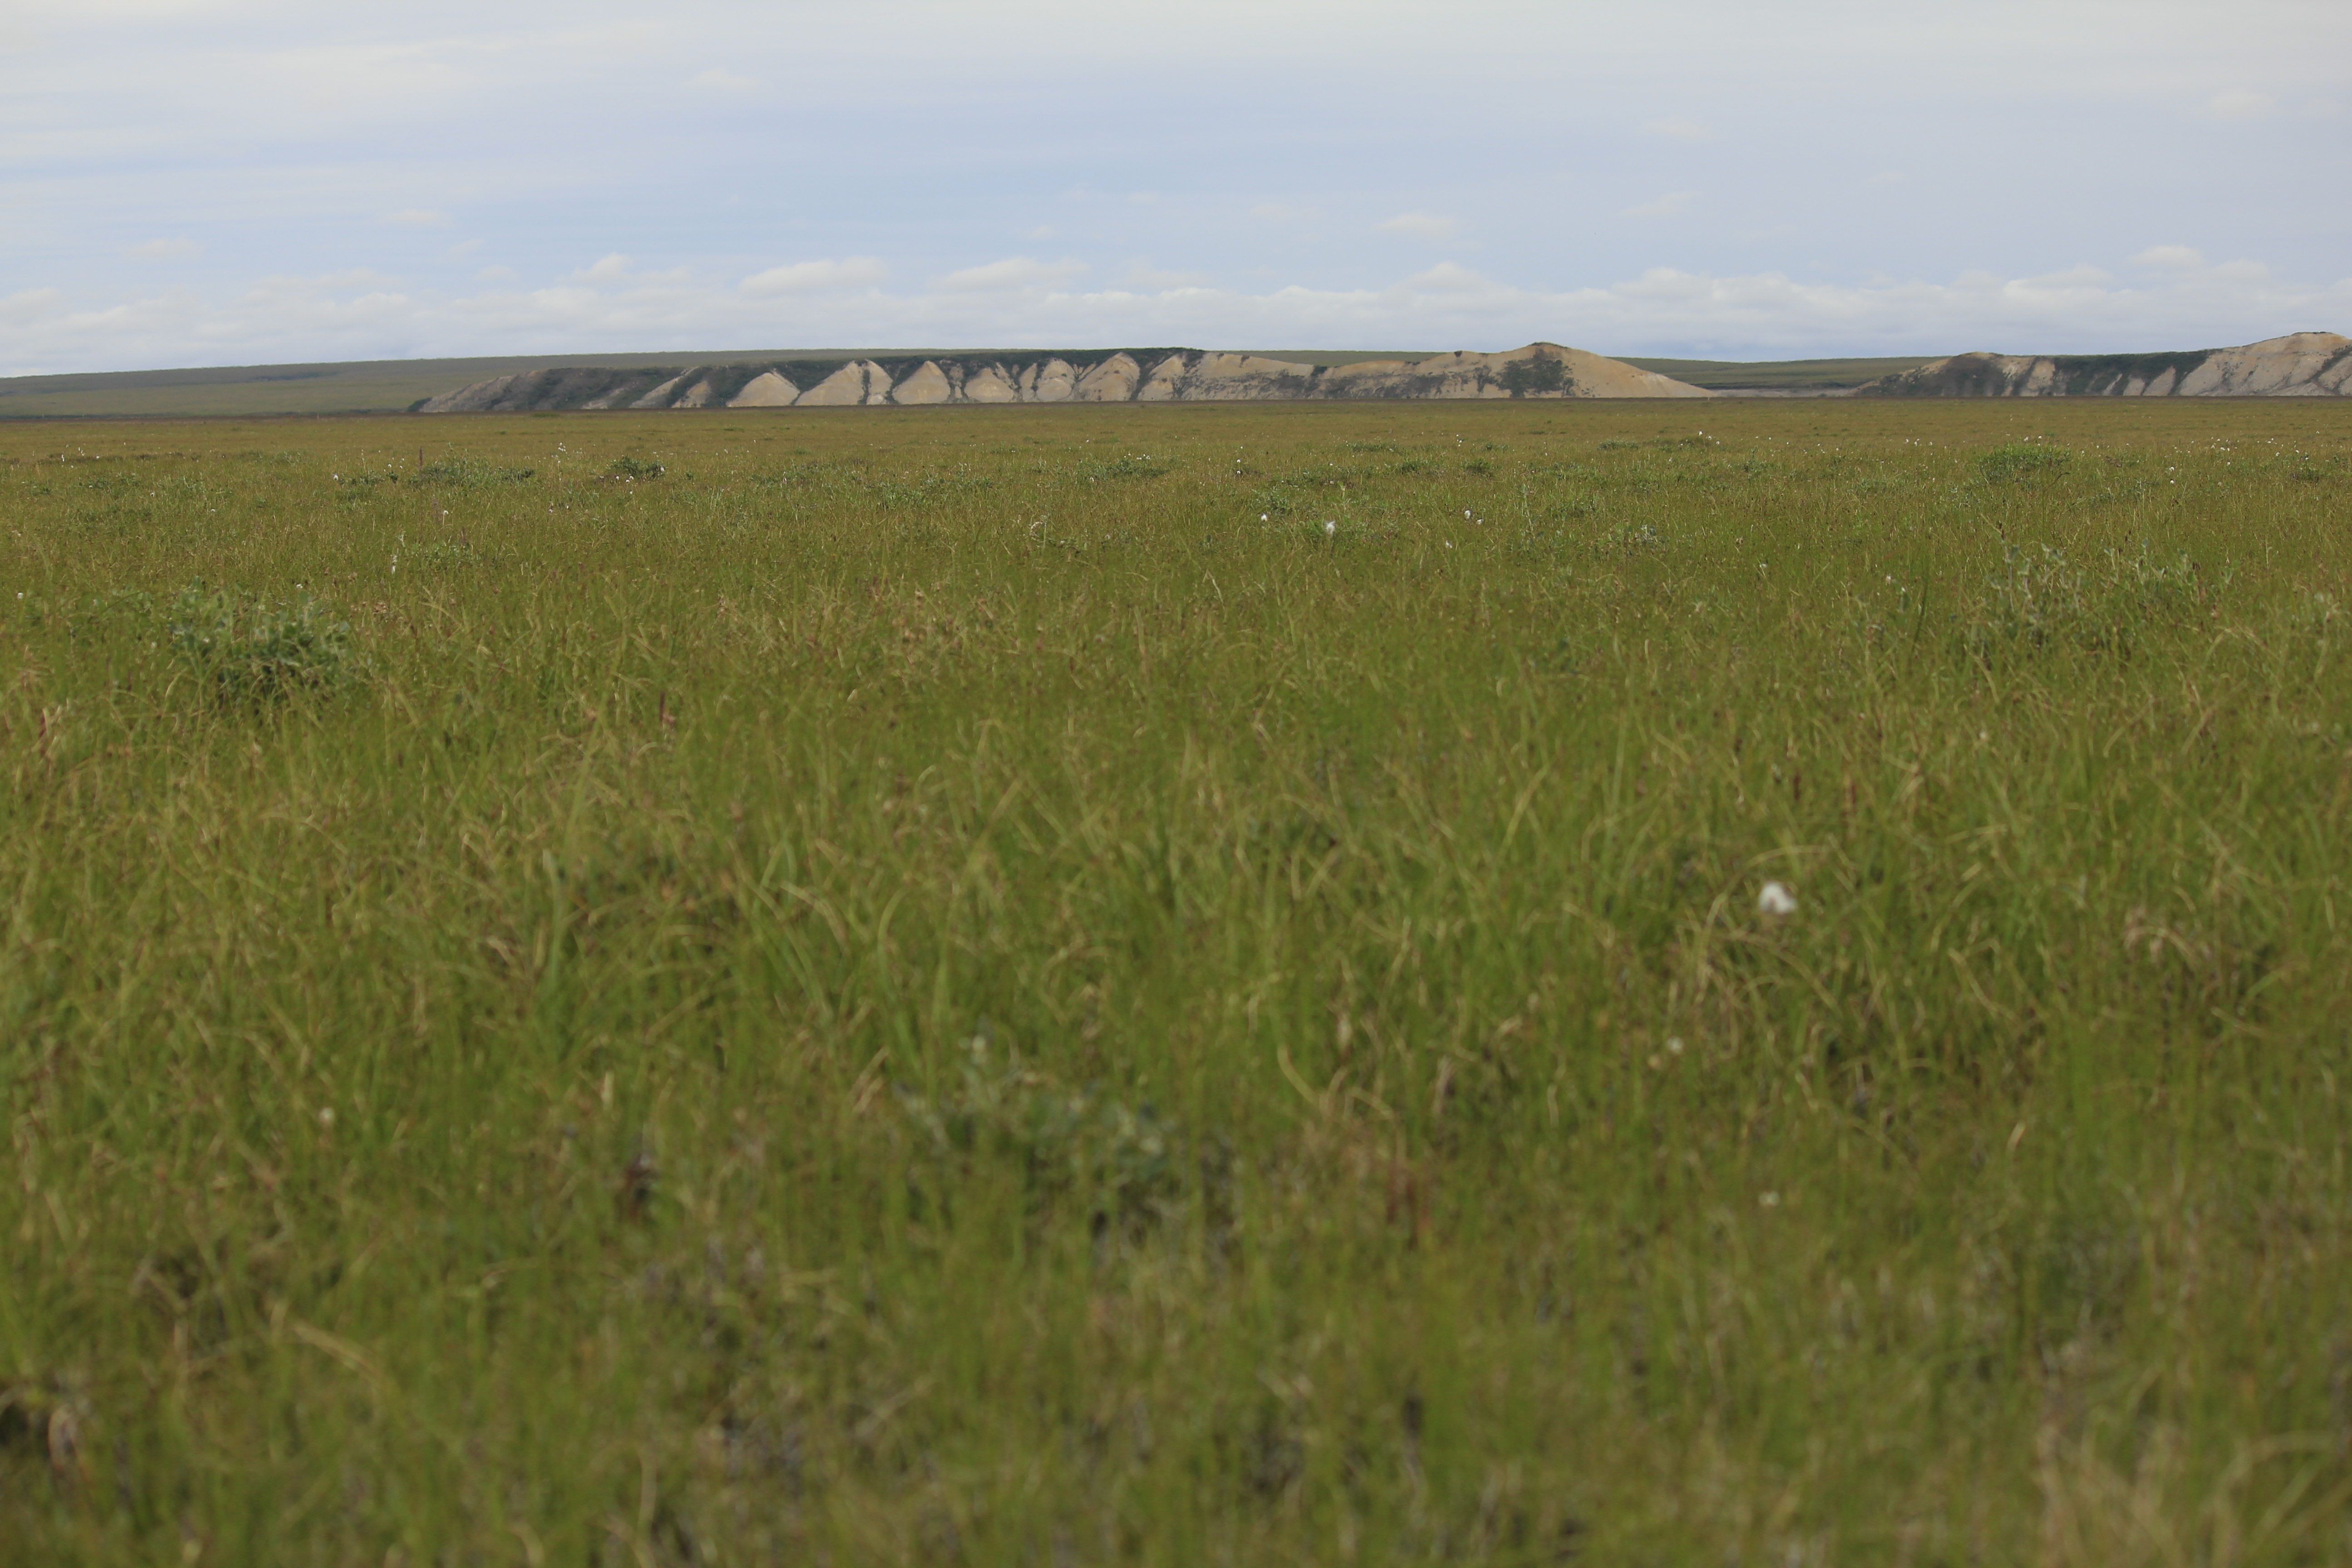
Figure 5. Portion of Dalton201112 site.
Field Sampling and Measurements
The belt-transect method was used to survey 25 out of the 26 field sites. At site Chandler201001, all shrubs across the site were surveyed. Transects were 5-m wide and 250-m long and their number per site varied between 5 and 10 depending on the difficulty of access to the site. The belt transects ran parallel to each other and across the terrain altitudinal gradient (Figure 6).
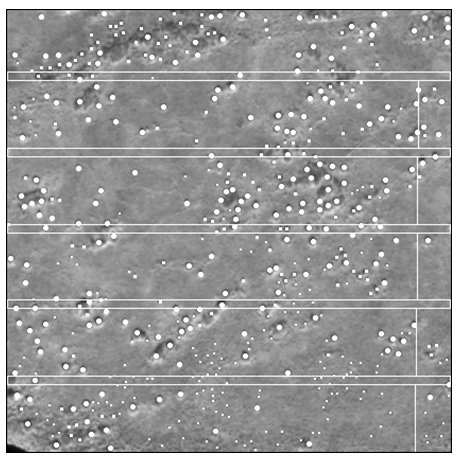
Figure 6. Distribution of five belt transects following a systematic sampling strategy with a randomly selected starting point at field site Colville 201002. White dots represent shrubs observed in the QuickBird panchromatic subset. The sampling site is 250 m x 250 m (62,500 m2). Belt transects are 5-m wide by 250-m long and run perpendicular to the terrain slope.
All shrubs taller than 0.5-m within the belt transects were surveyed by taking its photograph next to a measuring rod and recording its GPS coordinates (Figures 7-9). In the lab, the photographs were calibrated to estimate shrub height, defined as the vertical extent of the shrub and measured from its base to the top of its foliage, and crown radius, defined as the horizontal extent of the canopy and measured from the left-most branch to the right-most branch of the shrub.
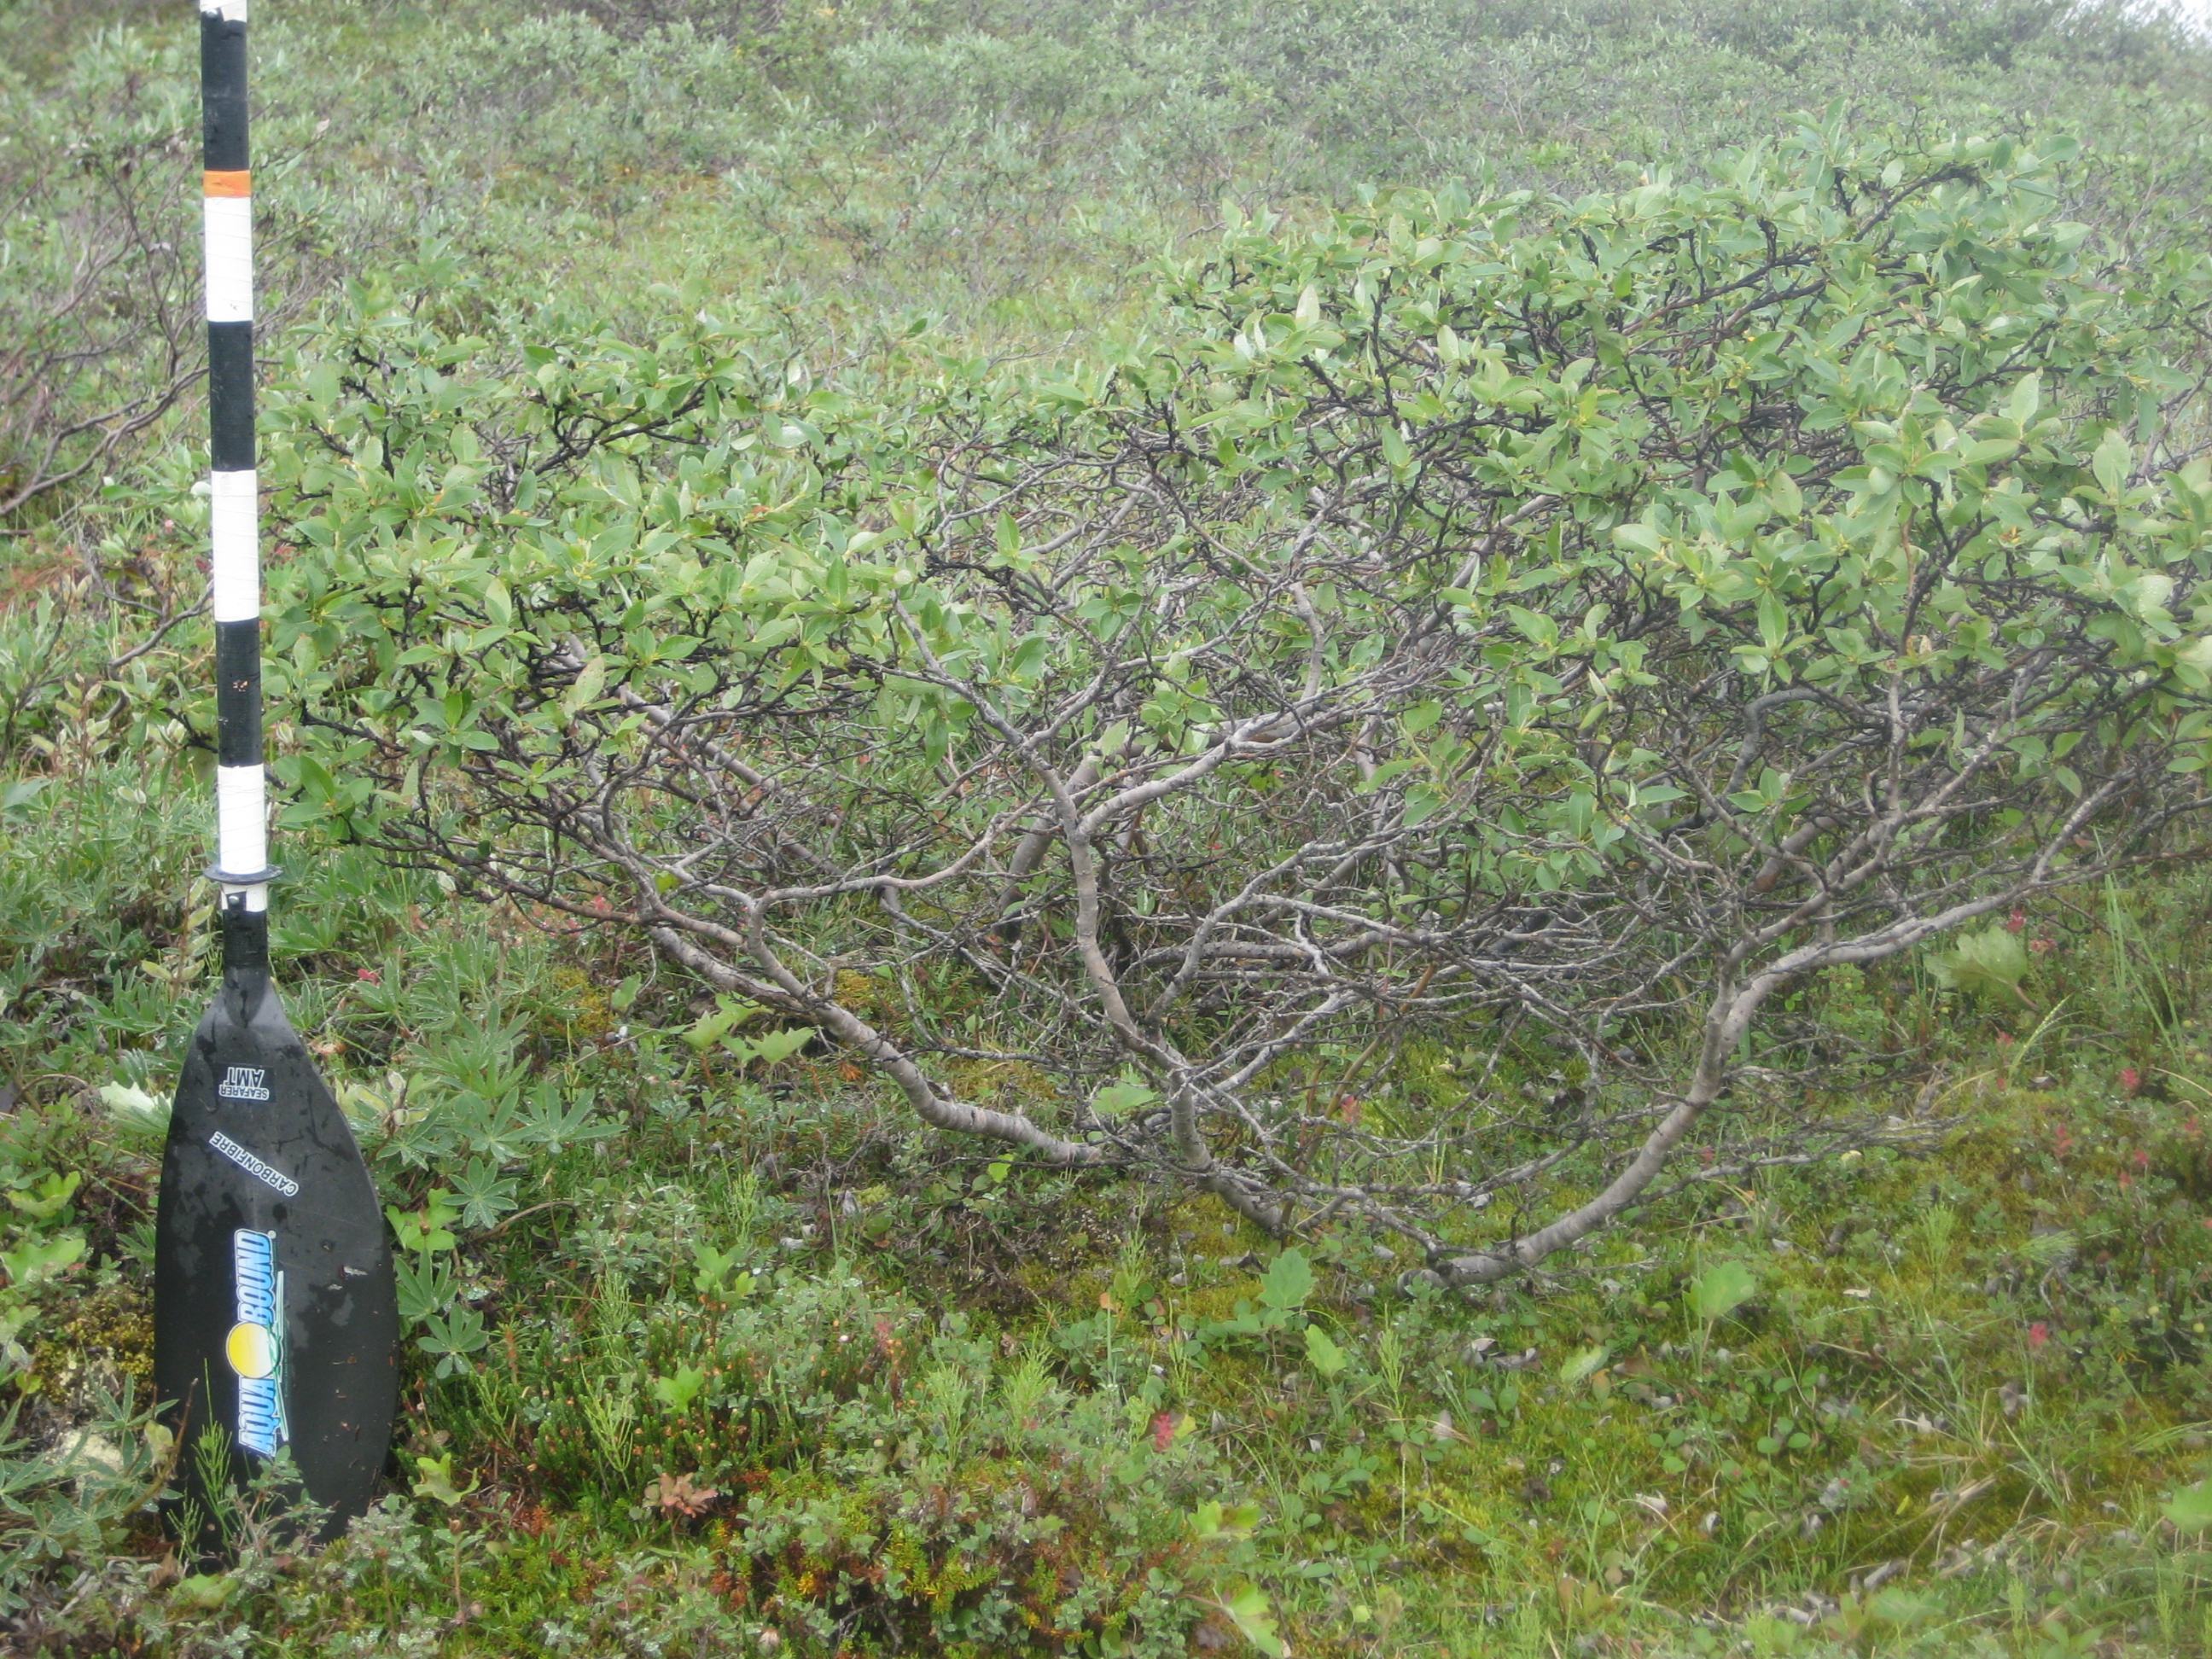
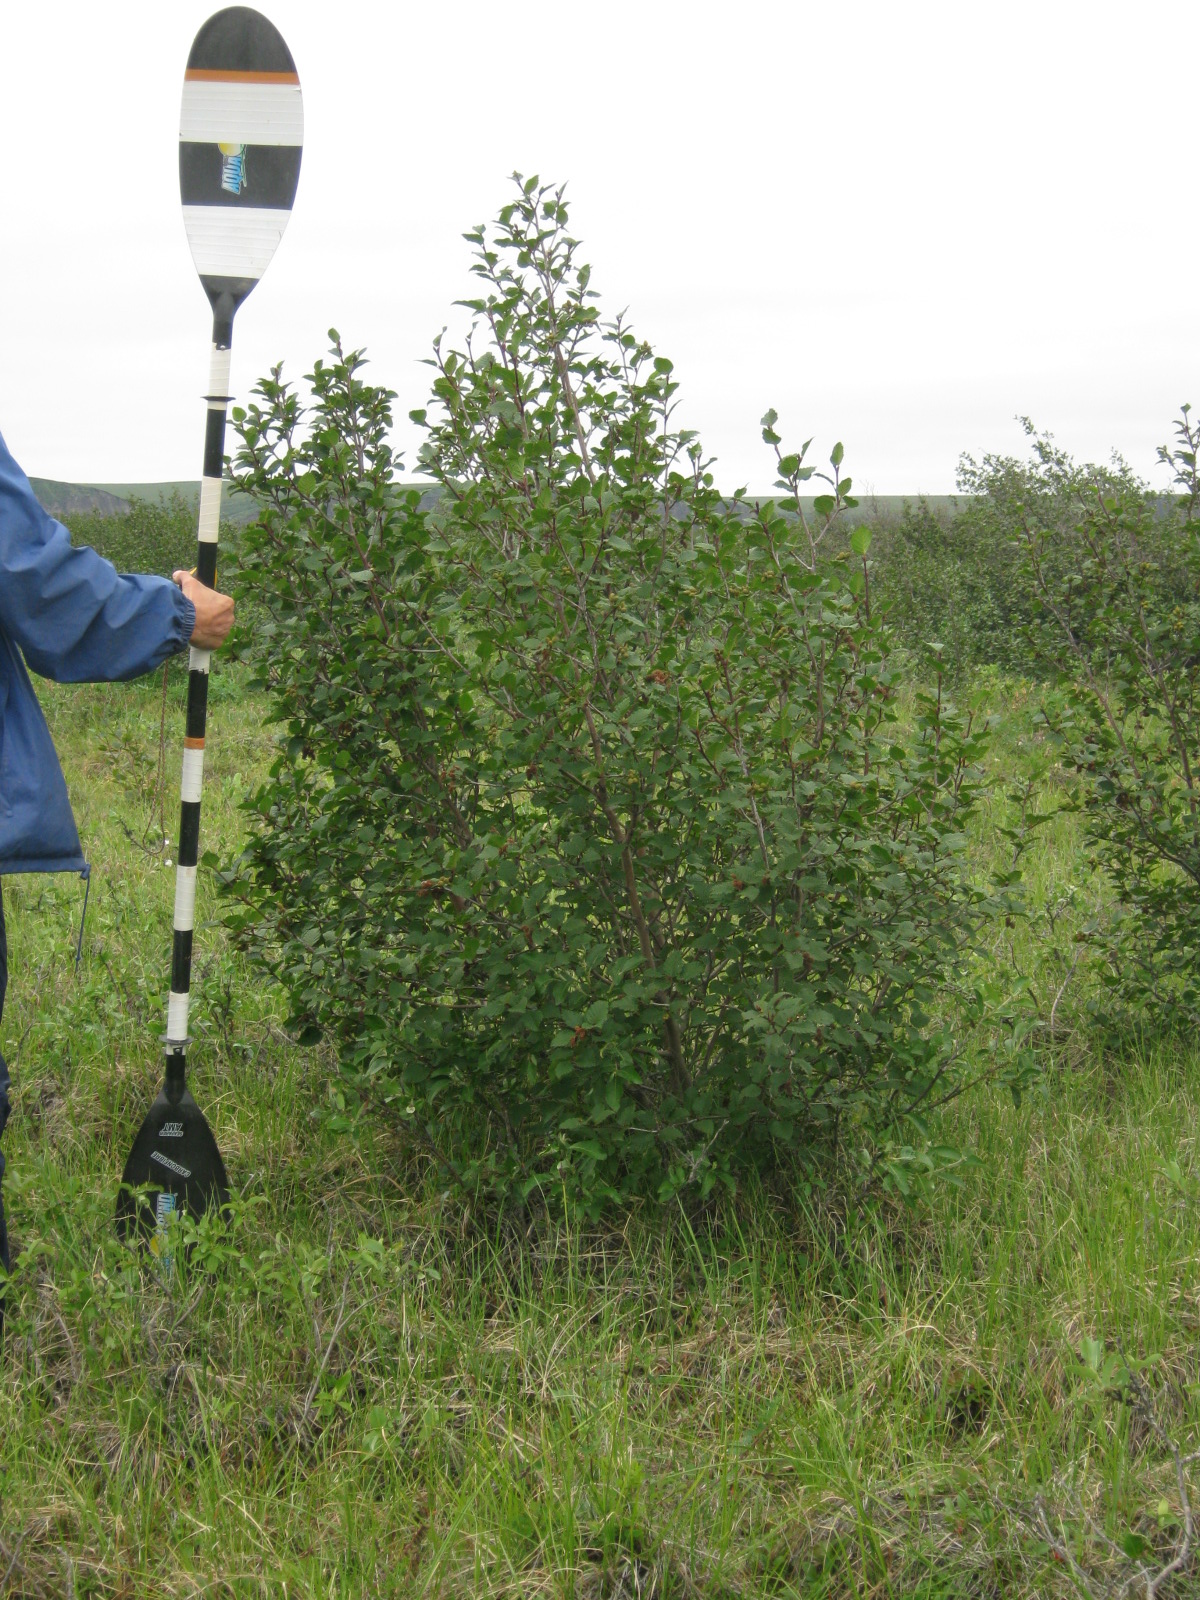
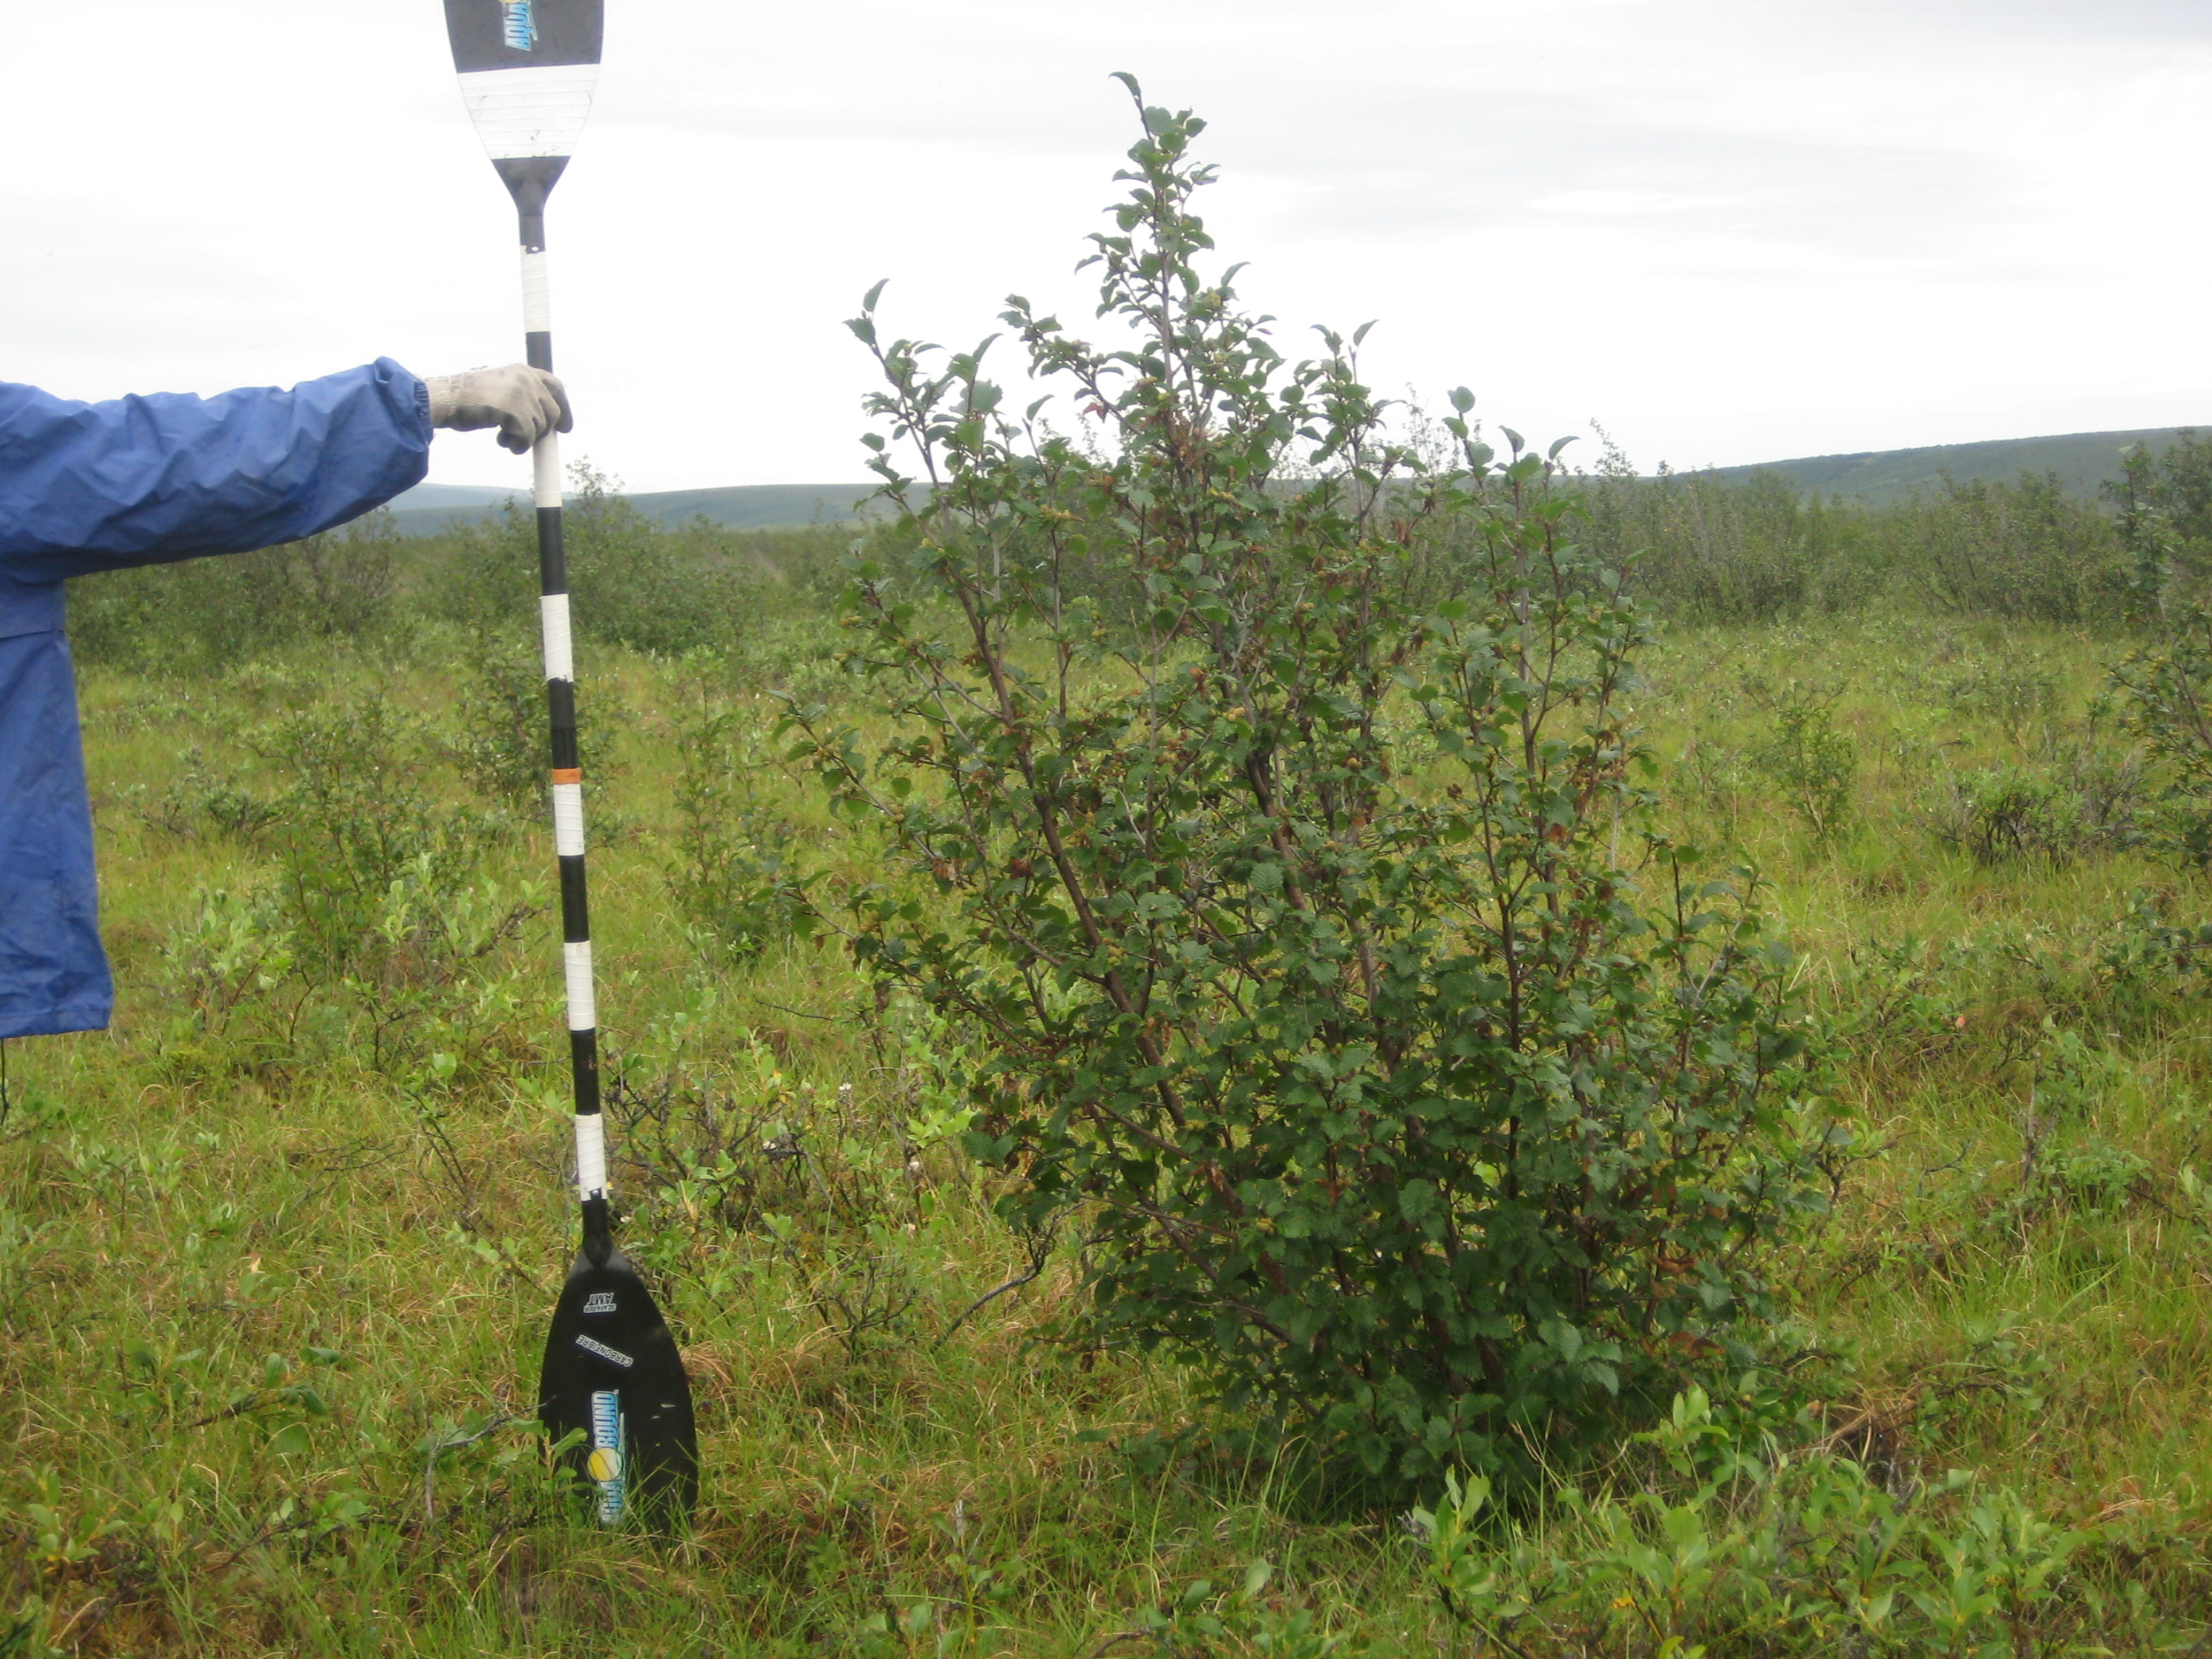
Figures 7-9. Photographs of surveyed shrubs next to the measuring rod at site Colville 201002. From top to bottom: Willow sp., Alder Sp., and Alder Sp.
Field Site Estimates
The total number of shrubs, mean crown radius, mean shrub height, and fractional cover were estimated for each field site from the survey measurements.
The total number of shrubs was estimated by counting all surveyed shrubs, within the belt transects, sampled at each site.
Mean crown radius was estimated using only those observations where individual shrubs were clearly delimited. For that estimate, clusters of shrubs where not included in the analysis because the boundaries of the shrubs could not be identified. Mean shrub height was estimated using all the observations, both individual and clusters of shrubs.
Fractional cover was estimated by dividing the “sum of all shrub crown area” by the area of the belt transects sampled at each site. To calculate the sum of all crown area, both surveyed individual shrubs and clusters of shrubs were included; a cluster was considered one observation. Since the belt width was 5 m, individual shrubs and clusters that exceeded 5-m wide were adjusted to the maximum width of the belt transect.
CANAPI Shrub Estimates for Field Sites
The high resolution image-based shrub estimates for the field sites were obtained using the CANAPI algorithm in conjunction with high resolution panchromatic scenes for the North Slope of Alaska. Some scenes were purchased for the project while others were accessed through the National Geospatial-Intelligence Agency Commercial Archive Data site (http://cad4nasa.gsfc.nasa.gov/) that provides access for NASA Earth Science Investigators. CANAPI is a user-tunable algorithm that uses high resolution panchromatic imagery to identify and measure tree or shrub crowns and heights via estimating the length of the shadow cast (Chopping, 2011).
CANAPI estimates for the Arctic woody vegetation present some departures from the field site estimates which are based on the survey measurements. For instance, CANAPI tends to underestimate fractional cover when there are clusters of shrubs present in the scene because it is unable to identify individual shrubs. Where vegetation is sparse, CANAPI estimates are very close to field data. Similar behavior occurred for the total number of shrub estimates. On the other hand, mean crown radius CANAPI estimates are often lower in comparison with the field estimates.
Adjustment of CANAPI Estimates
In order to adjust the CANAPI estimates of fractional cover, mean crown radius, mean height, and total number of shrubs, regression coefficients were derived by finding the relations between the CANAPI estimates and the corresponding field estimates via simple linear regressions, for 26 field sites. Outliers were omitted from the analysis.
- High R2 values for fractional cover and mean crown radius (0.83 and 0.80 respectively) suggest that it is appropriate to use the regression coefficients to adjust CANAPI estimates (Figures 10 a and b).
- Since the regression for total number of shrubs had a medium R2 (0.54), using the regression equation to adjust CANAPI estimates must be done with caution (Figure 10 c).
These regression coefficients were used to adjust new CANAPI estimates obtained for 1,013 sites across the North Slope of Alaska.
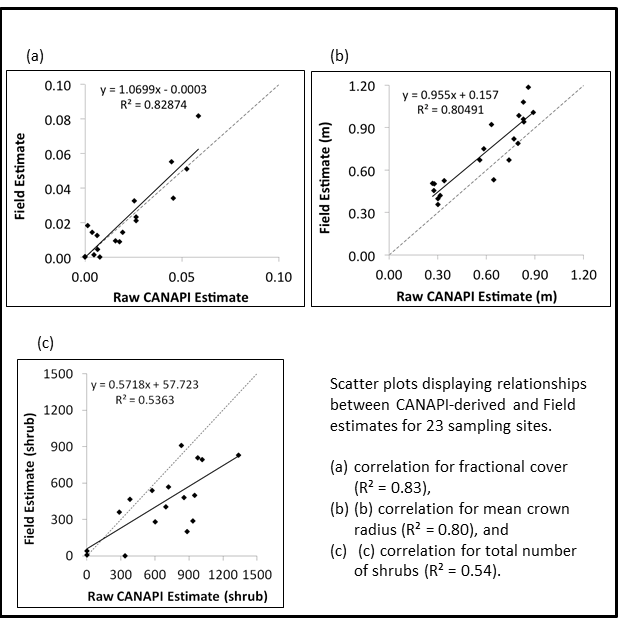
Figure 10. Scatter plots displaying relationships between CANAPI-derived and field estimates for 26 sampling sites.
Expansion of Tall Shrub Characteristics Reference Database
A total of 1,013 sites of 250 x 250-m were selected across North Slope. Sites were explicitly chosen to include representatives from all four physiognomic vegetation classes present in the region (CAVM Team, 2003) and from across the broad latitudinal and longitudinal range of the North Slope (Figure 1). The selection depended first on the availability of high resolution imagery, and then, on a visual assessment of the area to select sites with different degrees of cover from each physiognomic vegetation class.
The CANAPI algorithm was used to obtain total number of shrubs, fractional cover, and mean crown radius estimates for the new 1,013 sites. The estimates were later adjusted using the regression equations obtained in the previous step above. Together, the field measurements and image-based CANAPI estimates allowed the construction a robust and extensive data resource of tall shrub characteristics at 1,039 tundra sites.
Descriptions of the sites sampled using the CANAPI-based algorithm include coordinates for the central point of each site. This information is provided in the canapi_estimates.csv data file.
For the 1,013 new sites, the distribution of the Total Number of Shrubs and the Fractional Cover CANAPI estimates is skewed to the left and therefore the five-number summary is a better measurement of center and spread. In the case of the Mean Crown Radius CANAPI estimates, the values follow a normal distribution and for that reason the mean and the standard deviation are better measurements of center and spread.
Table 7. Fractional Cover and Mean Crown Radius Summary Statistics
| Total Number of Shrubs | Fractional Cover | Mean Crown Radius | |
|---|---|---|---|
| Minimum | 58 | 0.000 | n.a. |
| First Quartile | 166 | 0.006 | n.a. |
| Median | 292 | 0.016 | n.a. |
| Third Quartile | 611 | 0.044 | n.a. |
| Maximum | 1794 | 0.399 | n.a. |
| Mean | n.a. | n.a. | 0.832 m |
| Standard Deviation | n.a. | n.a. | 0.163 m |
CANAPI Model and Software Requirements
A copy of the CANAPI model (Chopping M., 2011) is also provided. The file is named CANAPI_AK.txt. This model was developed by Mark Chopping and requires significant user input to obtain reasonable results.
- Any AK-specific modifications where done on a site by site basis. That means that the original code was the same, but the settings were adjusted for each site according to the needs.
- In the particular case of identifying shrubs in the Arctic, CANAPI works best with sub-meter high resolution panchromatic imagery (i.e., GeoEye and Quickbird).
CANAPI requires input information from the high resolution imagery to be used with it including:
- Spatial resolution in meters
- Solar elevation angle in degrees at the time the image was acquired
- Rotation angle so that the shadows cast by the objects face south
Other settings that are necessary to define are:
- Saturation percentage for image contrast stretch (usually set to 1 but can be larger)
- Lower threshold for sunlit crown isolation (16-bit) (values can range from 50,000 to 65,535)
- Iterations of the watershed algorithm (usually set to 1)
- Particle Analyzer minimum size (usually set to 1)
- Particle Analyzer maximum size (values can range from 75 to 100)
- Radius for median filter (usually set to 1 or 2)
- Limit crown radius maximum, in pixels (for shrubs, it is recommended values less than 5)
- Limit crown area minimum in square pixels (usually set to 1)
- Upper threshold for shadow isolation (usually set to 70 but it could be higher)
- Limit shadow length in meters (for shrubs, a value of 4 works well)
- Convolve matrix (3x3)
Software Requirements:
The CANAPI model runs as a macro in ImageJ v.1.44. The latter is a public domain Java image processing software developed by Wayne Rasband from the National Institute of Mental Health. It is downloadable from http://imagej.nih.gov/ij/index.html.
6. Data Access:
These data are available through the Oak Ridge National Laboratory (ORNL) Distributed Active Archive Center (DAAC)
Data Archive Center:
Contact for Data Center Access Information:
E-mail: uso@daac.ornl.gov
Telephone: +1 (865) 241-3952
7. References:
CAVM Team. 2003. Circumpolar Arctic Vegetation Map. (1:7,500,000 scale), Conservation of Arctic Flora and Fauna (CAFF) Map No. 1. U.S. Fish and Wildlife Service, Anchorage, Alaska. ISBN: 0-9767525-0-6, ISBN-13: 978-0-9767525-0-9
Chopping M. (2011). CANAPI: Canopy Analysis with Panchromatic Imagery. Remote Sensing Letters, 2(1): 21-29. http://dx.doi.org/10.1080/01431161.2010.486805
Denning, A.S., et al. 2005. Science implementation strategy for the North American Carbon Program: A Report of the NACP Implementation Strategy Group of the U.S. Carbon Cycle Interagency Working Group. U.S. Carbon Cycle Science Program, Washington, DC. 68 pp.
Wofsy, S.C., and R.C. Harriss. 2002. The North American Carbon Program (NACP). Report of the NACP Committee of the U.S. Interagency Carbon Cycle Science Program. U.S. Global Change Research Program, Washington, DC. 56 pp.