Get Data
Summary:
This data set is a collection of measurements of carbon dioxide (CO2) and non-CO2 greenhouse gases made across North America by nine independent atmospheric monitoring networks from 2000 - 2009. During this North American Carbon Program (NACP) sponsored activity, data were compiled from the following networks: AGAGE, COBRA, CSIRO, INTEX-A, INTEX B, Irvine Latitude Network, NOAA CMDL, SCRIPPS, and from Stanley Tyler-UC Irvine. The files presented here are the products of merging multiple original measurement results files for selected sites across North America from each monitoring network. See Figure 1. The monitoring networks are described in Table 3. The primary focus of this effort was the compilation of non-CO2 greenhouse gases over North America, but numerous CO2 observations are also included.
The data files for each network are accompanied by detailed readme documentation files prepared by the respective network investigators. Project descriptions, objectives, references, sampling and analysis methods, and data file descriptions are included in these READMEs. Table 1 displays the monitoring network sites, sample types, analytes, and links to the detailed network README files. Network- and laboratory-specific data citations are included in the README documentation and should be used to acknowledge the use of these data as appropriate.
Non-CO2 greenhouse gases (methane (CH4), carbon monoxide (CO), nitrous oxide (N2O)) are a major focus for the NACP (Wofsy and Harriss, 2002). Rising levels of CH4 and N2O together account for almost half of the radiative forcing due to CO2; CO is a tracer for CO2 emitted from mobile sources and biomass fires (e.g. Gerbig et al. 2003; Geels et al., 2004) and CO data help define factors influencing tropospheric ozone (O3), another key contributor to radiative forcing. This synthesis project brought together data for CH4, CO, and N2O generated in the broad range of relevant research programs ongoing in the NACP.
The data files for each monitoring network and each sampling type (continuous or flasks) have been combined into one compressed (*.zip) file along with the detailed README document. There are 17 compressed files that when expanded contain data files which represent one year’s data for that specific campaign and sampling method. The number of annual files that were compiled from a network into this collection varies. See Tables 1 and 2.
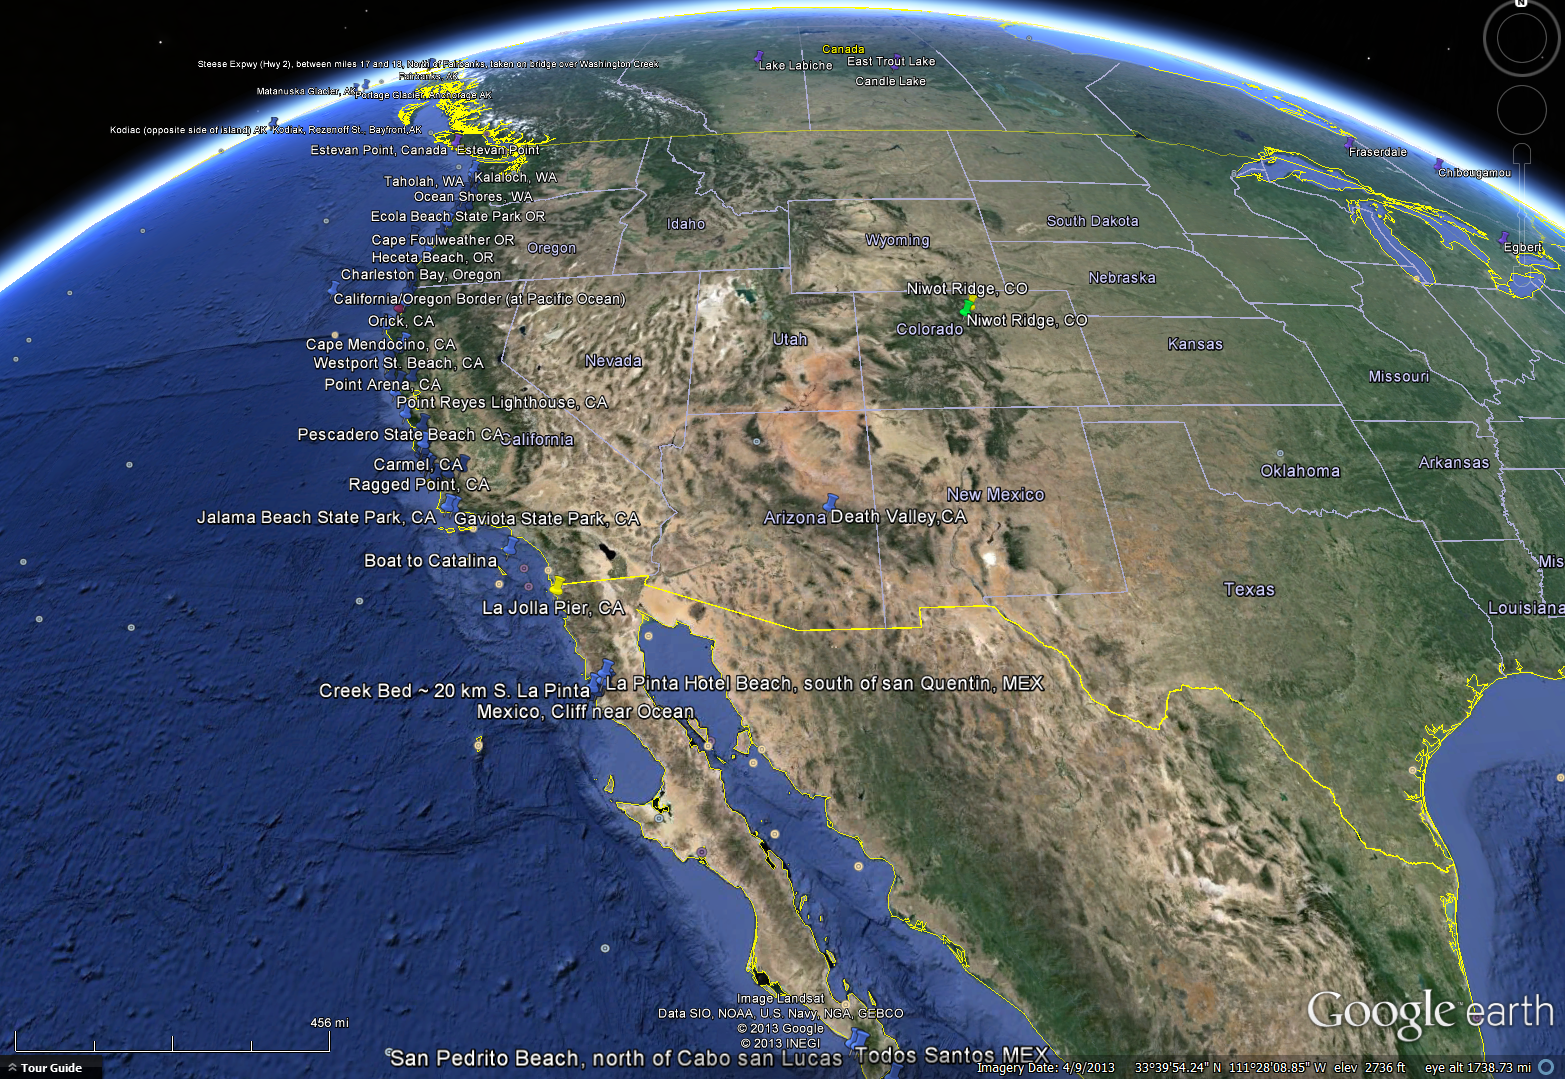
Figure 1. The data included here are from these selected sites across North America from the identified monitoring networks. It is difficult to capture all of the sites in one image. Please use the source file for this image, NACP_GHG_Data_Compilation_Sites.kml, which is provided as a companion file. Also, the coordinates for each site are provided in the NACP_GHG_Data_Compilation_Sampling_Locations.csv companion file.
Data and Documentation Access:
Get Data: http//:daac.ornl.gov/cgi-bin/dsviewer.pl?ds_id=1206
Supplemental Information:
- Coordinates for each site are provided in the NACP_GHG_Data_Compilation_Sampling_Locations.csv companion file.
- The interactive file of sampling locations, NACP_GHG_Data_Compilation_Sites.kml, is provided as a companion file.
Data Citation:
Cite this data set as follows:
Wofsy, S.C. and A. Dayalu. 2014. NACP Greenhouse Gases Multi-Source Data Compilation, 2000-2009. Data set. Available on-line [http://daac.ornl.gov] from Oak Ridge National Laboratory Distributed Active Archive Center, Oak Ridge, Tennessee, USA. http://dx.doi.org/10.3334/ORNLDAAC/1206
Additional citations:
Network- and laboratory-specific citations are included in the detailed README documentation files prepared by the respective network investigators. Please include these citations as appropriate.
Table of Contents:
- 1 Data Set Overview
- 2 Data Description
- 3 Applications and Derivation
- 4 Quality Assessment
- 5 Acquisition Materials and Methods
- 6 Data Access
- 7 References
1. Data Set Overview:
Project: North American Carbon Program (NACP)
The North American Carbon Program (NACP) (Denning et al., 2005; Wofsy and Harriss, 2002) is a multidisciplinary research program to obtain scientific understanding of North America's carbon sources and sinks and of changes in carbon stocks needed to meet societal concerns and to provide tools for decision makers. Successful execution of the NACP has required an unprecedented level of coordination among observational, experimental, and modeling efforts regarding terrestrial, oceanic, atmospheric, and human components. The project has relied upon a rich and diverse array of existing observational networks, monitoring sites, and experimental field studies in North America and its adjacent oceans. It is supported by a number of different federal agencies through a variety of intramural and extramural funding mechanisms and award instruments.
This data set is a collection of measurements of CO2 and non-CO2 greenhouse gases made across North America by nine independent atmospheric monitoring networks from 2000 - 2009. During this NACP sponsored activity, data were compiled from the following networks: AGAGE, COBRA, CSIRO, INTEX-A, INTEX B, Irvine Latitude Network, NOAA CMDL, SCRIPPS, and from Stanley Tyler-UC Irvine. The files presented here are the products of merging multiple original measurement results files for selected sites across North America from each monitoring network.
Table 1. List of monitoring networks, sampling sites, sample types, analytes with years collected, and links to the detailed network README files.
| Network | Sites | Sample Type | CO2 | CO | CH4 | N2O | Halocarbons | Other Hydrocarbons | Other | Readme |
|---|---|---|---|---|---|---|---|---|---|---|
| AGAGE | Trinidad Head, CA Ragged Point, Barbados | Ground- based continuous | 2000-2009 | 2000-2009 | 2000-2009 | SF6 SO2F2 TCE |
README_agage.txt | |||
| CSIRO | Alert, Canada Mauna Loa, HI Estevan Point, Canada | Ground-based flasks | 2000-2001 | 2000-2001 | 2000-2001 | H2 dC13 in CO2 | README_CSIRO_flasks.txt | |||
| Tyler- UCI Flask Data | Montana del Oro State Park, CA Niwot Ridge, CO | Ground-based flasks | README_TYLER_UCI_flasks.txt | |||||||
| Irvine Latitude Network | Network has an approximate latitudinal range of -47 to 71 degrees. Data included are North American sites, Alaska through Baja California, and Hawaii. *** | Ground-based flasks | 2000-2001 | 2000-2001 | 2000-2001 | README_irvinelatnet_flasks.txt | ||||
| NOAA | Pt. Barrow, AK, Niwot Ridge, CO Mauna Loa, HI | Ground-based flasks | 2000-2008 | 2000-2008 | 2000-2008 | 2000-2008 | 2000-2008 |
H2 dC13 in CO2
dC14 in CO2 dO18 in CO2 | README_noaa_flasks.txt | |
| NOAA | Pt. Barrow, AK, Niwot Ridge, CO Mauna Loa, HI | Ground-based continuous | 2000-2008 | 2000-2008 | 2000-2008 | 2000-2008 | 2000-2008 | SF6 | README_noaa_continuous.txt | |
| SCRIPPS |
Barrow, AK Mauna Loa, HI
Cape Kumukahi, HI La Jolla Pier, CA Alert, NWT, Canada |
Ground-based flasks | 2000-2001 | README_scripps.txt | ||||||
| WMO-EnvCanada |
Alert Canada
Estevan Point Sable Island | Ground-based flasks | 2000-2008 | 2000-2008 | 2000-2008 | README_wmo_canada_flask.txt | ||||
| WMO-EnvCanada |
Alert Canada
Candle Lake East Trout Lake Egbert Canada Fraserdale Sable Island Chibougamou Lake Labiche |
Ground-based continuous | 2000-2008 | 2000-2008 | 2000-2008 | README_wmo_canada_continuous.txt | ||||
| COBRA | Continental US and southern Canada | Aircraft- based flask | 2003-2004 | 2003-2004 | 2003-2004 |
d13C CO2
d18O in N2O H2 H2O O2:N2 SF6 | README_cobra_2003_flask.txt | |||
| COBRA | Continental US and southern Canada | Aircraft- based continuous | 2003-2004 | 2003-2004 | H2O | README_cobra_2003.txt and README_cobra_2004.txt | ||||
| INTEX-A and B | INTEX-A (2004) central and eastern United States; INTEX-B (2006) west coast US, Mexico City, and out in the Pacific region toward Asia. |
Aircraft- based flask and continuous | 2004-2006 | 2004-2006 | 2004-2006 | 2004-2006 | 2004-2006 | COS H2O H2O2 NO O3 Ca, Cl, K, Mg, Na,NO3, NH4, SO4 Aerosol density and surface area |
README_intex-a_dc8_2004_continuous.txt, README_intex-a_dc8_2004_flask.txt, README_intex-b_2006_c130_continuous.txt, README_intex-b_2006_c130_flask.txt, README_intex-b_2006_dc8_continuous.txt, and README_intex-b_2006_dc8_flask.txt |
*** Irvine Latitude Network Sites
Kauai, HI Punta Baja, CA Barrow Weather Station (NOAA), AK Bodega Bay, CA WashingtonCreek,Fairbanks, AK Portage Glacier, Anchorage, AK Fort Abercrombie State Park, Kodiak, AK Pololu Valley, HI Yaquina Head Lighthouse Newport, OR Julia Pfieffer State Beach, CA |
San Simeon, CA Todos Santos, CA (23.44,-110.24) Upolu Airport, Big Isle, HI Piedras Blancas, CA Point Reyes Lighthouse, CA Hawaii Cabo San Lucas, MX Cape Blanco Lighthouse, OR La Pinta Hotel Beach, south of San Quentin, CA Ocean Shores, WA |
Jalama Beach State Park,CA Ocean City Beach, WA MacKerricher State Park, Fort Bragg, CA Trinidad State Beach, CA Illwaco Beach, WA Point Arena, CA Cape Mendocino, CA Lihue, HI Ragged Point, CA Klamath, CA |
2. Data Characteristics:
The data files for a monitoring network and sampling type (continuous or flasks) are combined in one compressed (*.zip) file along with the detailed README document. There are 17 compressed files that when expanded contain data files which represent one year’s data for that specific campaign and sampling method. The number of annual files that were compiled from a network into this collection varies.
Table 2. Compressed file names and included network data files.
| Network | Compressed File Names | Data File Names | README |
|---|---|---|---|
| AGAGE | agage_continuous.zip |
agage_2000_continuous.csv agage_2001_continuous.csv agage_2002_continuous.csv agage_2003_continuous.csv agage_2004_continuous.csv agage_2005_continuous.csv agage_2006_continuous.csv agage_2007_continuous.csv agage_2008_continuous.csv agage_2009_continuous.csv |
README_agage.txt |
| CSIRO | csiro_flasks.zip |
csiro_2000_flask.csv csiro_2001_flask.csv |
README_CSIRO_flasks.txt |
| Tyler-UCI Flask Data | tyler_flasks.zip |
tyler_flask_2000.csv tyler_flask_2001.csv |
README_TYLER_UCI_flasks.txt |
| Irvine Latitude Network | irvinelatnet_flasks.zip |
irvinelatnet_2000_flasks.csv irvinelatnet_2001_flasks.csv irvinelatnet_2002_flasks.csv irvinelatnet_2003_flasks.csv irvinelatnet_2004_flasks.csv irvinelatnet_2005_flasks.csv irvinelatnet_2006_flasks.csv irvinelatnet_2007_flasks.csv irvinelatnet_2008_flasks.csv |
README_irvinelatnet_flasks.txt |
| NOAA |
noaa_flasks.zip noaa_continuous.zip |
noaa_2000_flasks.csv noaa_2001_flasks.csv noaa_2002_flasks.csv noaa_2003_flasks.csv noaa_2004_flasks.csv noaa_2005_flasks.csv noaa_2006_flasks.csv noaa_2007_flasks.csv noaa_2008_flasks.csv noaa_2000_continuous.csv noaa_2001_continuous.csv noaa_2002_continuous.csv noaa_2003_continuous.csv noaa_2004_continuous.csv noaa_2005_continuous.csv noaa_2006_continuous.csv noaa_2007_continuous.csv noaa_2008_continuous.csv |
README_noaa_flasks.txt and README_noaa_continuous.txt |
| SCRIPPS | scripps_flasks.zip |
scripps_2000_flasks.csv scripps_2001_flasks.csv |
README_scripps.txt |
| WMO-EnvCanada |
wmo_canada_flasks.zip wmo_canada_continuous.zip |
wmo_canada_2000_flasks.csv wmo_canada_2001_flasks.csv wmo_canada_2002_flasks.csv wmo_canada_2003_flasks.csv wmo_canada_2004_flasks.csv wmo_canada_2005_flasks.csv wmo_canada_2006_flasks.csv wmo_canada_2007_flasks.csv wmo_canada_2008_flasks.csv wmo_canada_2000_continuous.csv wmo_canada_2001_continuous.csv wmo_canada_2002_continuous.csv wmo_canada_2003_continuous.csv wmo_canada_2004_continuous.csv wmo_canada_2005_continuous.csv wmo_canada_2006_continuous.csv wmo_canada_2007_continuous.csv wmo_canada_2008_continuous.csv |
README_wmo_canada_flask.txt README_wmo_canada_continuous.txt |
| COBRA |
cobra_flasks.zip cobra_continuous.zip |
cobra_2003_flasks.csv cobra_2003_continuous.csv cobra_2004_continuous.csv |
README_cobra_2003_flask.txt README_cobra_2003.txt README_cobra_2004.txt |
| INTEX-A and B |
intex-a_dc8_2004_flasks.zip intex-a_dc8_2004_continuous.zip intex-b_2006_c130_flasks.zip intex-b_2006_c130_continuous.zp intex-b_2006_dc8_flasks.zip intex-b_2006_dc8_continuous.zip |
intex_a_dc8_2004_flasks.csv intex_a_dc8_2004_continuous.csv intex_b_c130_2006_flasks.csv intex_b_c130_2004_continuous.csv intex_b_dc8_2006_flasks.csv intex_b_dc8_2006_continuous.csv |
README_intex-a_dc8_2004_flask.txt README_intex-a_dc8_2004_continuous.txt README_intex-b_2006_c130_flask.txt README_intex-b_2006_c130_continuous.txt README_intex-b_2006_dc8_flask.txt README_intex-b_2006_dc8_continuous.txt |
Data File Organization:
Each data file represents one year’s data for the specific campaign with flask and continuous data from airborne campaigns in separate files.
- File organization and variables measured vary across campaigns. During the compilation process, no attempt was made to harmonize file organization or measurement variable names.
- Table 1 provides an overview of network sampling sites and the years of available data for the main measurement types.
- Details on file organization and variables are provided in the network README files.
- Data files are in comma separated format (*.csv).
- Date and time variables are consistent across all network data files.
- The first three columns are consistent in all files in both name and format.
- YYYYMMDD: Year, month, and day of sampling (UTC)
- doy: Absolute day of year
- UTC: Seconds from midnight of that day. Universal Coordinated Time (UTC)
- The first three columns are consistent in all files in both name and format.
- These sample identification and location variables are consistent across files, depending upon the sample type.
- flask.ID: Canister identification number
- station: NOAA three-letter station code. Three-letter codes assigned for non-NOAA station LJO
- latitude: Latitude, in decimal degrees
- longitude: Longitude, in decimal degrees
- altitude: Altitude, in meters above sea level
- Data quality flags are provided for measurement variables.
- Quality flags follow the NOAA format.
- Data flags (species.flag), if any, are based on the 3-column (…) NOAA flag system. See accompanying network README file for details.
- Missing values.
- Missing values are represented by "NaN".
Example Data File:
|
EXPLANATORY 10 LINE FOR STANLEY TYLER/UCI 2001 FLASK DATA Fair Use Agreement: By using these data you agree to abide by our Fair Use Policy. Refer to the accompanying readme file for more information including how to cite these data. The user of this data is responsible for obtaining the latest data sets. For original data sets and information on updates and citations visit http://cdiac.ornl.gov/epubs/db/db1022/db1022.html Today's date: August 24 2009. Data downloaded from website: August 4 2009 For more information about this data contact Stanley Tyler, styler@uci.edu. "YYYYMMDD","doy","UTC","station","latitude","longitude","altitude","wind.m","wind.d", "CH3D_UCI","SD.CH3D_UCI","CH4_UCI","SD.CH4_UCI","CH4C13_UCI", "SD.CH4C13_UCI","CO_UCI","SD.CO_UCI","COC13_UCI","SD.COC13_UCI" 20010112,12,68400,"NWR",40.05,-105.58,3523,2.7,240,-91.3,2.1,1782.1,NaN,NaN,NaN,NaN,NaN,NaN,NaN 20010112,12,68400,"NWR",40.05, -105.58,3523,2.7,240,NaN,NaN,NaN,NaN,NaN,NaN,111.9,1.1,NaN,NaN 20010117,17,40860,"MDO",35, -121,NaN,8.5,280,NaN,NaN,NaN,NaN,NaN,NaN,169.3,0,-26.72,0.27 20010117,17,84060,"MDO",35,-121,NaN,8.4,280,-103.9,2.1,1863,6,NaN,NaN,NaN,NaN,NaN,NaN 20010126,26,65700,"NWR",40.05, -105.58,3523,2.2,270,-93.8,0,1816.3,NaN,NaN,NaN,NaN,NaN,NaN,NaN 20010126,26,65700,"NWR",40.05, -105.58,3523,2.2,270,NaN,NaN,NaN,NaN,NaN,NaN,129.9,1,NaN,NaN 20010205,36,46560,"MDO",35, -121,NaN,2.2,300,NaN,NaN,NaN,NaN,NaN,NaN,180.1,0,-27.12,1.05 20010205,36,89760,"MDO",35,-121,NaN,2.2,300, -98.8,1.6,1826,5,NaN,NaN,NaN,NaN,NaN,NaN … |
Site Boundaries: (All latitude and longitude given in decimal degrees)
| Site (Region) | Westernmost Longitude | Easternmost Longitude | Northernmost Latitude | Southernmost Latitude |
|---|---|---|---|---|
| Overall North American area for data compilation | -165.4 | -59.4167 | 82.47 | 13.1667 |
Site locations: See companion file with individual network sampling site locations:
NACP_GHG_Data_Compilation_Sampling_Locations.csv
Location Note: : In the Irvine Latitude Network, the Death Valley, CA site location is incorrect (in Arizona). These samples were grab samples and not from an established station. The coordinates provided are as reported in the README and no other information is available. Approximate Death Valley, CA coordinates from another source: 36.246944, -116.816944.
Time period: The data set covers the period 2000/01/01 to 2009/12/31
3. Data Application and Derivation:
This data collection can be used in conjunction with modeling efforts to produce better quantitative knowledge of greenhouse gas sources in North America. See Miller et al. 2013 for a related application.
4. Quality Assessment:
Data flags are included in most of the data files with codes that will denote specific concerns for each measurement type. The specific codes are included in the associated README files. In addition, the methods section of the associated readme files includes details on method precision and quality control protocols for each campaign.
5. Data Acquisition Materials and Methods:
This data set is a collection of measurements of carbon dioxide (CO2) and several non-CO2 greenhouse gases made across North America by nine independent atmospheric monitoring networks from 2000 - 2009. Data were collected by the following networks: AGAGE, COBRA, CSIRO, INTEX-A, INTEX B, Irvine Latitude Network, NOAA CMDL, SCRIPPS, and from Stanley Tyler-UC Irvine. The files presented here are the products of merging multiple original measurement results files for selected sites across North America from each monitoring network. The primary focus of this effort was the compilation of non-CO2 greenhouse gases over North America, but numerous CO2 observations are also included. Figure 2 shows the Google Map representation of the sampling locations.
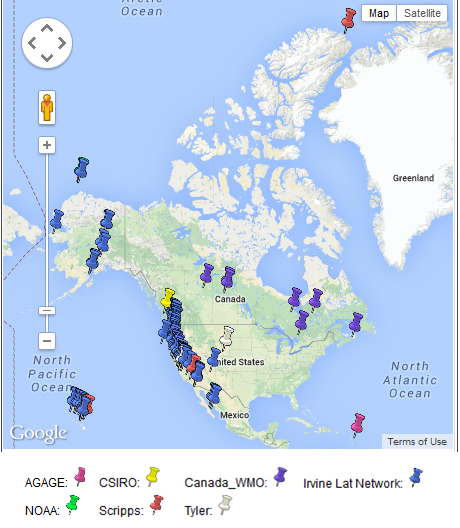
Figure 2. Google Map representation of the ground-based network sampling locations showing the complete geographic range. (source: http://www.nacarbon.org/cgi-bin/google_maps/nonco2_googlemap.pl)
The data files for each network are accompanied by detailed README documentation files prepared by the respective network investigators. Network descriptions, objectives, references, sampling and analysis methods, and data file descriptions are included in these READMEs. This network sampling and analysis information have been summarized in the tables in Tables 3 and 4 below.
Table 3. Includes the common network identifier, the full name, general description, and original source links to data and documentation.
| Network | Name | Description | Source Links |
|---|---|---|---|
| AGAGE | Advanced Global Atmospheric Gases Experiment (AGAGE) | AGAGE and its predecessors have been measuring the composition of the global atmosphere continuously since 1978. The AGAGE is distinguished by its capability to measure over the globe at high frequency almost all of the important gas species in the Montreal Protocol ( e.g. CFCs and HCFCs) to protect the ozone layer and almost all of the significant non-CO2 gases in the Kyoto Protocol (e.g. HFCs, CH4 and N2O to mitigate climate change |
Data link ftp://nacp.ornl.gov/pub/non-CO2_GHG/data/ |
|
Documentation link ftp://nacp.ornl.gov/pub/non-CO2_GHG/data/ |
|||
|
Source links http://agage.eas.gatech.edu/data_archive/agage/gc-ms-medusa/complete/ http://agage.eas.gatech.edu/data_archive/agage/gc-md/complete/ |
|||
| CSIRO | CSIRO Global Atmospheric Sampling Laboratory (GASLAB) Flask Sampling Network. | The CSIRO flask study presents data from 1984 to 2001, based at 9 stationary surface sites and one moving platform. The study traces four crucial gases: CH4, CO2, CO and H2 with a number of daily flask samples each week. The stations span the globe. The data in this dataset focus on the three North American sites in the study and the 2000-2001 time period. |
Data link http://cdiac.ornl.gov/epubs/db/db1021/db1021.html |
|
Documentation link |
|||
|
Source link http://www.marine.csiro.au/marq/edd_search.Browse_Citation?txtSession=8381 |
|||
| Irvine Latitude Network |
Irvine Latitude Network Donald Blake, Department of Chemistry, University of California Irvine |
The network investigates the presence of CH4 , other hydrocarbons, alkyl nitrates and chlorinated carbon compounds throughout the world. The network has an approximate latitudinal range of -47 to 71 degrees. The network takes roughly 80 samples per season over three- week periods in March, June, September and December. Data included here are from the North American sites ( Alaska through Baja California as well as Hawaii) |
Data link http://cdiac.ornl.gov/trends/otheratg/blake/blake.html |
|
Documentation link |
|||
|
Source link http://cdiac.ornl.gov/trends/otheratg/blake/blake.html |
|||
| Tyler-UCI | Contact: Stanley C. Tyler, Department of Earth System Science, University of California Irvine | This study measures CH4 and CO concentrations at two North American sites. Carbon and hydrogen isotopes are also measured. Data here cover the 2000-2001 time period. |
Data link http://cdiac.ornl.gov/epubs/db/db1022/db1022.html |
| Documentation link | |||
|
Source link http://cdiac.ornl.gov/epubs/db/db1022/db1022.html |
|||
| NOAA | Multiple programs | The general mission of the Halocarbons and other Atmospheric Trace Species (HATS) group is to quantify the distributions and magnitudes of sources and sinks for atmospheric nitrous oxide (N2O) and halogen containing compounds. These data represent in-situ measurements from three of NOAA’s ground-based stations in North America. NOAA flask data provide measurements eight species (CH4, N2O, CO, CO2,(C13, C14, O18), H2), drawing samples from ground –based sites as well as aircraft. | Data link |
| Documentation link | |||
|
Source link http://www.esrl.noaa.gov/gmd/dv/data/ HATS data http://www.esrl.noaa.gov/gmd/hats/insitu/cats/cats_conc.html CH4 continuous data http://www.mmnt.net/db/0/0/ftp.cmdl.noaa.gov/ccg/ch4/in-situ CO2 continuous data http://www.mmnt.net/db/0/0/ftp.cmdl.noaa.gov/ccg/co2/in-situ |
|||
| SCRIPPS | Scripps CO2 Program | This study presents atmospheric CO2 concentrations spanning latitudes 82 degrees N to 90 degrees S although only North American data is included here. | Data link |
| Documentation link | |||
|
Source link http://scrippsco2.ucsd.edu/data/atmospheric_co2.html http://cdiac.ornl.gov/trends/co2/sio-keel.html |
|||
| WMO- Environment Canada | World Meteorology Organization - Environment Canada | These data sets report CH4 and CO2 mixing ratios collected at seven station in Canada between 2000 and 2008 | Data link |
| Documentation link | |||
|
Source link http://www.ec.gc.ca/donneesnatchem-natchemdata/default.asp?lang=En&n=732D8935-1 http://ds.data.jma.go.jp/gmd/wdcgg/cgi-bin/wdcgg/accessdata.cgi?lang=&contributor_index=200612120011 |
|||
| COBRA | CO2 Budget and Regional Airborne-North America (COBRA-NA) | The objective of COBRA is to test concepts for observations and data assimilation to determine the large scale sources and sinks of greenhouse gases and ozone destroying gases from North America. The study covers spatial scales from regional to continental. Gases of interest include; CO2, CO, CH4, N2O, CFCs, chlorinated solvents (CH3CCl3, CCl4), SF6, ozone, and H2. | Data link |
| Documentation link | |||
|
Source link http://www.esrl.noaa.gov/gmd/hats/airborne/acats/projects/cobra-na/ |
|||
| INTEX-A | Intercontinental Chemical Transport Experiment, Phase A | INTEX-NA is an integrated atmospheric field experiment consisting of two phases. Phase A (INTEX-A) occurred in the summer of 2004 over the central and eastern United States. The INTEX-NA mission seeks to answer questions about the transport and transformation of gases and aerosols on the transcontinental/intercontinental scales and their impact on air quality and climate. | Data link |
| Documentation link | |||
|
Source link http://www-air.larc.nasa.gov/missions/intexna/dataaccess.htm http://www.espo.nasa.gov/intex-na/ |
|||
| INTEX-B | Intercontinental Chemical Transport Experiment, Phase B | INTEX-NA is an integrated atmospheric field experiment consisting of two phases. Phase B (INTEX-B) occurred in the summer of 2006 over the west coast of the United States and out into the Pacific region towards Asia. The INTEX-NA mission seeks to answer questions about the transport and transformation of gases and aerosols on the transcontinental/ intercontinental scales and their impact on air quality and climate. | Data link |
| Documentation link | |||
|
Source link http://www.espo.nasa.gov/intex-b/ http://www-air.larc.nasa.gov/missions/intex-b/dataaccess.htm |
Table 4. Summary of measurements and methods for each network compiled from individual READMEs.
| Network | Chemical Species Measured | Instrument / Method | Comments |
|---|---|---|---|
| AGAGE | CFC-11, CFC-12, CH3CCl3, CCl4, N2O, CFC-113, CH4, CHCl3, CO, and H2. | AGAGE GC-ECD/FID/MRD system | continuous |
| HFC-134a, HCFC-22, HCFC-141b, HCFC-142b, CH3Cl, CH3Br, Halon-1211, Halon-1301, HFC-152a, CH2Cl2, CHClCCl3, and CCl2CCl2 | AGAGE GC-MS (ADS) system | continuous | |
| CFC-113, HCFC-22, HCFC-141b, HCFC-142b, HFC-125, HFC-134a, HFC-152a, HFC-365mfc, HFC-23, Halon-1211, Halon-1301, CH3Cl, CH2Cl2, CHCl3, CH3Br, CH3CCl3, CHClCCl2, CCl2CCl2, SF6, SO2F2, PFC-14, PFC-116, PFC-218 CO, H2 | Medusa GC-MS instruments (installed at Trinidad Head in 2005) | continuous | |
| CSIRO | CO, H2 | GC with mercuric oxide, reduction. CO reduces HgO to Hg vapor which is detected by UV absorption. RGA3-1 (R1) Trace Analytical GC was used over the length of the record. | flasks |
| CH4,CO2 | GC/FID. Three Carle GC's were used: Carle-1, Carle-2, and Carle-3 (C1, C2, C3) | flasks | |
| 13C C02 | Dual inlet stable isotope ratio mass spectrometry (M1, Finnigan MAT252), after CO2 was captured with automated cryogenic trapping system | flasks | |
| Irvine Latitude Network | CCl4, C2Cl4, cfc11, cfc113, cfc12, CHCl3, CH3CCl3, CH3ONO2, EtONO2, H1211, i.PrONO2 | GC/ECD | flasks |
| n.butane, i.butane, CH4, ethane, ethyne, propane | GC/FID | flasks | |
| Tyler-UCI | CO | Shimadzu Model 14A GC with a Model RGD2 reduction gas analyzer detector (HgO) | flasks |
| CH4 | Hewlett Packard 5880A GC /FID | flasks | |
| d13C CH4, dC13 CO2 | Finnigan MAT Model 252 IRMS | flasks | |
| dD-CH4 | cf-GC/IRMS coupled to a custom-designed CH4 gas preconcentrator. A pyrolysis oven converts CH4 to H2 after its separation from the air stream and before its detection by the mass spectrometer | flasks | |
| NOAA | CH4 | GC/FID | flasks, continuous |
| CO H2 | GC/HgO | flasks | |
| CO2 | NDIR | flasks | |
| dC13 CO2, dO18 CO2 | dC13 CO2, dO18 CO2 | flasks | |
| dC14 CO2 | Accelerator MS | flasks | |
| N2O | GC/ECD | flasks | |
| CO2 | NDIR | continuous | |
| CCl4, cfc11, cfc113, cfc12, CH3CCl3, CH3Cl, hcfc22, hcfc142b, H1211, N2O, SF6 | GC for Atmospheric Trace Species (CATS). These GCs replaced the Radiatively Important Trace Species (RITS) GCs, which were in operation from 1986 to 2000 | continuous | |
| SCRIPPS | CO2 | NDIR | flasks |
| WMO- Environment Canada | CH4, CO | GC/FID | flasks, continuous |
| CO2 | NDIR | flasks, continuous | |
| COBRA | N2O, SF6, CFC-12 (CCl2F2), and halon-1211 (CBrClF2) H2), CO, CH4, CFC-11 (CCl3F), CFC-113 (CClF2-CCl2F), CHCl3, CH3CCl3, CCl4 | ATS airborne GC, Airborne Chromatograph for Atmospheric Trace Species (ACATS-IV) | flasks |
| CO2 | LiCor CO2 analyzer | ||
| O2/N2, Ar/N2, and CO2/N2 | MS | flasks | |
| 13CO2/12CO2 and C18O16O/C16O16O | Micromass Otima MS at INSTAAR | flasks | |
| CO2, CO, CH4, N2O, H2, and SF6 | GMD | flasks | |
| INTEX-A DC-8 | O3 | NO/O3, Chemiluminescence | flasks, continuous |
| CH2O,OH,HO2,NO,RO2 | Laser Induced Fluorescence | flasks, continuous | |
| CO, CH4, N2O, CH2O | Tunable Diode Laser Absorption Spectrometry | flasks, continuous | |
| VOC’s, CO_UCI, CH4_UCI, DMS_UCI | GC-FID/EC/MSGC-FID/EC/MS | flasks, continuous | |
| NO2, NOy, "alkyl" nitrates | Laser Induced Fluorescence and thermal dissociation | flasks, continuous | |
| CO2 | NDIR; LI-COR 6252 Spectrometer | flasks, continuous | |
| PANs | Automated dual GC with cryofocusing | flasks, continuous | |
| methanol, ethanol, acetonitrile, HCN | Reduction Gas Detector | flasks, continuous | |
| acetaldehyde, acetone, MEK, benzene | Photo Ionization Detector | flasks, continuous | |
| H2O vapor | Open path Diode Laser Hygrometer (mixing ratio) Absorption Spectrometry | flasks, continuous | |
| HNO3, fine aerosol sulfate, bulk aerosol composition | Mist chamber/GC-IC isokinetic sampling through forward-facing aerosol inlet onto Teflon filter, ion chromatography | flasks, continuous | |
| SO2, HO2NO2, HNO3, H202, HCN, PAA | Chemical Ionization MS | flasks, continuous | |
| Bulk aerosol ionic composition | Particle into Liquid Sampling (PILS) coupled to ICs | flasks, continuous | |
| CH2O, PAA | Fluorometry (aqueous collection followed by enzyme fluorescence detection) | flasks, continuous | |
| CH3OOH, H2O2 | HPLC-fluorometry | flasks, continuous | |
| INTEX-B DC-8 | Aerosol number, concentration, area density, volume density | Wing Mounted Aerosol Probes | flasks, continuous |
| O3 | NO/O3, Chemiluminescence | flasks, continuous | |
| H2O mixing ratio, J(NO2) | Cryo-chill mirror, cryogenic hygrometer, filter radiometer,ICATS Navigation System | flasks, continuous | |
| CO, CH4, OCS, DMS, CS2, CFCs, VOCs | Grab samples analyzed with GC and GC-MS | flasks, continuous | |
| Aerosol Scattering Ratio, Aerosol Depolarization %, Wavelength Dependence, Troposphere and tropopause O3 profiles | UV Lidar (Airborne Differential Absorption Lidar- DIAL), Aerosol | flasks, continuous | |
| OH, HO2 | Laser Induced Fluorescence (LIF) | flasks, continuous | |
| Aerosol absorption coefficients, size, concentration, scattering coefficients | 3-wl Radiance Research Particle Soot Absorption Photometer (PSAP), Aerodynamic Particle Sizer (APS TSI 3221), TSI Condensation Particle Counter (CPC), Differential Mobility Analyzer (DMA and Long DMA), Optical Particle Counter (OPC) calibrated with PSL spheres, nephelometers (TSI 3563 and 3 Radiance Research-RR) | flasks, continuous | |
| NO2, HNO3, PANs, "alkyl" nitrates | Thermal Dissociation-Laser Induced Fluorescence | flasks, continuous | |
| Bulk aerosol ionic composition, HNO3, fine aerosol sulfate | Isokinetic sampling through forward-facing aerosol inlet onto teflon filter, mist chamber | flasks, continuous | |
| H2O vapor mixing ratio | Open path Diode Laser Hygrometer | flasks, continuous | |
| CH2O (formaldehyde) | Tunable Diode Laser | flasks, continuous | |
| H2O2, CH3OOH, CH2O | Fluorometry (aqueous collection followed by enzyme fluorescence detection and high-performance liquid chromatography-HPLC) | flasks, continuous | |
| HCl | Chemical Ionization Mass Spectrometry (CIMS) | flasks, continuous | |
| NO | NO Chemiluminescence | flasks, continuous | |
| O3 number density and mixing ratio, aerosol number | Excimer and Yag lasers | flasks, continuous | |
| H2O2 | Aqueous collection followed by Chemiluminescence with acidinium ester | flasks, continuous | |
| CO, CH4, N2O | Diode laser spectrometer | flasks, continuous | |
| J(O3), J(NO2), J(N2O5), J(H2O2), J(HNO2), J(HNO3), J(CH20), J(CH3CHO), J(C2H5CHO), J(CHOCHO), J(CH3COCHO), J(CH3COCH3), J(CH3OOH), J(CH3ONO2), J(PAN), J(CH3CH2CH2CHO), J(CH3COCH2CH3), J(HO2NO2), J(CH3CH2ONO2) | Scanning actinic flux spectroradiometer with photo multiplier tube (PMT) detector | flasks, continuous | |
| PAN, acetaldehyde, propanal, acetone, methyl ethyl ketone, (MEK), methanol, ethanol, acetonitrile, HCN | Automated dual gas chromatography with cryofocusing (PAN), Reduction Gas Detector (methanol,ethanol, nitriles) | flasks, continuous | |
| Total Gaseous Mercury (TGM | Cold Vapor Atomic Fluorescence Spectrometry | flasks, continuous | |
| NO, LOD | Laser-Induced Fluorescence (LIF) | flasks, continuous | |
| CO2 | LI-COR 6252 Spectrometer | flasks, continuous | |
| INTEX-B C-130 | Trace organic gases | Trace Organic Gas Analyzer (TOGA) | flasks, continuous |
| VOCs, CFCs | Grab samples analyzed with GC and GC/MS | flasks, continuous | |
| Aerosols: optical properties | Transmission electron microscopy | flasks, continuous | |
| CO | Vacuum ultraviolet (VUV) fluorescence | flasks, continuous | |
| HO2, RO2, OH, H2SO4, methanesulfonate (MSA) | Chemical Ionization Mass Spectrometry (CIMS) instrument as component of Eisele/Mouldin 4-channel instrument | flasks, continuous | |
| Aerosol absorption coefficients, size, concentration, scattering coefficients | 3-wl Radiance Research Particle Soot Absorption Photometer (PSAP), Aerodynamic Particle Sizer (APS, TSI 3321), TSI Condensation Particle Counter (CPC), Differential Mobility Analyzer (DMA and Tandem DMA), optical particle counter (OPC) calibrated with PSL spheres, nephelometer (TSI 3563) | flasks, continuous | |
| PANs, PiBN | PAN CIGARette Thermal Decomposition Chemical Ionization Spectrometer | flasks, continuous | |
| SO2 | PAN CIGARette Thermal Decomposition Chemical Ionization Spectrometer | flasks, continuous | |
| Aerosol chemical composition | Aerodyne HR-ToF Aerosol Mass Spectrometer (AMS) | flasks, continuous | |
| Acetic acid, acetone, hydrocarbons, carbonyls, methyl ethyl ketone (MEK) | Proton Transfer Reaction Mass Spectrometry (PTR-MS) | flasks, continuous | |
| Aerosol number and mass | Single Particle Soot Photometer (SP-2) to distinguish non-incandescing and incandescing particles | flasks, continuous | |
| Latitude, longitude, roll, pitch, heading, ground speed, altitude, GPS measurements, rel. humidity, H2O vapor pressure, dew/frost point temperature, shortwave/UV irradiance, potential temperature | Honeywell YG1854 Inertial Reference System (IRS), Global Positioning System (GPS), | flasks, continuous | |
| Cloud Condensation Nuclei | Droplet Measurement Technologies streamwise thermal gradient CCN instrument | flasks, continuous | |
| Organic functional group composition of particles, elemental concentrations of particles | Fourier Transform Infrared (FITR), x-ray fluorescence, scanning x-ray transmission microscope | flasks, continuous | |
| Photolytic frequencies, J(O3), J(NO2), J(N2O5), J(H2O2), J(HNO2), J(HNO3), J(CH2O), J(CH3CHO), J(C2H5CHO), J(CHOCHO), J(CH3COCHO), J(CH3COCH3), J(CH3OOH), J(CH3ONO2), J(PAN), J(CH3CH2CH2CHO), J(HO2NO2), J(CH3CH2ONO2) | Scanning actinic flux spectroradiometer with photo multiplier tube (PMT) detector | flasks, continuous | |
| Bulk aerosol ionic composition | Particle into Liquid Sampling (PILS) coupled to ion chromatographs, PILS coupled with Sievers Total Organic Carbon instrument | flasks, continuous | |
| Formaldehyde | Difference frequency generation( DFG) tunable diode laser | flasks, continuous | |
| NO, NO2, NOy, O3 | NOxy and O3 | flasks, continuous | |
| Acetic acid, formic acid, H2O2, HCN, HNO3, mixed-base hydrogen peroxide (MHP), polyacrylic acid (PAA), propanoic acid, SO2 | Chemical Ionization Mass Spectrometry (CIMS)-direct measurements in ambient air | flasks, continuous |
Abbreviations:
GC = Gas Chromatograph; MS = Mass Spectrometer; FID = Flame Ionization Detector; ECD = Electron Capture Detector; NDIR = Non dispersive infrared analyzer; IRMS = Isotope-Ratio Mass Spectrometer
6. Data Access:
This data set is available through the Oak Ridge National Laboratory (ORNL) Distributed Active Archive Center (DAAC).
Data Archive Center:
Contact for Data Center Access Information:
E-mail: uso@daac.ornl.gov
Telephone: +1 (865) 241-3952
7. References:
Denning, A.S., et al. 2005. Science implementation strategy for the North American Carbon Program: A Report of the NACP Implementation Strategy Group of the U.S. Carbon Cycle Interagency Working Group. U.S. Carbon Cycle Science Program, Washington, DC. 68 pp.
Gerbig, C., Lin, J.C., Wofsy, S.C., Daube, B.C., Andrews, A.E., Stephens, B.B., Bakwin, P.S. and Grainger, C.A. (2003). Toward constraining regional-scale fluxes of CO2 with atmospheric observations over a continent: 2. Analysis of COBRA data using a receptor-oriented framework. Journal of Geophysical Research 108: doi: 10.1029/2003JD003770. issn: 0148-0227.
Geels, C., Doney, S. C., Dargaville, R., Brandt, J., and Christensen, J. H.: Investigating the sources of synoptic variability in atmospheric CO2 measurements over the Northern Hemisphere continents: a regional model study, Tellus B, 56, 35–50, 2004.
Miller, Scot M. and Wofsy, Steven C., Michalak, Anna M., Kort, Eric A., Andrews, Arlyn E., Biraud, Sebastien C., Dlugokencky, Edward J., Eluszkiewicz, Janusz, Fischer, Marc L., Janssens-Maenhout, Greet, Miller, Ben R., Miller, John B., Montzka, Stephen A., Nehrkorn, Thomas, Sweeney, Colm. 2013. Anthropogenic emissions of methane in the United States. PNAS 110(50) 20018-20022. 10.1073/pnas.1314392110
Wofsy, S.C. and R.C. Harriss (Eds.). 2002. The North American Carbon Program (NACP). Report of the NACP Committee of the U.S. Interagency Carbon Cycle Science Program. Washington, D.C.: U.S. Global Change Research Program.