Get Data
Summary:
This data set reports monthly measured soil volumetric water content (VWC) from a rainfall exclusion experiment that was conducted from 1999-2001 at the km 67 Seca Floresta site, Tapajos National Forest, Brazil. The purpose was to observe the potential effects of severe water stress on a humid Amazonian forest (Nepstad 2002).
There are two ASCII comma delimited files with monthly measured VWC, one for the control plot and one for the rainfall exclusion plot. These measured values were used by the authors to develop a model of monthly changes in the distribution of water through the soil layers. The simulated VWC values are also provided in the file with the measured VWC.
For comparison, the model for simulating monthly changes of VWC was modified to incorporate rainfall and plant water uptake and simulate daily VWC. There are two ASCII comma delimited files of these daily simulated results; one for the control plot and one for the rainfall exclusion plot. See Belk et al. (2007) for details.
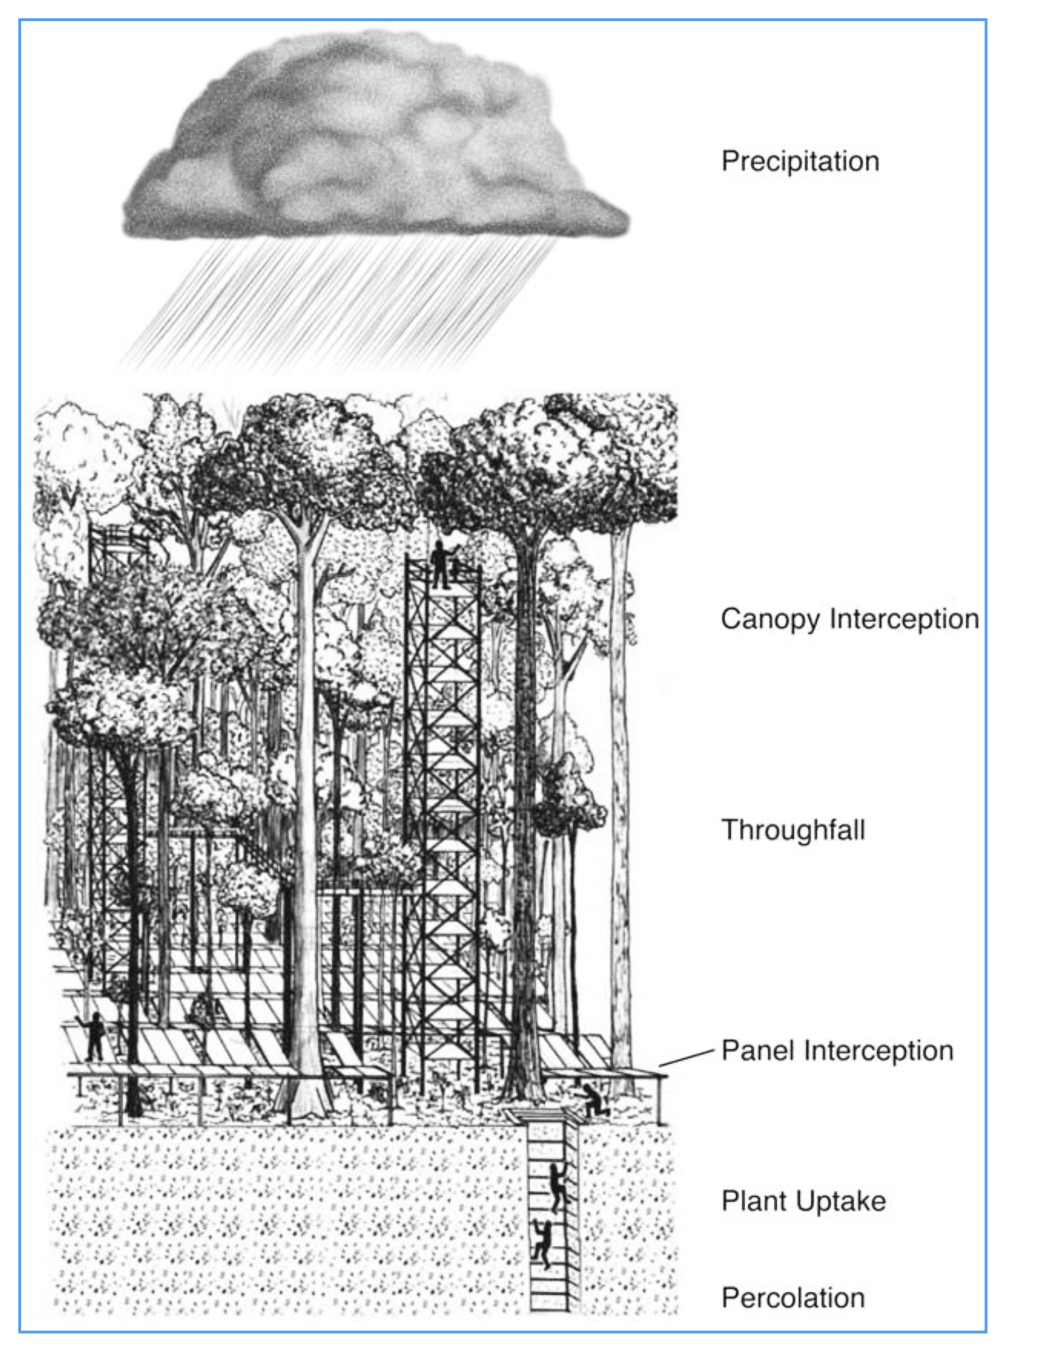
Figure 1. Idealized model structure for water cycling in a deep Oxisol. Drawn by Kemel Bittencourt Kalif. From Belk et al., 2007.
Data Citation:
Cite this data set as follows:
Belk, E.L., D. Markewitz, T. Rasmussen, E.J.M. Carvalho, D.C. Nepstad, and E.A. Davidson. 2012. LBA-ECO ND-02 Soil Volumetric Water Content, Tapajos National Forest, Brazil. Data set. Available on-line [http://daac.ornl.gov] from Oak Ridge National Laboratory Distributed Active Archive Center, Oak Ridge, Tennessee, U.S.A. http://dx.doi.org/10.3334/ORNLDAAC/1061
Implementation of the LBA Data and Publication Policy by Data Users:
The LBA Data and Publication Policy [http://daac.ornl.gov/LBA/lba_data_policy.html] is in effect for a period of five (5) years from the date of archiving and should be followed by data users who have obtained LBA data sets from the ORNL DAAC. Users who download LBA data in the five years after data have been archived must contact the Investigators who collected the data, per provisions 6 and 7 in the Policy.
This data set was archived in February of 2012. Users who download the data between February 2012 and January 2017 must comply with the LBA Data and Publication Policy.
Data users should use the Investigator contact information in this document to communicate with the data provider. Alternatively, the LBA website [http://lba.inpa.gov.br/lba/] in Brazil will have current contact information.
Data users should use the Data Set Citation and other applicable references provided in this document to acknowledge use of the data.
Table of Contents:
- 1 Data Set Overview
- 2 Data Characteristics
- 3 Applications and Derivation
- 4 Quality Assessment
- 5 Acquisition Materials and Methods
- 6 Data Access
- 7 References
1. Data Set Overview:
Project: LBA (Large-Scale Biosphere-Atmosphere Experiment in the Amazon)
Activity: Modeling the Biogeochemical System of the Terrestrial Amazon
LBA Science Component: Nutrient Dynamics
Team ID: ND-02 (Davidson / Stone / Markewitz / Carvalho / Sa / Vieira / Moutinho / Figueiredo)
The investigators were Davidson, Eric A.; Markewitz, Daniel; Stone, Thomas A.; Carvalho, Claudio Jose Reis de; Figueiredo, Ricardo de Oliveira; Moutinho, Paulo Roberto de Souza; Sa, Tatiana Deane De Abreu; Vieira, Ima Celia G.; Almeida, Arlete Silva de; Araujo, Thereza Cristina; Bastos, Therezinha Xavier; Coelho, Roberta de Fatima R.; Correa, Jean Michel; Costa, Brenda Magda do Nascimento; Costa, Fabiola Fernandes; Cunha, Ewerton da Silva; da Rosa, Maria Beatriz Silva; de Figueiredo, Tenilson Monteiro; Dutra, Fabio Carneiro; Freire, Georgia Silva; Guerrero, Jose Benito; Guild, Liane S.; Hayashi, Sanae Nogueira; Ishida, Francoise Yoko; Junior, Alvaro Castro Pacheco; Kingerlee, Wendy; Leal, Eliane Constantinov; Leao, Luciene Mota de; Leite, Tania de Sousa; Lobato Junior, Ivan da Costa; Lopes, Leticia Campos; Martins, Jorge Ricardo de Souza; Maues, Bernardo Antonio Rodrigue Antonio; Pacheco, Nilza Araujo; Pantoja, Maria de Jesus Ribeiro; Pedreira, Alessandra Cavalcante; Portela, Gilvane Azevedo; Reis, Marilea Barros; Rodrigues Pantoja, Karina de Fatima; Saba, Renata Tuma; Salimon, Cleber Ibraim; Santos, Elisana Batista; Santos, Maria Tereza Primo dos; Santos Junior, Mario Rosa; Schuler, Marysol A. E.; Serrao, Bruno de Oliveira; Siddique, Ilyas; Silva, Marilia; Silva, Patricio de Souza; Silva, Sabrina Forte E; Silva, Wanderley Rocha da; Souza, Alex Henrique Moreira de; Souza, Cleo Marcelo Araujo; Souza, Karina Christina Neves de and Tancredi, Nicola Saverio Holanda . You may contact Markewitz, Dr. Daniel (dmarke@forestry.uga.edu).
LBA Data Set Inventory ID: ND02_REE_Soil_VWC
This data set reports monthly measured soil volumetric water content (VWC) from a rainfall exclusion experiment that was conducted from 1999-2001 at the km 67 Seca Floresta site, Tapajos National Forest, Brazil. The purpose was to observe the potential effects of severe water stress on a humid Amazonian forest (Nepstad 2002).
Related Data Sets
- LBA-ECO TG-09 SOIL ISOTOPIC C, N, H2O, AND N2O DATA, TAPAJOS NATIONAL FOREST, BRAZIL (Studies performed during same time frame, same location)
- LBA-ECO ND-02 SOIL GAS FLUX, RAINFALL EXCLUSION, KM 67, TAPAJOS NATIONAL FOREST (Rainfall exclusion experiment started in 1999)
2. Data Characteristics:
There are 4 comma-delimited data files with this data set.
Files 1 and 2 contain monthly measured VWC values and simulated monthly VWC values for the control and treatment plots.
Files 3 and 4 are simulated daily VWC values for the control and treatment plots, respectively.
File 1: Seca_Floresta_actual_vs_simulated_VWC_control_plot.csv
Data description: Monthly volumetric water content by depth for actual measured values (prefix A) and model simulated values (prefix S) in the control plot. There are 13 depths.
| Column | Heading | Units/format | Description |
|---|---|---|---|
| 1 | Date | yyyy/mm/dd | Sample date (yyyy/mm/dd) |
| 2 | Plot_type | Plot type: Control | |
| 3 | A30 | cm^3/cm^3 | Measured volumetric water content (cm^3/cm^3) at 30 centimeters |
| 4 | A50 | cm^3/cm^3 | Measured volumetric water content (cm^3/cm^3) at 50 centimeters |
| 5 | A100 | cm^3/cm^3 | Measured volumetric water content (cm^3/cm^3) at 100 centimeters |
| 6 | A200 | cm^3/cm^3 | Measured volumetric water content (cm^3/cm^3) at 200 centimeters |
| 7 | A300 | cm^3/cm^3 | Measured volumetric water content (cm^3/cm^3) at 300 centimeters |
| 8 | A400 | cm^3/cm^3 | Measured volumetric water content (cm^3/cm^3) at 400 centimeters |
| 9 | A500 | cm^3/cm^3 | Measured volumetric water content (cm^3/cm^3) at 500 centimeters |
| 10 | A600 | cm^3/cm^3 | Measured volumetric water content (cm^3/cm^3) at 600 centimeters |
| 11 | A700 | cm^3/cm^3 | Measured volumetric water content (cm^3/cm^3) at 700 centimeters |
| 12 | A800 | cm^3/cm^3 | Measured volumetric water content (cm^3/cm^3) at 800 centimeters |
| 13 | A900 | cm^3/cm^3 | Measured volumetric water content (cm^3/cm^3) at 900 centimeters |
| 14 | A1000 | cm^3/cm^3 | Measured volumetric water content (cm^3/cm^3) at 1000 centimeters |
| 15 | A1100 | cm^3/cm^3 | Measured volumetric water content (cm^3/cm^3) at 1100 centimeters |
| 16 | S30 | cm^3/cm^3 | Simulated volumetric water content (cm^3/cm^3) at 30 centimeters |
| 17 | S50 | cm^3/cm^3 | Simulated volumetric water content (cm^3/cm^3) at 50 centimeters |
| 18 | S100 | cm^3/cm^3 | Simulated volumetric water content (cm^3/cm^3) at 100 centimeters |
| 19 | S200 | cm^3/cm^3 | Simulated volumetric water content (cm^3/cm^3) at 200 centimeters |
| 20 | S300 | cm^3/cm^3 | Simulated volumetric water content (cm^3/cm^3) at 300 centimeters |
| 21 | S400 | cm^3/cm^3 | Simulated volumetric water content (cm^3/cm^3) at 400 centimeters |
| 22 | S500 | cm^3/cm^3 | Simulated volumetric water content (cm^3/cm^3) at 500 centimeters |
| 23 | S600 | cm^3/cm^3 | Simulated volumetric water content (cm^3/cm^3) at 600 centimeters |
| 24 | S700 | cm^3/cm^3 | Simulated volumetric water content (cm^3/cm^3) at 700 centimeters |
| 25 | S800 | cm^3/cm^3 | Simulated volumetric water content (cm^3/cm^3) at 800 centimeters |
| 26 | S900 | cm^3/cm^3 | Simulated volumetric water content (cm^3/cm^3) at 900 centimeters |
| 27 | S1000 | cm^3/cm^3 | Simulated volumetric water content (cm^3/cm^3) at 1000 centimeters |
| 28 | S1100 | cm^3/cm^3 | Simulated volumetric water content (cm^3/cm^3) at 1100 centimeters |
Example data records
|
Date,Plot_type,A30,A50,A100,A200,A300,A400,A500,A600,A700,A800,A900,A1000, A1100,S30,S50,S100,S200,S300,S400,S500,S600,S700,S800,S900,S1000,S1100 1999/05/17,Control,0.387,0.301,0.329,0.339,0.370,0.378,0.415,0.422,0.433,0.418,0.414,0.410, 0.406,0.388,0.301,0.329,0.339,0.370,0.378,0.415,0.423,0.433,0.418,0.414,0.410,0.406 1999/06/08,Control,0.318,0.275,0.310,0.314,0.344,0.378,0.415,0.423,0.432,0.418,0.414,0.411, 0.406,0.373,0.295,0.315,0.309,0.346,0.392,0.427,0.441,0.447,0.444,0.424,0.419,0.409 ... 2000/25/01,Control,0.345,0.22,0.335,0.311,0.342,0.377,0.407,0.406,0.412,0.391,0.383,0.382, 0.376,0.414,0.361,0.342,0.32,0.346,0.357,0.379,0.38,0.397,0.398,0.389,0.391,0.388 2000/22/02,Control,0.363,0.308,0.352,0.328,0.352,0.387,0.414,0.424,0.432,0.416,0.413,0.408, 0.396,0.418,0.374,0.37,0.334,0.378,0.41,0.432,0.427,0.419,0.404,0.388,0.389,0.385 ... 2001/11/12,Control,0.257,0.24,0.243,0.239,0.272,0.328,0.376,0.392,0.413,0.418,0.397,0.41, 0.407,0.289,.235,0.257,0.27,0.289,0.335,0.384,0.393,0.409,0.412,0.401,0.403,0.399 2001/12/12,Control,0.258,0.24,0.238,0.23,0.254,0.315,0.365,0.385,0.409,0.416,0.394,0.408, 0.407,0.29,0.235,0.246,0.265,0.284,0.329,0.379,0.386,0.403,0.406,0.396,0.398,0.394 |
File 2: Seca_Floresta_actual_vs_simulated_VWC_treatment_plot.csv
Data description: Monthly volumetric water content by depth for actual measured values (prefix A) and model simulated values (prefix S) in the treatment plot. There are 13 depths.
| Column | Heading | Units/format | Description |
|---|---|---|---|
| 1 | Date | yyyy/mm/dd | Sample date (yyyy/mm/dd) |
| 2 | Plot_type | Plot type: Treatment | |
| 3 | A30 | cm^3/cm^3 | Measured volumetric water content (cm^3/cm^3) at 30 centimeters |
| 4 | A50 | cm^3/cm^3 | Measured volumetric water content (cm^3/cm^3) at 50 centimeters |
| 5 | A100 | cm^3/cm^3 | Measured volumetric water content (cm^3/cm^3) at 100 centimeters |
| 6 | A200 | cm^3/cm^3 | Measured volumetric water content (cm^3/cm^3) at 200 centimeters |
| 7 | A300 | cm^3/cm^3 | Measured volumetric water content (cm^3/cm^3) at 300 centimeters |
| 8 | A400 | cm^3/cm^3 | Measured volumetric water content (cm^3/cm^3) at 400 centimeters |
| 9 | A500 | cm^3/cm^3 | Measured volumetric water content (cm^3/cm^3) at 500 centimeters |
| 10 | A600 | cm^3/cm^3 | Measured volumetric water content (cm^3/cm^3) at 600 centimeters |
| 11 | A700 | cm^3/cm^3 | Measured volumetric water content (cm^3/cm^3) at 700 centimeters |
| 12 | A800 | cm^3/cm^3 | Measured volumetric water content (cm^3/cm^3) at 800 centimeters |
| 13 | A900 | cm^3/cm^3 | Measured volumetric water content (cm^3/cm^3) at 900 centimeters |
| 14 | A1000 | cm^3/cm^3 | Measured volumetric water content (cm^3/cm^3) at 1000 centimeters |
| 15 | A1100 | cm^3/cm^3 | Measured volumetric water content (cm^3/cm^3) at 1100 centimeters |
| 16 | S30 | cm^3/cm^3 | Simulated volumetric water content (cm^3/cm^3) at 30 centimeters |
| 17 | S50 | cm^3/cm^3 | Simulated volumetric water content (cm^3/cm^3) at 50 centimeters |
| 18 | S100 | cm^3/cm^3 | Simulated volumetric water content (cm^3/cm^3) at 100 centimeters |
| 19 | S200 | cm^3/cm^3 | Simulated volumetric water content (cm^3/cm^3) at 200 centimeters |
| 20 | S300 | cm^3/cm^3 | Simulated volumetric water content (cm^3/cm^3) at 300 centimeters |
| 21 | S400 | cm^3/cm^3 | Simulated volumetric water content (cm^3/cm^3) at 400 centimeters |
| 22 | S500 | cm^3/cm^3 | Simulated volumetric water content (cm^3/cm^3) at 500 centimeters |
| 23 | S600 | cm^3/cm^3 | Simulated volumetric water content (cm^3/cm^3) at 600 centimeters |
| 24 | S700 | cm^3/cm^3 | Simulated volumetric water content (cm^3/cm^3) at 700 centimeters |
| 25 | S800 | cm^3/cm^3 | Simulated volumetric water content (cm^3/cm^3) at 800 centimeters |
| 26 | S900 | cm^3/cm^3 | Simulated volumetric water content (cm^3/cm^3) at 900 centimeters |
| 27 | S1000 | cm^3/cm^3 | Simulated volumetric water content (cm^3/cm^3) at 1000 centimeters |
| 28 | S1100 | cm^3/cm^3 | Simulated volumetric water content (cm^3/cm^3) at 1100 centimeters |
Example data records
|
Date,Plot_type,A30,A50,A100,A200,A300,A400,A500,A600,A700,A800,A900,A1000, A1100,S30,S50,S100,S200,S300,S400,S500,S600,S700,S800,S900,S1000,S1100 1999/05/17,Treatment,0.313,0.311,0.301,0.307,0.325,0.354,0.374,0.394,0.399,0.373,0.386,0.392, 0.413,0.313,0.311,0.300,0.307,0.325,0.354,0.374,0.394,0.399,0.373,0.386,0.392,0.413 1999/06/08,Treatment,0.305,0.289,0.263,0.300,0.304,0.341,0.370,0.394,0.396,0.366,0.384,0.404, 0.415,0.351,0.310,0.316,0.307,0.331,0.361,0.392,0.389,0.397,0.390,0.383,0.391,0.391 ... 2000/07/12,Treatment,0.292,0.23,0.31,0.293,0.326,0.325,0.367,0.415,0.411,0.396,0.418,0.399, 0.402,0.327,0.247,0.282,0.284,0.304,0.348,0.393,0.402,0.417,0.417,0.405,0.405,0.4 2000/08/08,Treatment,0.299,0.224,0.298,0.297,0.328,0.331,0.384,0.42,0.418,0.409,0.415,0.403, 0.399,0.294,0.252,0.274,0.279,0.297,0.342,0.388,0.397,0.412,0.413,0.402 0.403 0.398 ... 2001/11/12,Treatment,0.21,0.189,0.265,0.242,0.258,0.297,0.329,0.385,0.382,0.373,0.382,0.355, 0.361,0.289,0.235,0.235,0.254,0.263,0.294,0.344,0.344,0.363,0.361,0.356 0.359 0.357 2001/12/12,Treatment,0.211,0.192,0.266,0.238,0.255,0.275,0.327,0.384,0.379,0.371,0.378,0.352, 0.36,0.29,0.235,0.225,0.249,0.259,0.291,0.341,0.341,0.36,0.358,0.354,0.357,0.355 |
File 3: Seca_Floresta_simulated_VWC_control_plot.csv
Data description: Simulated daily volumetric water content by depth from model with rainfall and plant water uptake in the control plot (Belk et al., 2007).
| Column | Heading | Units/format | Description |
|---|---|---|---|
| 1 | Day | Sequential day of the series of data | |
| 2 | Date | yyyy/mm/dd | Sample date (yyyy/mm/dd) |
| 3 | Plot_type | Plot type: Control | |
| 4 | S30 | cm^3/cm^3 | Simulated volumetric water content (cm^3/cm^3) at 30 centimeters |
| 5 | S50 | cm^3/cm^3 | Simulated volumetric water content (cm^3/cm^3) at 50 centimeters |
| 6 | S100 | cm^3/cm^3 | Simulated volumetric water content (cm^3/cm^3) at 100 centimeters |
| 7 | S200 | cm^3/cm^3 | Simulated volumetric water content (cm^3/cm^3) at 200 centimeters |
| 8 | S300 | cm^3/cm^3 | Simulated volumetric water content (cm^3/cm^3) at 300 centimeters |
| 9 | S400 | cm^3/cm^3 | Simulated volumetric water content (cm^3/cm^3) at 400 centimeters |
| 10 | S500 | cm^3/cm^3 | Simulated volumetric water content (cm^3/cm^3) at 500 centimeters |
| 11 | S600 | cm^3/cm^3 | Simulated volumetric water content (cm^3/cm^3) at 600 centimeters |
| 12 | S700 | cm^3/cm^3 | Simulated volumetric water content (cm^3/cm^3) at 700 centimeters |
| 13 | S800 | cm^3/cm^3 | Simulated volumetric water content (cm^3/cm^3) at 800 centimeters |
| 14 | S900 | cm^3/cm^3 | Simulated volumetric water content (cm^3/cm^3) at 900 centimeters |
| 15 | S1000 | cm^3/cm^3 | Simulated volumetric water content (cm^3/cm^3) at 1000 centimeters |
| 16 | S1100 | cm^3/cm^3 | Simulated volumetric water content (cm^3/cm^3) at 1100 centimeters |
Example data records
|
Day ,Date,Plot_type,S30,S50,S100,S200,S300,S400,S500,S600,S700,S800,S900,S1000,S1100 1,1999/05/17,Control,0.3875,0.3014,0.3287,0.3393,0.3696,0.3783,0.4148,0.4225,0.4327,0.4184,0.4141,0.4103,0.4059 2,1999/05/18,Control,0.4074,0.3562,0.3347,0.3272,0.3700,0.3880,0.4155,0.4230,0.4315,0.4213,0.4128,0.4109,0.4058 ... 230,2000/01/01,Control,0.3566,0.2965,0.283,0.2653,0.2815,0.3264,0.3759,0.3827,0.3999,0.4015,0.392,0.3941,0.3905 231,2000/01/02,Control,0.4036,0.3116,0.2828,0.2655,0.2814,0.3263,0.3758,0.3826,0.3998,0.4014,0.3919,0.394,0.3904 ... 959,2001/30/12,Treatment,0.2882,0.2351,0.2397,0.2616,0.2807,0.3263,0.376,0.3831,0.4004,0.4022,0.3928,0.3951,0.3916 960,2001/31/12,Treatment,0.2882,0.2351,0.2393,0.2614,0.2805,0.3261,0.3759,0.3829,0.4003,0.402,0.3926,0.3949,0.3914 |
File 4: Seca_Floresta_simulated_VWC_treatment_plot.csv
Data description: Simulated volumetric water content by depth from model run with rainfall and plant uptake in the treatment plot (Belk et al., 2007).
| Column | Heading | Units/format | Description |
|---|---|---|---|
| 1 | Day | Sequential day of the series of data | |
| 2 | Date | yyyy/mm/dd | Sample date (yyyy/mm/dd) |
| 3 | Plot_type | Plot type: Treatment | |
| 4 | S30 | cm^3/cm^3 | Simulated volumetric water content (cm^3/cm^3) at 30 centimeters |
| 5 | S50 | cm^3/cm^3 | Simulated volumetric water content (cm^3/cm^3) at 50 centimeters |
| 6 | S100 | cm^3/cm^3 | Simulated volumetric water content (cm^3/cm^3) at 100 centimeters |
| 7 | S200 | cm^3/cm^3 | Simulated volumetric water content (cm^3/cm^3) at 200 centimeters |
| 8 | S300 | cm^3/cm^3 | Simulated volumetric water content (cm^3/cm^3) at 300 centimeters |
| 9 | S400 | cm^3/cm^3 | Simulated volumetric water content (cm^3/cm^3) at 400 centimeters |
| 10 | S500 | cm^3/cm^3 | Simulated volumetric water content (cm^3/cm^3) at 500 centimeters |
| 11 | S600 | cm^3/cm^3 | Simulated volumetric water content (cm^3/cm^3) at 600 centimeters |
| 12 | S700 | cm^3/cm^3 | Simulated volumetric water content (cm^3/cm^3) at 700 centimeters |
| 13 | S800 | cm^3/cm^3 | Simulated volumetric water content (cm^3/cm^3) at 800 centimeters |
| 14 | S900 | cm^3/cm^3 | Simulated volumetric water content (cm^3/cm^3) at 900 centimeters |
| 15 | S1000 | cm^3/cm^3 | Simulated volumetric water content (cm^3/cm^3) at 1000 centimeters |
| 16 | S1100 | cm^3/cm^3 | Simulated volumetric water content (cm^3/cm^3) at 1100 centimeters |
Example data records
|
Day,Date,Plot_type,S30,S50,S100,S200,S300,S400,S500,S600,S700,S800,S900,S1000,S1100 1,1999/05/17,Treatment,0.313,0.311,0.300,0.307,0.325,0.354,0.374,0.394,0.399,0.373,0.386,0.392,0.413 2,1999/05/17,Treatment,0.391,0.315,0.300,0.306,0.325,0.354,0.376,0.393,0.399,0.375,0.386,0.392,0.411 ... 230,2000/01/01,Treatment,0.35,0.305,0.288,0.266,0.28,0.322,0.37,0.374,0.39,0.39,0.38,0.382,0.378 231,2000/01/02,Treatment,0.403,0.313,0.288,0.267,0.28,0.321,0.37,0.374,0.39,0.389,0.38,0.381,0.378 ... 959,2001/30/12,Treatment,0.288,0.235,0.219,0.246,0.257,0.29,0.339,0.339,0.359,0.356,0.352,0.355,0.354 960,2001/31/12,Treatment,0.288,0.235,0.219,0.246,0.257,0.289,0.339,0.339,0.359,0.356,0.352,0.355,0.354 |
Site boundaries: (All latitude and longitude given in decimal degrees)
| Site (Region) | Westernmost Longitude | Easternmost Longitude | Northernmost Latitude | Southernmost Latitude | Geodetic Datum |
|---|---|---|---|---|---|
| Para Western (Santarem) - km 67 Seca-Floresta Site (Para Western (Santarem)) | -55.0000 | -55.0000 | -2.75000 | -2.75000 | World Geodetic System, 1984 (WGS-84) |
Time period:
- The data set covers the period 1999/05/17 to 2001/12/31
- Temporal Resolution: Daily and monthly
Platform/Sensor/Parameters measured include:
- FIELD INVESTIGATION / TIME DOMAIN REFLECTOMETER / SOIL MOISTURE / WATER CONTENT
- COMPUTER MODEL / MODEL ANALYSIS / SOIL MOISTURE/ WATER CONTENT
3. Data Application and Derivation:
The data are already presented as volumetric water content in cm^3 per cm^3 and no derivation is required.
4. Quality Assessment:
Actual VWC data are derived from n=6 points at each depth within plot. Both control and treatment plots contained three soil shafts that had time domain reflectometry probes installed on two sides. Of the nearly 2,300 data points incorporated into these average values (i.e., 6 sample points for 13 depths for 29 weeks) less than 1 percent were remove due to suspect values. Problems in the field typically arise from loose cables and periodically a time domain reflectometry (TDR) rod will lose contact with the soil surface.
5. Data Acquisition Materials and Methods:
Site Description
To study the response of a humid Amazonian forest to severe drought, a partial throughfall exclusion study was initiated in 1998 in the Tapajo´s National Forest, east-central Amazonia, near Santarem, Brazil (Nepstad et al., 2002). The Seca-Floresta study plots are situated on an upper landscape plateau where the soils support a dense, humid, evergreen forest (terra firme) that does not flood annually. The canopy at this site is horizontally continuous and approximately 30 m tall. Soils are well-drained, predominantly Haplustox (Latasolos vermelhos), dominated by kaolinite clays.
Experiment Description
This experiment compares two 1-ha plots, one of which receives natural rainfall, while the other has plastic panels installed in the forest understory during the rainy season. These panels capture approximately 60 percent of incoming throughfall, channelling the water to a system of gutters and diverting it from the soil. Both the control and exclusion plots are surrounded by a 1.0-1.7 m deep trench, which reduces the ability of trees within the plots to access water from outside the plots (Sternberg et al., 2002). After a 1-year pretreatment measurement period, the plastic panels were installed at the beginning of the 2000 rainy season that extends from January to May. Panels were removed during the dry season and reinstalled prior to the rainy season of the following year.
Volumetric water contents (cm^3 per cm^3) were measured using time domain reflectometry (TDR) sensors installed to 11-m depth in six soil shafts (two plots; three shafts per plot; yielding six sensors per depth for both plots). Each soil shaft measured 1 m by 2 m in width, and extended to a depth of 12 m. Access was obtained using a system of wooden beams and supports. TDR sensors consisted of three parallel, 24-cm, stainless steel rods and were measured with a cable tester (Textronix 1502C, Beaverton, Oregon). Two TDR sensors were installed horizontally in opposing walls at 1-m increments in each soil shaft. Each of the six shafts also had two probes installed vertically from 0 to 0.3 m, and two probes installed horizontally at 0.5 m. Because the shafts were left open to maintain access for root and nutrient studies, sensors were installed into undisturbed soil 1.5 m from the shaft walls. Auger holes were back filled with native soil. This installation method was based on previous work in Oxisols in Paragominas, Para (Davidson and Trumbore, 1995). Waveforms from the TDR sensors were collected approximately once per month. Water contents were estimated following the methods of Topp et al. (1980). The Topp equation was validated for mineral soils in both surface and deep Oxisols in the Amazon in similar Belterra clay soil as studied here (Jipp et al., 1998).
Model Description
The basic model was designed to simulate monthly changes in the distribution of soil water. Vertical water movement through 13 soil layers is driven by the difference in total soil hydraulic head, which integrates the effect of matrix and gravitational forces. Modifications for daily simulations included rainfall inputs and plant uptake of water to the forest vegetation. Simulations were performed for the control plot with no reduction in water inputs and for the treatment plot using reduced throughfall exclusion water inputs during the rainy season. For a complete description of the modeling effort please reference Belk et al. (2007).
6. Data Access:
This data is available through the Oak Ridge National Laboratory (ORNL) Distributed Active Archive Center (DAAC).
Data Archive Center:
Contact for Data Center Access Information:
E-mail: uso@daac.ornl.gov
Telephone: +1 (865) 241-3952
7. References:
Belk, E.L., D. Markewitz, T.C. Rasmussen, E.J. Maklouf Carvalho, D.C. Nepstad, and E.A. Davidson. 2007. Modeling the effects of throughfall reduction on soil water content in a Brazilian Oxisol under a moist tropical forest. Water Resources Research 43(8), W08432, doi:10.1029/2006WR005493.
Davidson, E. A., and S. E. Trumbore (1995), Gas diffusivity and production of CO2 in deep soils of the eastern Amazon, Tellus, Ser. B, 47, 550–565.
Jipp, P. H., D. C. Nepstad, K. Cassel, and C. R. de Carvalho (1998), Deep soil moisture storage and transpiration in forests and pastures of seasonally- dry Amazonia, Clim. Change, 39, 395– 413.
Nepstad, D. C., et al. (2002), The effects of partial throughfall exclusion on canopy processes, aboveground production, and biogeochemistry of an Amazon forest, J. Geophys. Res., 107(D20), 8085, doi:10.1029/2001JD000360.
Sternberg, L.D.S.L., M. Moreira, and D.C. Nepstad (2002), Uptake of water by lateral roots of small trees in an Amazonian tropical forest,Plant Soil, 238, 151– 158.
Topp, G.C., J.L. Davis and A.P. Annan. 1980. Electromagnetic determination of soil water content: Measurements in coaxial transmission lines. Water Resources Research. 16:574-582.
Related Publications
- Belk, Elizabeth L., 2002. Modeling the effects of partial throughfall exclusion on the distribution of soil water in Brazilian Oxisol under tropical moist forest. MS thesis, The University of Georgia. Athens, GA.