Summary:
This data set provides estimates of watershed deforestation, as a proportion of the total area of watersheds, in Rondonia, Brazil for 1999. Deforestation maps were determined for the main agricultural and surrounding forested areas of Rondonia using multiple Landsat TM scenes (Biggs et al. 2008). Cumulative deforestation estimates were derived from this time series of Landsat scenes from 1975 to 1999. To obtain watershed-level estimates of deforestation, watershed boundaries and stream networks were delineated by a flow accumulation algorithm using a 90-m resolution digital elevation model (DEM) from NASA's Shuttle Radar Topography Mission (SRTM). The results were watersheds of seven Strahler stream orders (1-7) with stream networks that closely matched those of the 1:100,000 topographic maps for the area. The watershed boundaries, classified by stream order, were overlain on the time series of deforestation maps to determine the cumulative deforestation extent in 1999.
This data set contains six ESRI ArcGIS shapefiles of the watershed boundaries for streams orders 2-7, the smallest watershed (second order) to the largest inclusive watershed (seventh order). The cumulative deforestation estimates, as a proportion of total area for each watershed, are available as a comma-delimited text file that can be related to the individual watershed boundary shapefiles. Cumulative deforestation data are available for first order streams, although not as a shapefile.
There are six zipped ESRI ArcGIS shapefiles (*.zip) and one ASCII comma separated file with this data set.
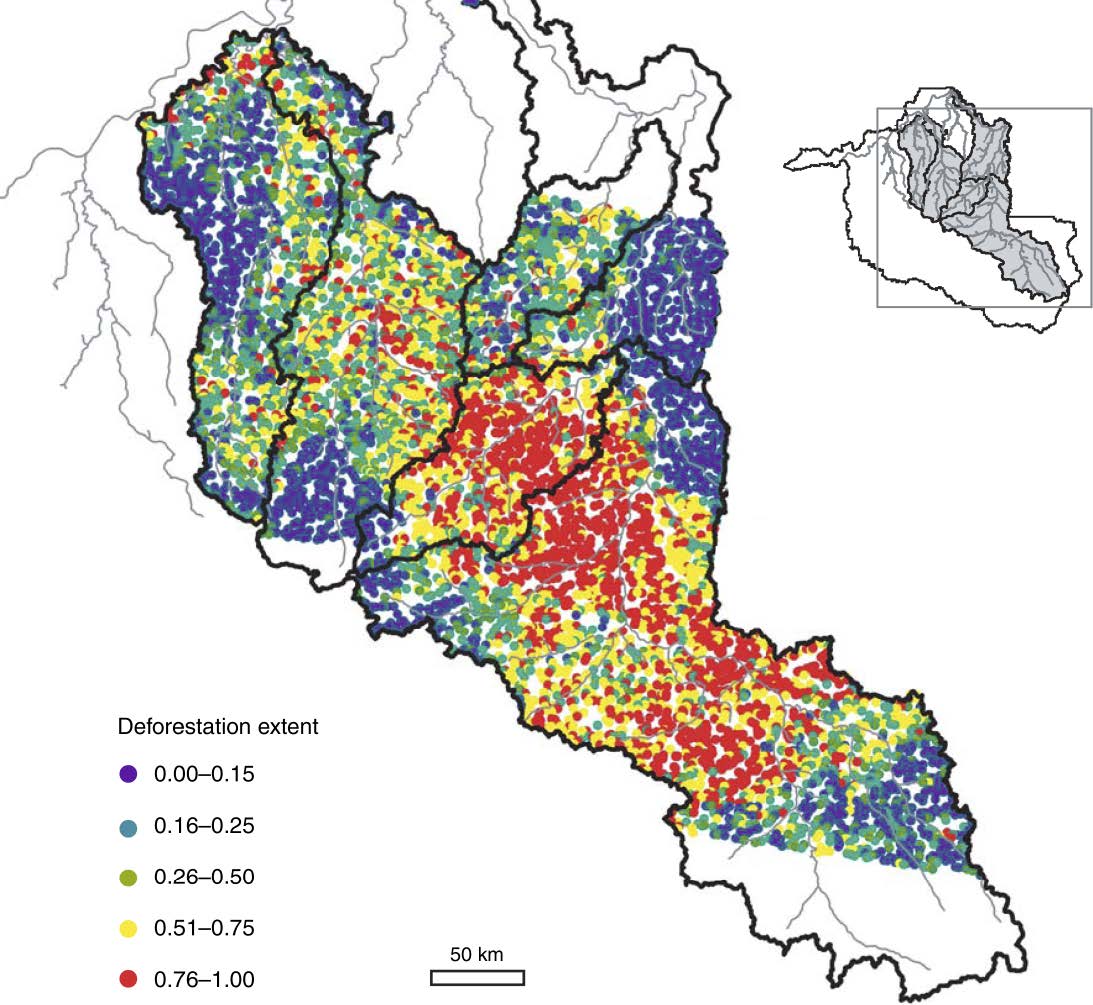
Figure 1. Map of the cumulative deforestation extent, 1999, in first-order watersheds (2.5–15 km2). Each dot represents one watershed (Biggs et al., 2008).
Data Citation:
Cite this data set as follows:
Biggs, T.W., T. Dunne, D.A. Roberts and E.A.T. Matricardi. 2013. LBA-ECO ND-01 Watershed Deforestation from Landsat TM Series, Rondonia, Brazil: 1999. Data set. Available on-line [http://daac.ornl.gov] from Oak Ridge National Laboratory Distributed Active Archive Center, Oak Ridge, Tennessee, U.S.A. http://dx.doi.org/10.3334/ORNLDAAC/1159
Implementation of the LBA Data and Publication Policy by Data Users:
The LBA Data and Publication Policy [http://daac.ornl.gov/LBA/lba_data_policy.html] is in effect for a period of five (5) years from the date of archiving and should be followed by data users who have obtained LBA data sets from the ORNL DAAC. Users who download LBA data in the five years after data have been archived must contact the investigators who collected the data, per provisions 6 and 7 in the Policy.
This data set was archived in May 2013. Users who download the data between May 2013 and April 2018 must comply with the LBA Data and Publication Policy.
Data users should use the investigator contact information in this document to communicate with the data provider.
Data users should use the Data Set Citation and other applicable references provided in this document to acknowledge use of the data.
Table of Contents:
- 1 Data Set Overview
- 2 Data Characteristics
- 3 Applications and Derivation
- 4 Quality Assessment
- 5 Acquisition Materials and Methods
- 6 Data Access
- 7 References
1. Data Set Overview:
Project: LBA (Large-Scale Biosphere-Atmosphere Experiment in the Amazon)
Activity: LBA-ECO
LBA Science Component: Nutrient Dynamics
Team ID: ND-01 (Roberts / Barreto / Soares)
The investigators were Barreto, Paulo Goncalves; Roberts, Dar A.; Soares, Joao Vianei; Biggs, Trent W; Brandao Jr., Amintas de Oliveira; Chadwick, Oliver A.; Holmes, Karen W.; Monteiro, Andre L.; Numata, Izaya; Nunes, Samia Serra; Powell, Rebecca Lynn; Renno, Camilo and Souza Jr., Carlos Moreira de. You may contact Biggs, Trent W. (tbiggs@mail.sdsu.edu).
LBA Data Set Inventory ID: ND01_Watershed_Defor
This data set provides estimates of watershed deforestation, as a proportion of the total area of watersheds, in Rondonia, Brazil for 1999. Deforestation maps were determined for the main agricultural and surrounding forested areas of Rondonia using multiple Landsat TM scenes (Biggs et al. 2008). Cumulative deforestation estimates were derived from this time series of Landsat scenes from 1975 to 1999. To obtain watershed-level estimates of deforestation, watershed boundaries and stream networks were delineated by a flow accumulation algorithm using a 90-m resolution digital elevation model (DEM) from NASA's Shuttle Radar Topography Mission (SRTM). The results were watersheds of seven Strahler stream orders (1-7) with stream networks that closely matched those of the 1:100,000 topographic maps for the area. The watershed boundaries, classified by stream order, were overlain on the time series of deforestation maps to determine the cumulative deforestation extent in 1999.
This data set contains six ESRI ArcGIS shapefiles of the watershed boundaries for streams orders 2-7, the smallest watershed (second order) to the largest inclusive watershed (seventh order). The cumulative deforestation estimates, as a proportion of total area for each watershed, are available as a comma-delimited text file that can be related to the individual watershed boundary shapefiles. Cumulative deforestation data are available for first order streams, although not as a shapefile.
Related Data Sets:
- LBA-ECO ND-01 Streamwater and Watershed Characteristics, Rondonia, Brazil: 1998-1999 (Watershed characteristics and deforestation for the same region for 1998-1999)
2. Data Characteristics:
There are six zipped ESRI ArcGIS shapefiles (*.zip) and one ASCII comma separated file with this data set. The file names for the GIS files have the file extension .zip. When unzipped, each shape-file contains six files (*.shx, *.bdf, *.prj, *.sbn, *.sbx, and *.shp). Each shapefile is a polygon that represents watersheds at different stream order levels. A first-order stream is the smallest stream and the polygon represents that land area (or watershed) around the stream that drains into it.
GIS file names: orderX.zip where "X" represents the numbers 2 through 7, for example, order2.zip.
Each shape-file contains polygon geometry, with the following projection parameters:
Projected Coordinate System: WGS_1984_UTM_Zone_20S
Projection: Transverse_Mercator
False_Easting: 500000.00000000
False_Northing: 10000000.00000000
Central_Meridian: -63.00000000
Scale_Factor: 0.99960000
Latitude_Of_Origin: 0.00000000
Linear Unit: Meter
Geographic Coordinate System: GCS_WGS_1984, Datum: D_WGS_1984
Prime Meridian: Greenwich
Angular Unit: Degree
Fields common to all files:
FID: Unique object ID
Shape: Type of shape, equal to polygon for all objects
Orderx_: a unique ID of individual watersheds for order x. This field can be related to the "ID" field in
the Deforestation_watersheds.csv file containing cumulative deforestation information by watershed.
Order7: The ID of the seventh-order watershed containing the
polygon
X_coord: UTM x-coordinate of the watershed centroid
Y_coord: UTM
y-coordinate of the watershed centroid
Area: Watershed area in meters^2
The ASCII comma separated file Deforestation_watersheds.csv contains calculated cumulative deforestation for each watershed.
Deforestation_watersheds.csv
| Column | Heading | Units/format | Description |
|---|---|---|---|
| 1 | Stream_order | Stream order | |
| 2 | ID | Stream identification | |
| 3 | Area_m2 | m2 | Watershed area in meters squared |
| 4 | Area_km2 | km2 | Watershed area in kilometers squared |
| 5 | Deforestation99_timeseries | Proportion of the watershed area identified as deforested using a time series approach (corresponds to f1999 in Biggs et al., 2008) | |
| 6 | Deforestation98_mosaic | Proportion of the watershed area identified as deforested from the 1998 snapshot mosaic (as used in Biggs et al., 2004) |
Example data records:
|
Stream_order,ID,Area_m2,Area_km2,Deforestation99_timeseries,Deforestation98_mosaic 1,6879,2510000,2.51,0.86,0.85 1,6022,2510000,2.51,0.12,0.34 1,7810,2510000,2.51,0.92,0.87 ... 3,567,43540000,43.54,0.58,0.58 3,238,44060000,44.06,0.27,0.27 3,126,44130000,44.13,0.8,0.8 ... 6,27,39465680896,39465.68,0.56,0.48 7,4,29392449536,29392.45,0.36,0.33 7,2,64127909888,64127.91,0.51,0.46 |
Site boundaries: (All latitude and longitude given in decimal degrees)
| Site (Region) | Westernmost Longitude | Easternmost Longitude | Northernmost Latitude | Southernmost Latitude | Geodetic Datum |
|---|---|---|---|---|---|
| Rondonia | -65 | -60 | -8 | -13.5 | World Geodetic System, 1984 (WGS-84) |
Time period: Landsat scenes from 1975-1999 to determine the cumulative effect for 1999.
Platform/Sensor/Parameters measured include:
- DIGITAL ELEVATION MODEL / DIGITIZER / MAPS
- DIGITAL ELEVATION MODEL / DIGITIZER / WATERSHED CHARACTERISTICS
3. Data Application and Derivation:
Typical application of data: Cartography
The delineation was performed using a digital elevation model (DEM) from NASA SRTM, 90-m-resolution. The delineation was implemented in ArcInfo-hydrologic analysis tools, including sink fill, flow direction, flow accumulation, watershed delineation, and stream order. Stream ordering follow the Strahler method. The threshold determining the smallest watershed delineated was 2.5 km2, which resulted in a stream network that corresponded most closely with the blue lines on available topographic maps (1:100,000).
4. Quality Assessment:
Positional accuracy: DEM resolution and quality sets the spatial resolution and quality of the data set. The most uncertain boundaries are for small watersheds in flat areas, where the flow direction and delineation algorithms have difficulty and generate long, thin watersheds. This is most prevalent in the northern part of the study area for order 1 and order 2 watersheds. Watershed boundaries for all other watersheds are deemed accurate based on field knowledge and comparison with watersheds delineated using topographic maps.
Cumulative deforested area: The accuracy, assessed using airborne videography, was greater than 85%.
5. Data Acquisition Materials and Methods:
Site:
The Brazilian State of Rondonia lies in the southwestern Amazon Basin on the border with Bolivia. Closed-and open-canopy tropical rainforest dominate the original vegetation cover (RADAMBRASIL, 1978). Large-scale colonization of Rondonia began with the construction of the BR-364 highway in the late 1960s (Goza 1994). The population reached 1.3 million people by the year 2000, and approximately 53,000 km2 (25%) of the forest was cleared for cropping and pasture by 1993 (Pedlowski et al. 1997). Land in Rondonia has been zoned for different uses, including agriculture (51% of the state's area); extraction of forest products such as nuts, rubber, fruit, and limited selective logging (14%), and protection of forest for indigenous peoples, parks, and biological reserves (35%). The main agricultural corridor accounted for 99% of the area zoned for agriculture in Rondonia in 1999. The corridor consists of one contiguous block of land that encompasses 117,940 km2, and extends approximately 600 km along highway BR-364 115-300 km wide, and runs perpendicular to the highway. The 35 protected areas in the state border the agricultural zone on both sides and encompass 83,000 km2. Ninety percent of the protected area occurs in seven separate zones between 2,150 and 42,000 km2.
Figure 2. Landsat TM images used to construct time series for determining deforestation extent in Rondonia, Brazil. The most recent image analyzed was from 1999 (Biggs et al., 2008).
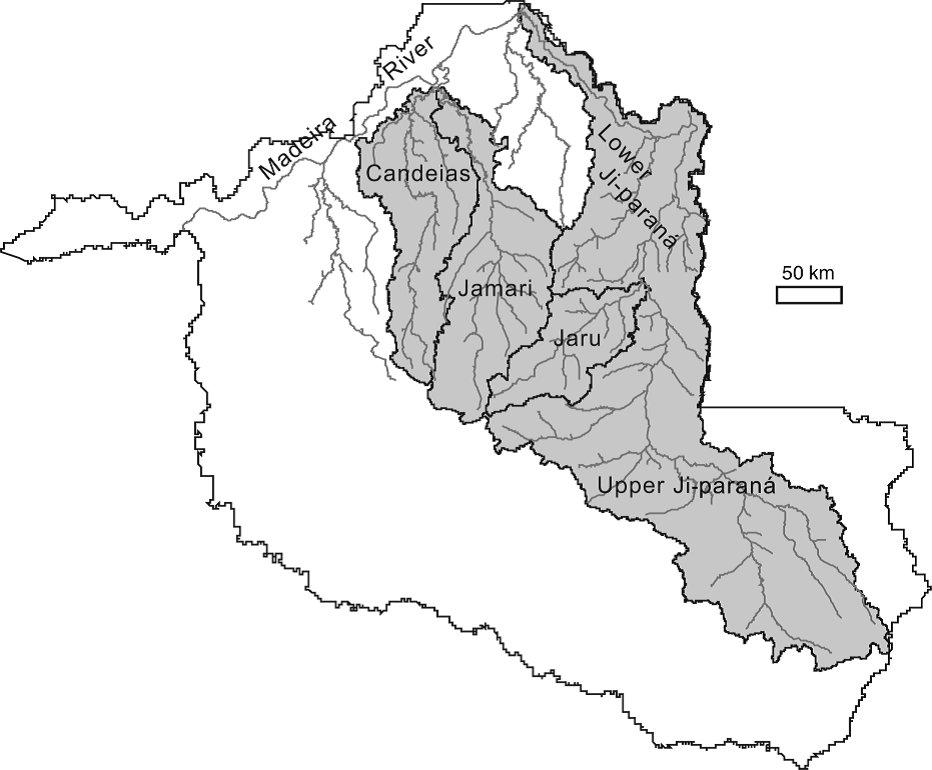
Figure 3. Major river systems of Rondonia included in the study area. The Candeais, Jamari, Jaru, and Upper Ji-Parana are sixth-order watersheds, and the upper and lower Ji-Parana combined is a seventh-order watershed (Biggs et al., 2008).
Deforestation Maps and Classification:
Deforestation99_timeseries:
- Proportion of the watershed area identified as deforested using a time series approach (corresponds to f1999 in Biggs et al., 2008)
The main agricultural corridor and surrounding forested areas of Rondonia were covered by five Landsat TM scenes. A time series of deforestation maps from 1975 to 1999 was made for those scenes by Roberts et al. (2002), who classified the imagery into seven classes (primary forest, pasture, second growth, soil/urban, rock/savanna, water, and cloud) using spectral mixture analysis.
Two aggregate classes, forest and deforested, were defined from those seven classes. The forest aggregate class contained primary forest, water, cloud, and rock/savanna. The deforested class included pasture, soil/urban, and second-growth. The forest, pasture, and second growth classes accounted for 98% of the study area, including water, cloud, and rock/savanna with the forest class and soil/urban with the deforested class had minimal impact on the results.
The cumulative deforested area for each year included all areas that classified as deforested in the given year and any previous image. Images were not available for all years. The cumulative deforestation extent in 1999 (f1999) was determined using all five scenes and included all pixels that classified as pasture or secondary growth using spectral mixture analysis. The remote sensing definition of deforestation did not include other anthropogenic processes, including subcanopy fires or disturbances smaller than 30 by 30 m that may impact tropical forests (Nepstad et al., 1999).
Watershed boundary delineation:
- Proportion of the watershed area identified as deforested from the 1998 snapshot mosaic (as used in Biggs et al., 2004)
A 90-m resolution DEM from NASA's SRTM was used to delineate watershed boundaries. The final data set had 8,994 watersheds of seven Strahler orders with drainage areas ranging from 2.5 to 64,127 km2 (the Ji-Parana basin). An eight-direction flow-accumulation algorithm delineated the stream network and watershed boundaries, as coded in ArcInfo (Jenson and Dominique, 1988). The minimum watershed area was set to 2.5 km2, which yielded a stream network that most closely matched the stream network of 1:100 000 topographic maps.
Most of the Rondonia study area had sufficient relief to yield channel networks that closely matched the blue lines of the 1:100 000 topographic maps. The seven Strahler orders did not have mutually exclusive area bins (e.g., the largest watersheds of order 2 were larger than the smallest watersheds of order 3). Watersheds less than 90% covered by the Landsat TM data were excluded from the analysis.
The watershed boundaries were overlain on the time series of deforestation maps to determine the cumulative deforestation extent in 1999 (Biggs et al., 2008).
6. Data Access:
This data is available through the Oak Ridge National Laboratory (ORNL) Distributed Active Archive Center (DAAC).
Data Archive Center:
Contact for Data Center Access Information:
E-mail: uso@daac.ornl.gov
Telephone: +1 (865) 241-3952
7. References:
Biggs, T.W., T. Dunne, D.A. Roberts and E. Matricardi. 2008. The rate and extent of deforestation in watersheds of the southwestern Amazon Basin. Ecological Applications 18: 31-48.
Biggs, T. W., T. Dunne, and L. A. Martinelli. 2004. Natural controls and human impacts on stream nutrient concentrations in a deforested region of the Brazilian Amazon basin. Biogeochemistry 68:227-257.
Goza, F. 1994. Brazilian frontier settlement the case of Rondonia. Population and Environment 16:37-60. Jenson, S. K., and J. O. Dominique. 1988. Extracting topographic structure from digital elevation data for geographic information system analysis. Photogrammetric Engineering and Remote Sensing 54:1593-1600.
Nepstad, D. C., A. Verissimo, A. Alencar, C. Nobre, E. Lima, P. Lefebvre, P. Schlesinger, C. Potter, P. Moutinho, E. Mendoza, M. Cochrane, and V. Brooks. 1999. Large-scale impoverishment of Amazonian forests by logging and fire. Nature 398:505-508.
Pedlowski, M. A., V. H. Dale, E. A. T. Matricardi, and E. P. da Silva Filho. 1997. Patterns and impacts of deforestation in Rondonia, Brazil. Landscape and Urban Planning 38:149-157.
RADAMBRASIL. 1978. Levantamento de recursos naturais. Ministerio das Minas e Energia, Rio de Janeiro, Brazil.
Roberts, D. A., I. Numata, K. Holmes, G. Batista, T. Krug, A. Monteiro, B. Powell, and O. A. Chadwick. 2002. Large area mapping of land-cover change in Rondonia using multitemporal spectral mixture analysis and decision tree classifiers. Journal of Geophysical Research 107: 8073, JD000374.
Tribe, A. 1992. Automated recognition of valley lines and drainage networks from grid digital elevation models: a review and a new method. Journal of Hydrology 139:263-293.