Get Data
Summary:
This data set provides the results of spectral reflectance (350 to 2,500 nm at 1-nm increments) and biophysical measurements on grass pastures in eight cattle ranches in the state of Rondonia, located in the southwestern Brazilian Amazon. The ranches are located near the cities of Porto Velho, Ariquemes, Ouro Preto, Ji-Parana, and Presidente Medici. Field measurements were collected in July and August 2003.
The primary grass species sampled were Brachiaria brizantha and Brachiaria decumbens. Spectrometer measurements were taken at 5-m intervals along 100 m transects on the pastures - fourteen total transects. Vegetation was sampled at 20-m intervals along the transects. All standing biomass and litter on the soil surface were collected and separated into live and senesced biomass and then dried to calculate water content. Sixty-eight reflectance spectra coincided with grass biophysical samples.
Note that the research was done on private lands in Rondonia, and to protect the privacy of those land owners no geographic information is associated with the reported measurements.
Three data files are included: an ENVI spectral library file with reflectance data for 484 pasture sampling points, an ASCII comma-separated file with reflectance data for the 484 pasture sampling points, and an ASCII comma-separated file with the biophysical measurements.
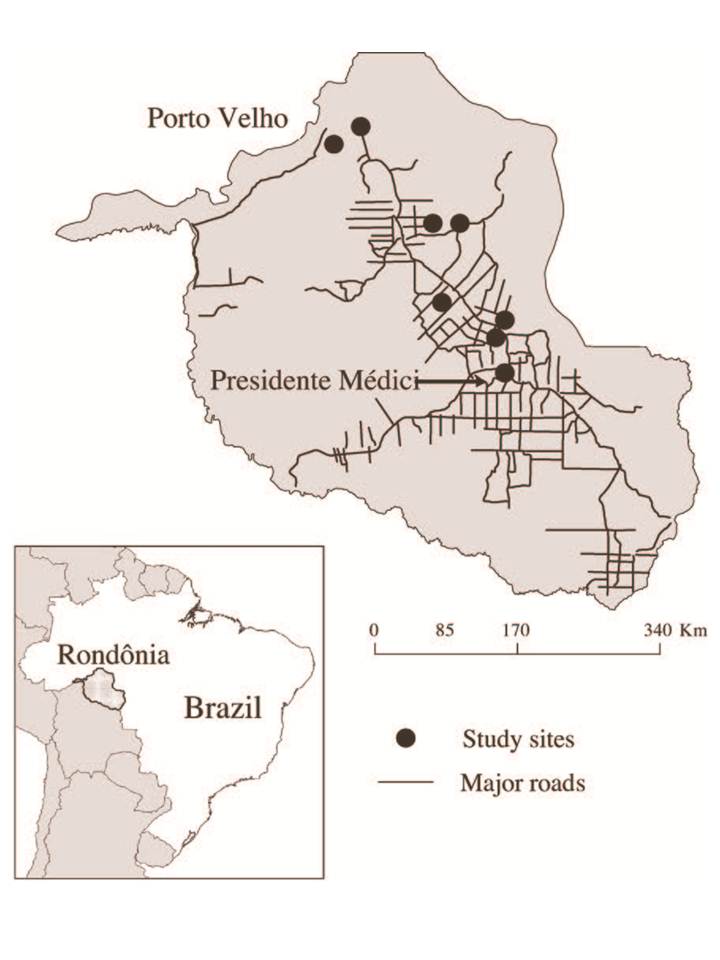
Fig. 1. Study area showing study sites distributed from Porto Velho to Presidente Médici, Rondonia, Brazil.
Data Citation:
Cite this data set as follows:
Numata, I., D.A. Roberts, O.A. Chadwick, J.P. Schimel, L.S. Galvao and J.V. Soares. 2013. LBA-ECO ND-01 Reflectance and Biophysical Measures, Grass Pastures: Rondonia, Brazil. Data set. Available on-line (http://daac.ornl.gov) from Oak Ridge National Laboratory Distributed Active Archive Center, Oak Ridge, Tennessee, U.S.A. http://dx.doi.org/10.3334/ORNLDAAC/1154
Implementation of the LBA Data and Publication Policy by Data Users:
The LBA Data and Publication Policy [http://daac.ornl.gov/LBA/lba_data_policy.html] is in effect for a period of five (5) years from the date of archiving and should be followed by data users who have obtained LBA data sets from the ORNL DAAC. Users who download LBA data in the five years after data have been archived must contact the investigators who collected the data, per provisions 6 and 7 in the Policy.
This data set was archived in April 2013. Users who download the data between April 2013 and March 2018 must comply with the LBA Data and Publication Policy.
Data users should use the Investigator contact information in this document to communicate with the data provider.
Data users should use the Data Set Citation and other applicable references provided in this document to acknowledge use of the data.
Table of Contents:
- 1 Data Set Overview
- 2 Data Characteristics
- 3 Applications and Derivation
- 4 Quality Assessment
- 5 Acquisition Materials and Methods
- 6 Data Access
- 7 References
1. Data Set Overview:
Project: LBA (Large-Scale Biosphere-Atmosphere Experiment in the Amazon)
Activity: LBA-ECO
LBA Science Component: Nutrient Dynamics
Team ID: ND-01 (Roberts / Barreto / Soares)
The investigators were Barreto, Paulo Goncalves; Roberts, Dar A.; Soares, Joao Vianei; Biggs, Trent W; Brandao Jr., Amintas de Oliveira; Chadwick, Oliver A.; Holmes, Karen W.; Monteiro, Andre L.; Numata, Izaya ; Nunes, Samia Serra; Powell, Rebecca Lynn; Renno, Camilo and Souza Jr., Carlos Moreira de . You may contact Numata, Izaya (izaya.numata@sdstate.edu).
LBA Data Set Inventory ID: ND01_Pasture_Spectra
This data set provides the results of spectral reflectance (350 to 2,500 nm at 1-nm increments) and biophysical measurements on grass pastures in eight cattle ranches in the state of Rondonia, located in the southwestern Brazilian Amazon. The ranches are located near the cities of Porto Velho, Ariquemes, Ouro Preto, Ji-Parana and Presidente Medici. Field measurements were collected in July and August of 2003.
The primary grass species sampled were Brachiaria brizantha and Brachiaria decumbens. Spectrometer measurements were taken at 5 m intervals along 100 m transects on the pastures - fourteen total transects. Vegetation was sampled at 20-m intervals along the transects. All standing biomass and litter on the soil surface were collected and separated into live and senesced biomass and then dried to calculate water content. Sixty-eight reflectance spectra coincided with grass biophysical samples.
Note that the research was done on private lands in Rondonia, and to protect the privacy of those land owners no geographic information is associated with the reported measurements.
2. Data Characteristics:
Data are available in three files:
File 1: Pasture_Rondonia_ASD_spectral_library_all.hdr
- ENVI spectral library file with reflectance data for 484 pasture sampling points. ENVI spectral library has associated header file (.hdr)
File 2: AllSpectra_Values.csv
- ASCII comma-separated file with reflectance data for 484 pasture sampling points. Sampling points with corresponding biophysical measurements (68) are indicated.
File 3: Pasture_spectra_biophysical_measurements.csv
- ASCII comma-separated file with the biophysical measurements that where collected at selected sampling points (68).
File 1: Pasture_Rondonia_ASD_spectral_library_all.hdr
Data organization for the ENVI file of spectra values is described in the associated header file as follows:
ENVI
description = {New spectral library file [Tue Sep 25 11:28:44 2012]}
samples = 2151
lines = 484
bands =1
header offset = 0
file type = ENVI Spectral Library
data type = 5
interleave = bsq
sensor type = Unknown
byte order = 0
wavelength units = Nanometers
reflectance scale factor = 1.000000
z plot titles = {Wavelength, Value}
band names = {Spectral Library}
spectra names={....}
wavelength = {350.00000 through 2500.00000)
File 2: AllSpectra_Values.csv
| Column | Heading | Units/format | Description |
|---|---|---|---|
| 1 | Point_ID | Point identification: the first two letters indicate the ranch sampled; the following letter indicates the transect at the ranch, and the final characters are the distance along the transect in meters at which the sampling was done. When the final characters are not numbers, soil indicates areas with no vegetation, a dead tree was sampled as a representation of non-photosynthetic vegetation (NPV), and a live palm as a representation of green vegetation (GV). There are 484 sampling points. | |
| 2 | Biomass | Column identifies sampling points with corresponding biophysical measurements. Values are either "Biomass" or "No". These 68 points correspond to biophysical measurements in data file: Pasture_spectra_biophysical_measurements.csv | |
| 3-2153 | Wavelength (350-2500 at 1-nm increments) | dimensionless | Reflectance values (mean of five measurements) for wavelengths 350 through 2500 nm. |
| Additional descriptive information for the Point_IDs (i.e., ranch abbreviation, County, date sampled, and Grass Species) are listed in the accompanying documentation. | |||
File 3: Pasture_spectra_biophysical_measurements.csv
ASCII comma separated file with the biophysical measurements that where collected at selected sampling points (68). Point_IDs with biophysical measurements are identified in the AllSpectra_Values.csv data file.
| Column | Heading | Units/format | Description |
|---|---|---|---|
| 1 | Point_ID | Point identification, the first two or three letters indicate the farm sampled, the following letter indicates the transect at the farm and the final number the distance along the transect in meters at which the sampling was done | |
| 2 | County | County within the state of Rondonia in which sampling was done | |
| 3 | Date | YYYYMMDD | Sampling date |
| 4 | Species | Scientific name of the grass species dominant at the sampling point. Bare soil indicates areas with no vegetation; a dead tree was sampled as a representation of NPV and a live palm as a representation of GV | |
| 5 | Biomass_live | g/m2 | Live aboveground biomass based on oven dry weights reported in grams per meter squared (g/m2) |
| 6 | Biomass_senesced | g/m2 | Senesced aboveground biomass based on oven dry weights reported in grams per meter squared (g/m2) |
| 7 | Biomass_total | g/m2 | Total aboveground biomass calculated as the sum of the previous two columns and reported in grams per meter squared (g/m2) |
| 8 | Water_content | g/m2 | Water content of the total aboveground biomass reported in grams per meter squared (g/m2) |
| Missing data are indicated by -9999 | |||
Example data records:
|
Point_ID,County,Date,Species,Biomass_live,Biomass_senesced,Biomass_total,Water_content ar_a_000,Porto Velho,20030801,Brachiaria brizantha,496.4,221.4,717.8,218.64 ar_a_020,Porto Velho,20030801,Brachiaria brizantha,541.76,188.52,730.28,256.32 ar_a_040,Porto Velho,20030801,Brachiaria brizantha,254.44,100.96,355.4,104.4 ... pr_c_010,Presidente Medici,20030721,Brachiaria brizantha,-9999,-9999,-9999,-9999 pr_c_015,Presidente Medici,20030721,Brachiaria brizantha,-9999,-9999,-9999,-9999 pr_c_020,Presidente Medici,20030721,Brachiaria brizantha,-9999,-9999,-9999,-9999 |
Site boundaries: (All latitude and longitude given in decimal degrees)
| Site (Region) | Westernmost Longitude | Easternmost Longitude | Northernmost Latitude | Southernmost Latitude | Geodetic Datum |
|---|---|---|---|---|---|
| Rondonia | -65 | -60 | -8 | -15 | World Geodetic System, 1984 (WGS-84) |
Time period:
- The data set covers the period 2003/07/19 to 2003/08/03.
- Temporal Resolution:spectral data and biomass measurements were done in one two- week campaign in July/Aug 2003
Platform/Sensor/Parameters measured include:
- FIELD INVESTIGATION / WEIGHING BALANCE / LITTER CHARACTERISTICS
- FIELD INVESTIGATION / WEIGHING BALANCE / BIOMASS
- FIELD INVESTIGATION / SPECTRORADIOMETER / REFLECTANCE
3. Data Application and Derivation:
Hyperspectral sensors provide a continuous spectrum that could improve on our current ability to measure biomass using broad-band remote sensing.
The spectral properties of vegetation are strongly determined by their biophysical and chemical attributes such as leaf area index (LAI), the amount of live and senesced biomass, moisture content, pigments (e.g., chlorophyll), and spatial arrangement of structures. Deriving meaningful and accurate measures to quantitatively characterize vegetation still remains a challenge in remote sensing. We used a hyperspectral sensor to test its potential to estimate biophysical properties of grazed pastures in Rondonia in the Brazilian Amazon. Using a field spectrometer, ten remotely sensed measurements (i.e., two vegetation indices, four fractions of spectral mixture analysis, and four spectral absorption features) were generated for two grass species, Brachiaria brizantha and Brachiaria decumbens. These measures were compared to above ground biomass, live and senesced biomass, and grass canopy water content (Numata et al. 2008).
4. Quality Assessment:
Grass reflectance is affected by canopy structural factors including leaf area, leaf orientation and angular distributions, density of reflective or absorptive structures and the spatial arrangement of structures. These factors can vary within and between species.
ASD field of view (FOV) projected on the grass canopy and 50 cm by 50 cm plot for grass biomass measurements did not perfectly match, and many times these two data types collected from the same site were not spatially well calibrated.This mis-registration between grass biophysical data and spectral data possibly resulted in poor relationships.
Changes in substrate reflectance beneath the grass canopy, including soil and litter altered grass reflectance and were more pronounced for areas with low- standing biomass. Depending upon the background, i.e., soil or litter, the resulting reflectance can change dramatically. In the case of B. decumbens, soil background yields a low ligno-cellulose absorption depth value, while the litter background results in a high ligno-cellulose absorption depth value.
These spectra were standardized to a Spectralon (Labsphere, Inc., North Sutton, NH) reference surface measured at approximately 10 minute intervals (Numata et al. 2008).
5. Data Acquisition Materials and Methods:
Study sites:
The state of Rondonia is located in the southwestern Brazilian Amazon. Eight cattle ranches were used for this study, distributed in the cities of Porto Velho, Ariquemes, Ouro Preto, Ji-Parana and Presidente Medici. The exact locations of the ranches are not provided.
Soil types are related to geology and topography of this region. Oxisols and Ultisols, both dystrophic soils, are found mostly over the Precambrian granitoid and meta-supracrustal rocks with predominantly flat topography in the north of the state, while Alfisols are distributed mainly in central of Rondonia to the south, where they coincide with the presence of intrusive basic and ultrabasic rocks with gently rolling topography.
Pasture sampling:
Pasture biophysical and spectral measurements were obtained from the eight cattle ranches. Within each study site, measurements were taken from 100-m transects on the pastures. In total, fourteen transects were used for grass measurements in this study. Nine transects consisted of Brachiaria brizantha, mostly used for beef pasture, and the rest were of Brachiaria decumbens, primarily utilized for dairy pasture.
Table 1. Ranch location, date sampled, and grass species and other surfaces measured.
| Ranch | County | Date Sampled | Species |
|---|---|---|---|
| ar | Porto Velho | 20030801 | Brachiaria brizantha |
| ar | Porto Velho | 20030801 | Bare soil |
| fe | Presidente Medici | 20030720 | Brachiaria brizantha |
| ja | Presidente Medici | 20030730 | Brachiaria brizantha |
| ja | Presidente Medici | 20030719 | Brachiaria brizantha |
| lc | Ji Parana | 20030722 | Brachiaria decumbens |
| ns | Ouro Preto | 20030723 | Brachiaria decumbens |
| ns | Ouro Preto | 20030723 | Brachiaria brizantha |
| ns | Ouro Preto | 20030723 | Brachiaria humidicola |
| ns | Ouro Preto | 20030723 | Bare soil |
| pr | Presidente Medici | 20030721 | Brachiaria brizantha |
| sa | Porto Velho | 20030803 | Brachiaria brizantha |
| sa | Porto Velho | 20030803 | Bare soil |
| sa | Porto Velho | 20030803 | Babacu (GV) |
| sn | Ariquemes | 20030724 | Brachiaria brizantha |
| sn | Ariquemes | 20030724 | Dead tree (NPV) |
| sn | Ariquemes | 20030724 | Bare soil |
Field spectral measurements:
An ASD full range spectrometer (350 to 2,500 nm), on loan from the Jet Propulsion Laboratory (JPL), was used for field optical measurements over transects. The ASD measurements were conducted for all transects. The ASD spectra were collected with a 22-degree FOV with a 1-m sensor height above grass canopies. The spectra were collected at 5-m intervals along each transect, however, for comparative analysis with grass biophysical data, we used only those spectra collected at the same plots, i.e., at 20-m intervals along the transects, used for grass biomass sampling. All spectral measurements were collected within 2 h of local solar noon under clear-sky conditions. Five measurements were taken for each grass canopy, and the average of the five replicates was reported. These spectra were standardized to a Spectralon (Labsphere, Inc, North Sutton, NH) reference surface measured at approximately 10 minute intervals, and converted into reflectance. In total, 68 reflectance spectra coincided with grass biophysical samples.
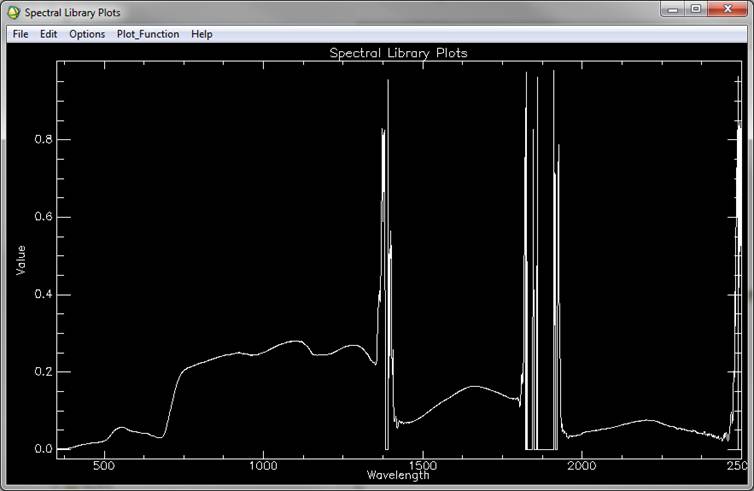
Figure 2. Typical grass canopy reflectance spectra as visualized from the ENVI spectral library file.
Biophysical measurements:
After collecting grass reflectance spectra, all standing biomass and litter on the soil surface within a 50-cm by 50-cm quadrat were collected at 20-m intervals along each 100-m transect (i.e., six biomass samples per transect). The standing biomass was separated into live and senesced biomass. To avoid mismatching between the ASD FOV and the 50-cm by 50-cm sampling quadrat for grass biomass, a reference stack was placed at the center of each measurement plot for biomass clipping after ASD measurements. All grass materials, live, senesced, and litter were weighed soon after clipping and then dried at 70 degrees C for 36 h. Dried grass materials were weighed again in order to calculate grass water content. During this process, some grass materials were damaged or lost, and in total, 68 grass sample results are reported.
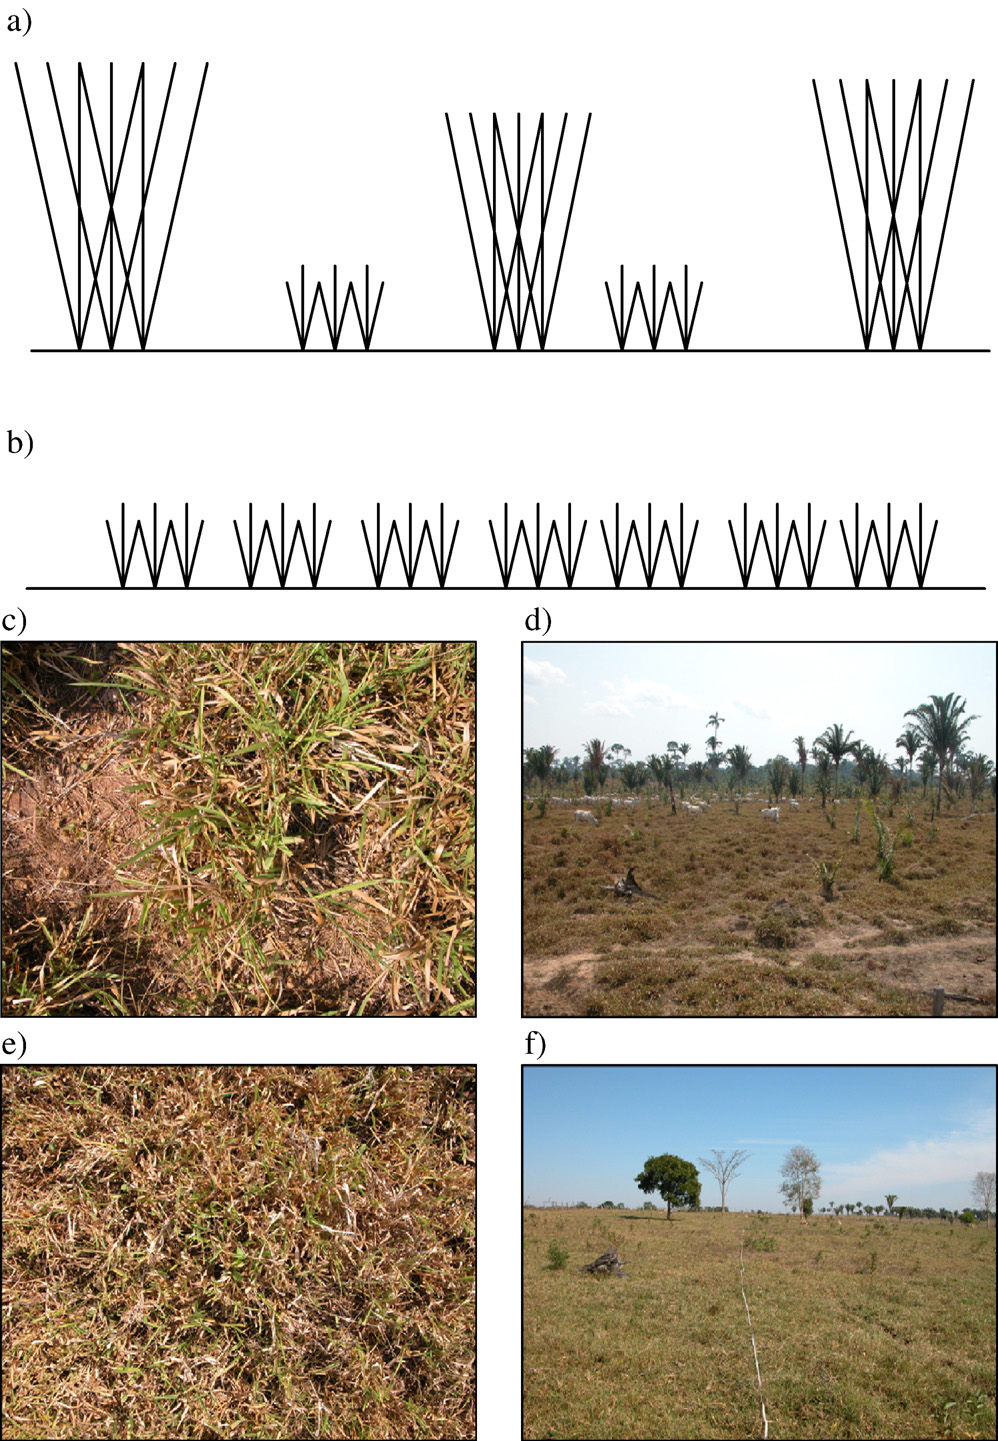
Figure 3. Grass structures. a) B. brizantha, b) B. decumbens, c) Canopy of B. brizantha, d) overview of B. brizantha, e) canopy of B. decumbens, and f) overview of B. decumbens.
6. Data Access:
These data are available through the Oak Ridge National Laboratory (ORNL) Distributed Active Archive Center (DAAC).
Data Archive Center:
Contact for Data Center Access Information:
E-mail: uso@daac.ornl.gov
Telephone: +1 (865) 241-3952
References
Numata, I., D.A. Roberts, O.A. Chadwick, J.P. Schimel, L.S. Galvao and J.V. Soares. 2008. Evaluation of hyperspectral data for pasture estimate in the Brazilian Amazon. Remote Sensing of Environment 112: 1569-1583.