Get Data
Summary:
This data set provides the results of analyses of Landsat Enhanced Thematic Mapper Plus (ETM+) images for selective logging activity in the Brazilian states of Para, Mato Gross, Rondonia, Roraima, and Acre over the years 1999 through 2001.
Images were analyzed using the Carnegie Landsat Analysis System (CLAS) to detect and to quantify the amount of damage due to selective logging in the major timber-production states of the Brazilian Amazon. This approach provided automated image analysis using atmospheric modeling for detection of forest canopy openings, surface debris, and bare soil exposed by forest disturbances; and pattern-recognition techniques. CLAS provides detailed measurements of forest-canopy damage at a spatial resolution of 30 x 30 m.
Fifteen GeoTiff format files are included -- one for each of the three years from 1999-2001 for each of the five states. Each GeoTiff is a single band image where each pixel represents if logging activity was or was not detected. A zero (0) value indicates that no logging was detected, while a value of one (1) indicates that damage from logging was detected. The 15 GeoTiff (*.tif) files have been compressed into one *.zip file.
Figure 1. Spatial distribution of selective logging in five timber-production states of the Brazilian Amazon for the year intervals 1999–2000 (red), 2000–2001 (blue), and 2001–2002 (green). Light gray areas show the extent of indigenous reserves; dark gray areas delineate federal conservation lands (Asner et al., 2005).
Data Citation:
Cite this data set as follows:
Asner, G.P., D.E. Knapp, E.N. Broadbent, P.J.C. Oliveira, M.M. Keller, and J.N.M. Silva. 2013. LBA-ECO LC-21 Selective Logging Activity in the Brazilian Amazon: 1999-2002. Data set. Available on-line [http://daac.ornl.gov] from Oak Ridge National Laboratory Distributed Active Archive Center, Oak Ridge, Tennessee, USA http://dx.doi.org/10.3334/ORNLDAAC/1172
Users of this data should also cite the following paper:
Asner, Gregory P., David E. Knapp, Eben N. Broadbent, Paulo J.C. Oliveira, Michael Keller, and Jose N. Silva. 2005. Selective Logging in the Brazilian Amazon. Science 310:480-482.
Implementation of the LBA Data and Publication Policy by Data Users:
The LBA Data and Publication Policy [http://daac.ornl.gov/LBA/lba_data_policy.html] is in effect for a period of five (5) years from the date of archiving and should be followed by data users who have obtained LBA data sets from the ORNL DAAC. Users who download LBA data in the five years after data have been archived must contact the investigators who collected the data, per provisions 6 and 7 in the Policy.
This data set was archived in July 2013. Users who download the data between July 2013 and June 2018 must comply with the LBA Data and Publication Policy.
Data users should use the Investigator contact information in this document to communicate with the data provider. Alternatively, the LBA website [http://lba.inpa.gov.br/lba/] in Brazil will have current contact information.
Data users should use the Data Set Citation and other applicable references provided in this document to acknowledge use of the data.
Table of Contents:
- 1 Data Set Overview
- 2 Data Characteristics
- 3 Applications and Derivation
- 4 Quality Assessment
- 5 Acquisition Materials and Methods
- 6 Data Access
- 7 References
1. Data Set Overview:
Project: LBA (Large-Scale Biosphere-Atmosphere Experiment in the Amazon)
Activity: LBA-ECO
LBA Science Component: Land Use and Land Cover
Team ID: The investigators were Asner, Gregory Paul; Bustamante, Mercedes M.C.; Silva, Jose Natalino Macedo; Broadbent, Eben North; Carlson, Kim; Carvalho, Ana Paula Ferreira; Hare, Anna Quinn; Huang, Maoyi; Knapp, David E.; Martin, Roberta Enders; Oliveira, Paulo Jose Silva Costa; Prado, Zayra Azeredo; Silva, Jose Salomao Oliveira and Villagomez, April Marie. You may contact Knapp, David E. (deknapp@stanford.edu).
LBA Data Set Inventory ID: LC-21_Selective_Logging
This data set provides the results of analyses of Landsat Enhanced Thematic Mapper Plus (ETM+) images for selective logging activity in the Brazilian states of Para, Mato Gross, Rondonia, Roraima, and Acre over the years 1999 through 2001.
Images were analyzed using the Carnegie Landsat Analysis System (CLAS) to detect and to quantify the amount of damage due to selective logging in the major timber-production states of the Brazilian Amazon. This approach provided automated image analysis using atmospheric modeling for detection of forest canopy openings, surface debris, and bare soil exposed by forest disturbances; and pattern-recognition techniques. CLAS provides detailed measurements of forest-canopy damage at a spatial resolution of 30 x 30 m (Asner et al., 2005).
Related Data Set:
Asner, G.P., D.E. Knapp, E.N. Broadbent, P.J.C. Oliveira, M.M. Keller, and J.N.M. Silva. 2013. LBA-ECO LC-21 Brazilian Amazon Fractional Land Cover Images: 1999-2002. Data set. Available on-line (http://daac.ornl.gov) from Oak Ridge National Laboratory Distributed Active Archive Center, Oak Ridge, Tennessee, U.S.A. http://dx.doi.org/10.3334/ORNLDAAC/1152
Landsat Enhanced Thematic Mapper Plus (ETM+) imagery, for selected Brazilian states (Acre, Amapa, Amazonas, Maranhao, Mato Grosso, Para, Rondonia, and Roraima) for the years 1999-2002. The Landsat ETM+ images were processed to derive fractional land cover types (photosynthetic vegetation [PV], non-photosynthetic vegetation [NPV], and bare substrate) by application of the Carnegie Landsat Analysis System (CLAS) methodology. Fractional land cover types were used to determine selective logging damage for this data set.
2. Data Characteristics:
There is one compressed (*.zip) file (Selective_Logging.zip) with this data set, which when expanded, contains 15 GeoTIFF (.tif) image files. The images are from the Landsat Enhanced Thematic Mapper Plus (ETM+) satellite of the Brazilian states of Para, Mato Grosso, Rondônia, Roraima, and Acre, and have been processed with the Carnegie Landsat Analysis System (CLAS) as a means to detect and quantify the amount of selective logging in those states.
Each GeoTiff is a single band image where each pixel represents if logging was or was not detected. A zero (0) value indicates that no logging was detected, while a value of one (1) indicates that damage from logging was detected.
Image File Characteristics:
Resolution: 30 m x 30 m
Projected Coordinate System Name: World Goode Homolosine Land
Datum: Autholic Sphere, radius= 6370997.0
Central Meridian: 60.0 West
Units: meters
False Easting: -6671692.45708
False Northing: 0.0
There are three images for each of the five states, for three annual intervals of 1999-2000, 2000-2001, and 2001-2002. The files are named by state_Logging_PVC_YYYY.tif.
File name examples:
Acre_Logging_PVC_YYYY.tif: images of the state of Acre, Brazil,
where YYYY is 2000, 2001, or 2002.
MT_Logging_PVC_YYYY.tif:
images of the state of Mato Grosso, Brazil, where YYYY is 2000, 2001, or
2002.
Para_Logging_PVC_YYYY.tif: images of the state of Para, Brazil, where
YYYY is 2000, 2001, or 2002.
Rondonia_Logging_PVC_YYYY.tif: images of the state of Rondonia, Brazil,
where YYYY is 2000, 2001, or 2002.
Roraima_Logging_PVC_YYYY.tif:
images of the state of Roraima, Brazil, where YYYY is 2000, 2001, or 2002.
Site boundaries: (All latitude and longitude given in decimal degrees)
| Site (Region) | Westernmost Longitude | Easternmost Longitude | Northernmost Latitude | Southernmost Latitude | Geodetic Datum |
|---|---|---|---|---|---|
| Brazilian States: Para, Mato Gross, Rondonia, Roraima, and Acre | -74.184346 | -45.562397 | 5.250647 | -13.838767 | sphere of radius 6370997.0 |
Time period:
- The data set covers the period 1999/01/01 to 2002/12/31.
- Temporal Resolution: Annual
Platform/Sensor/Parameters measured include:
- Landsat / ETM+ (ENHANCED THEMATIC MAPPER PLUS) / DEFORESTATION
3. Data Application and Derivation:
These data can be used to identify areas of logging activity. Since the image pairs that were used to create these mosaics have varying acquisition dates, care should be taken in determining the total amount of logging for a one-year period.
4. Quality Assessment:
Extensive field validation studies showed that the detection of canopy damage within CLAS is precise and accurate. Field validation studies showed false-positive and false-negative detection rates of only 5%. Uncertainty caused by errors in atmospheric correction of satellite data, cloud cover, annualization, automated logging-area delineation, and manual auditing were 0.7 to 12.8%, individually. After combining all known sources of error, our analysis suggests an overall absolute uncertainty of up to 14% in total logging area (Asner et al., 2005).
5. Data Acquisition Materials and Methods:
Landsat Enhanced Thematic Mapper Plus (ETM+) satellite images were acquired for the Brazilian timber-production states of Para, Mato Grosso (the northern 58% of Mato Grosso with forested lands only), Rondonia, Roraima, and Acre. The images were analyzed using CLAS to detect and quantify the amount of selective logging in those states. CLAS is an automated processing system that includes: (i) atmospheric correction of satellite data; (ii) deconvolution of spectral signatures into sub-pixel fractional cover of live forest canopy, forest debris and bare substrates; (iii) cloud, water, and deforestation masking; and (iv) pattern recognition algorithms for forest disturbance mapping.
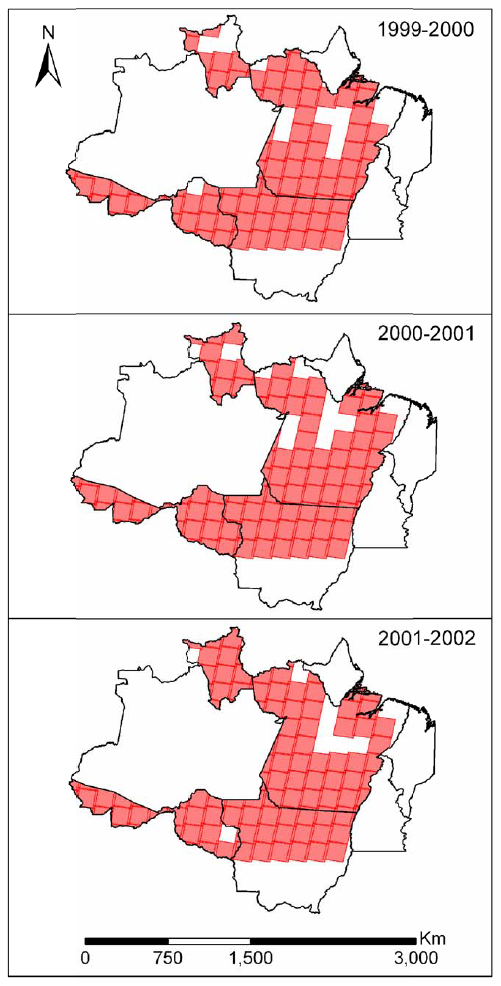
Figure 2. Geographic coverage of study, showing the Brazilian Legal Amazon with Landsat 7 satellite footprints.
CLAS Processing Steps (from Asner et al., 2005):
Image Preparation and Atmospheric Correction
The version of CLAS utilized ingested raw ETM+ satellite imagery and applied sensor gains and offsets to convert from digital number (DN) to exo-atmospheric radiance. The radiance data were passed to a fully automated version of the 6S atmospheric radiative transfer model (Vermote et al. 1997). The 6S program was integrated into the CLAS processing stream and used monthly averages of aerosol optical thickness (AOT) and water vapor (WV) values from the MODIS sensor onboard the NASA Terra spacecraft. Time-stamping of MODIS AOT and WV data with Landsat data was done on an automated basis.
Sub-pixel Analysis
The CLAS process relies upon the quantitative determination of fractional material cover at the sub-pixel scale (e.g., within each Landsat 30-x 30-m pixel). This core step employs a probabilistic spectral mixture sub-model. This process spectrally decomposed each image pixel into fractional cover estimates (0-100% cover) of PV (photosynthetic vegetation -- forest canopy) and NPV (non- photosynthetic vegetation -- surface woody and senescent vegetation material), and bare substrate. It is fully automated and uses a Monte Carlo Unmixing (AutoMCU) approach to derive uncertainty estimates of the sub-pixel cover fraction values (Asner et al., 2005).
Non-forest Masking and Atmospheric Compensation
A series of automated masks were designed to
exclude clouds, water bodies, cloud shadows, non-image and non-forest
areas (e.g., pasture, urban and agriculture) from the CLAS processing
stream.
- Clouds are masked using the thermal channel (band 6) from the raw Landsat images, prior to execution of the AutoMCU sub-model.
- Water bodies are masked by finding pixels in the calibrated Landsat reflectance data in which bands 1-4 (blue, green, red, and near-infrared) have a negative slope.
- Non-image areas containing zero values are also masked.
- Cloud shadows are identified using the RMS error image that results from the AutoMCU processing.
- To limit the logging analysis to forested areas, Landsat thermal band 6, combined with the AutoMCU results, was used to identify pixels containing primarily forest and non-forest areas. The minimum and maximum thermal thresholds, which encompass forested areas in the thermal mask, were dynamically generated for each image by calculating the mean thermal value of all pixels having a PV fraction cover greater than 80% and then masking all pixels with values > 15 DN from the mean thermal value.
Selective Logging Detection
The primary method by which logging was detected was image differencing, where pairs of AutoMCU sub-pixel fractional cover images, separated by approximately one year, were used to create images of PV (forest canopy) and NPV (surface woody and senescent vegetation material) change that indicate areas of relative canopy disturbance or recovery. Forest disturbances in these images always have reductions in PV, simultaneous with increases in NPV fractional cover.
6. Data Access:
This data is available through the Oak Ridge National Laboratory (ORNL) Distributed Active Archive Center (DAAC).
Data Archive Center:
Contact for Data Center Access Information:
E-mail: uso@daac.ornl.gov
Telephone:
+1 (865) 241-3952
7. References:
Asner, G.P., D.E. Knapp, E.N. Broadbent, P.J.C. Oliveira, M. Keller, J.N. Silva. 2005. Selective Logging in the Brazilian Amazon. Science 310:480-482.
Asner, G.P., D.E. Knapp, A.N. Cooper, M.M.C. Bustamante, and L.P. Olander. 2005. Ecosystem Structure throughout the Brazilian Amazon from Landsat Observations and Automated Spectral Unmixing. Earth Interactions 9(7):1-31.
Vermote, E.F., D. Tanre, J. L. Deuze, M. Herman, J. J. Morcrette, IEEE Trans. Geosci. Rem. Sens. 35, 675 (1997).