Get Data
Summary:
This data set provides Landsat Enhanced Thematic Mapper Plus (ETM+) imagery, derived classified land cover products, and cloud-water masks for selected Brazilian states (Acre, Amapa, Amazonas, Maranhao, Mato Grosso, Para, Rondonia, and Roraima) for the years 1999-2002. The Landsat ETM+ images were processed to derive fractional land cover types (photosynthetic vegetation [PV], non-photosynthetic vegetation [NPV], and bare substrate) by application of the Carnegie Landsat Analysis System (CLAS) methodology (Asner et al., 2005). CLAS utilizes a quantitative determination of fractional land cover at the subpixel scale (e.g., within each Landsat 30 x 30 m pixel). The resulting images display estimates of subpixel land cover fraction values including free of clouds, cloud shadows, and water.
There are 584 *.zip files in this data set that when expanded, contain a total of 1,717 (*.tif) images files (GeoTiff Standard format).
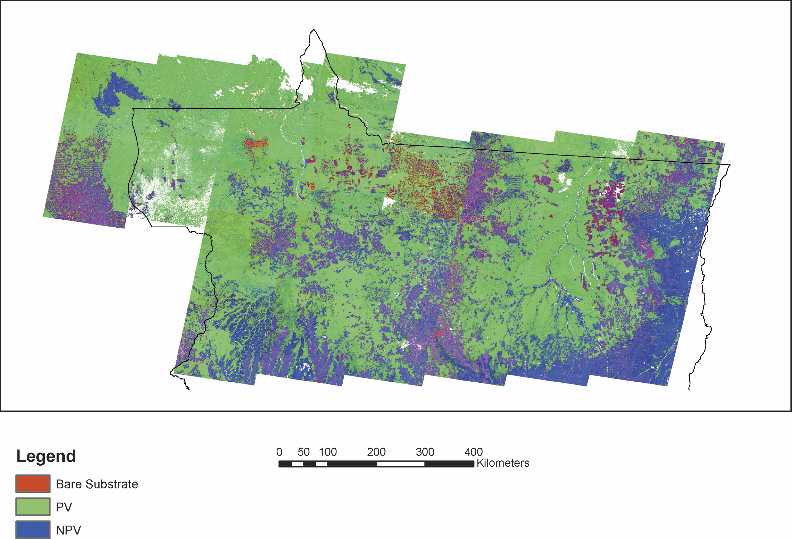
Figure 1. CLAS results for the northern part of the state of Mato Grosso. Areas in white were those without data due to cloud, cloud shadow, and water masking. From Asner et al., 2005.
Data Citation:
Cite this data set as follows:
Asner, G.P., D.E. Knapp, E.N. Broadbent, P.J.C. Oliveira, M.M. Keller, and J.N.M. Silva. 2013. LBA-ECO LC-21 Brazilian Amazon Fractional Land Cover Images: 1999-2002. Data set. Available on-line (http://daac.ornl.gov) from Oak Ridge National Laboratory Distributed Active Archive Center, Oak Ridge, Tennessee, U.S.A. http://dx.doi.org/10.3334/ORNLDAAC/1152
Implementation of the LBA Data and Publication Policy by Data Users:
The LBA Data and Publication Policy [http://daac.ornl.gov/LBA/lba_data_policy.html] is in effect for a period of five (5) years from the date of archiving and should be followed by data users who have obtained LBA data sets from the ORNL DAAC. Users who download LBA data in the five years after data have been archived must contact the investigators who collected the data, per provisions 6 and 7 in the Policy.
This data set was archived in March of 2013. Users who download the data between March 2013 and February 2018 must comply with the LBA Data and Publication Policy.
Data users should use the investigator contact information in this document to communicate with the data provider.
Data users should use the Data Set Citation and other applicable references provided in this document to acknowledge use of the data.
Table of Contents:
- 1 Data Set Overview
- 2 Data Characteristics
- 3 Applications and Derivation
- 4 Quality Assessment
- 5 Acquisition Materials and Methods
- 6 Data Access
- 7 References
1. Data Set Overview:
Project: LBA (Large-Scale Biosphere-Atmosphere Experiment in the Amazon)
Activity: LBA-ECO
LBA Science Component: Land Use and Land Cover
Team ID: LC-21 (Asner / Bustamante / Silva)
The investigators were Asner, Gregory Paul; Broadbent, Eben North; Carlson, Kim ; Carvalho, Ana Paula Ferreira; Hare, Anna Quinn; Huang, Maoyi ; Knapp, David E.; Luedemann, Gustavo ; Martin, Roberta Enders; Oliveira, Paulo Jose Silva Costa; Prado, Zayra Azeredo; Silva, Jose Salomao and Villagomez, April Marie. You may contact Knapp, David E. (deknapp@stanford.edu) and Asner, Gregory P. (gpa@stanford.edu).
LBA Data Set Inventory ID: LC-21_Fractional_Cover
This data set provides Landsat Enhanced Thematic Mapper Plus (ETM+) imagery, derived classified land cover products, and cloud-water masks for selected Brazilian states (Acre, Amapa, Amazonas, Maranhao, Mato Grosso, Para, Rondonia, and Roraima) for the years 1999-2002. The Landsat ETM+ images were processed to derive fractional land cover types (photosynthetic vegetation [PV], non-photosynthetic vegetation [NPV], and bare substrate) by application of the Carnegie Landsat Analysis System (CLAS) methodology (Asner et al., 2005). CLAS utilizes a quantitative determination of fractional land cover at the subpixel scale (e.g., within each Landsat 30 x 30 m pixel). The resulting images display estimates of subpixel land cover fraction values (means and standard deviations) free of clouds, cloud shadows, and water.
Related Data Set:
LBA-ECO LC-21 Selective Logging Activity in the Brazilian Amazon:
1999-2002 (The data from the fractional cover data were used to
determine selective logging.)
2. Data Characteristics:
The images cover eight Brazilian states for the years 1999-2002.
There are 584 *.zip files in this data set, which when expanded, contain a total of 1,717 (*.tif) images files (GeoTiff Standard format).
Each zip file contains as many as three GeoTiffs or as few as one GeoTiff.
Distribution of Image Files by State:
| Brazilian State | Number of zip files | Number of image files in the zip files | State notes |
|---|---|---|---|
| Acre | 60 | 186 | |
| Amapa | 23 | 69 | |
| Amazonas | 58 | 174 | |
| Maranhao | 45 | 100 | No land cover images |
| Mato Grosso (mg) | 84 | 252 | |
| Para | 200 | 595 | |
| Rondonia | 55 | 165 | |
| Roraima | 59 | 176 |
Three types of image files are provided with this data set:
1) Landsat ETM+ images with file names matching the format *_MMDDYY.tif with values for the 6 reflective Landsat Bands (1-5 and 7) available as bands 1-6 in each GeoTIFF file.
Landsat ETM+ Bands (unsigned 8-bit)
| Band Number | Spectral Range (um) | Resolution |
|---|---|---|
| 1 | 0.45-0.515 | 30 m |
| 2 | 0.525-0.605 | 30 m |
| 3 | 0.63-0.69 | 30 m |
| 4 | 0.75-0.90 | 30 m |
| 5 | 1.55-1.75 | 30 m |
| 7 | 2.09-2.35 | 30 m |
2) Fractional land cover images produced after CLAS processing of the Landsat images. The file name format is *_mcuscaled_means.tif.
These images have 7
bands (signed 16-bit) which include:
1. The fractional cover for each pixel, ranging from 0 (0%) to 1,000
(100%) of PV.
2. The fractional cover for
each pixel, ranging from 0 (0%) to 1,000 (100%) of NPV.
3. The fractional cover for
each pixel, ranging from 0 (0%) to 1,000 (100%) of bare substrate.
4. The standard deviation of the fractional cover for each pixel,
ranging from 0 (0%) to 1,000 (100%) of PV.
5. The standard deviation of the fractional cover for each pixel,
ranging from 0 (0%) to 1,000 (100%) of NPV.
6. The standard deviation of the fractional cover for each pixel,
ranging from 0 (0%) to 1,000 (100%) of bare substrate.
7. The root mean square (RMS) error between the spectra of the image
pixel and the spectra produced by mixture of the end members. This
represents the error or level of certainty in the modeled result.
Higher values mean a less accurate modeling of the image pixel's
spectrum.
3) Mask images (unsigned 8-bit) designed to exclude clouds, water bodies, cloud shadows, and other non-image areas with file names matching the format *_MMDDYY_therm.tif. These are single-band images derived with CLAS using known relationships among Landsat bands and atmospheric conditions and land-cover types (Asner et al., 2005).
File Naming Conventions:
The file names for all three file types begin with "Brazilian state name"_"Landsat path/row"_etm_"image collection date as ddmmyy".
1) Landsat ETM+ image example file name: acre_p001r067_etm_071099.tif
This is an image of the state of Acre, covering path/row001/067 on July 10, 1999. The image contains values for the six reflective Landsat bands (Bands 1-5 and 7).
2) Fractional land cover image example file name: para_p223r060_etm_090702_mcuscaled_means.tif
This is an image for the state of Para, covering path/row233/060 on July 9, 2002. The "mcuscaled_means" indicates that the Landsat image was processed with CLAS and Monte Carlo Unmixing (MCU) was applied to derive uncertainty estimates (i.e., means and standard deviations) of subpixel land cover fraction values.
3) Mask image example file name: acre_p001r067_etm_071099_therm.tif
This is an image of the state of Acre, covering path/row001/067 on July 10, 1999. When applied the image can help to exclude clouds, water bodies, cloud shadows, and other non-image areas.
Image File Characteristics:
Resolution: 30 meters
Projection: Universal Transverse Mercator (UTM). Images are in UTM Zones 19S, 20S, 20N, 21S, 22S and 23S. The specific zone is given in the GeoTiff file.
Datum: 1984 World Geodetic System
Format: GeoTiff standard format
For example: map info = {UTM, 1.000, 1.000, 416299.500, 8661839.500, 3.0000000000e+001, 3.0000000000e+001, 20, South, WGS-84, units=Meters}The file is in UTM, Zone 20 South, in the WGS-84 datum.
It has a 30-meter pixel size (3.00e+001) with the upper left corner of the upper left pixel (1,1) at coordinate 416299.500, 8661839.500.
Site boundaries: (All latitude and longitude given in decimal degrees)
| Site (Region) | Westernmost Longitude | Easternmost Longitude | Northernmost Latitude | Southernmost Latitude | Geodetic Datum |
|---|---|---|---|---|---|
| Brazilian Amazon (Brazilian Amazon) | -73.990582 | -41.795499 | 5.2722 | -14 | World Geodetic System, 1984 (WGS-84) |
Time period:
- The data set covers the period 1999/01/01 to 2002/12/31
- Temporal Resolution: This data set is a collection of Landsat images that were processed to fractional cover. For each path/rowcovering the Brazilian states of Acre, Amapa, Amazonas, Maranhao, Mato Grosso, Para, Rondonia, and Roraima, an attempt was made to acquire the most cloud free image once per year for the years 1999, 2000, 2001, and 2002.
Platform/Sensor/Parameters measured include:
- LANDSAT / ETM+ / LAND USE CLASSES
3. Data Application and Derivation:
These data can be used to identify areas of significant change in the fraction of PV, NPV, and bare substrate between the years 1999-2000,2000-2001, and 2001-2002. These fractions were determined by using an automated Monte Carlo simulation algorithm that determined the fractions for each pixel given libraries of spectral end members for PV, NPV, and bare substrate.
4. Quality Assessment:
Uncertainty was quantified in two key areas: atmospheric correction (aerosol and water vapor) and unobserved areas caused by persistent cloud cover (Asner et al., 2005).
Atmospheric Uncertainty
In the CLAS processing stream, Landsat ETM+ images are atmospherically corrected using the 6S atmospheric correction algorithm, with monthly averages of aerosol and water vapor inputs from the Moderate Resolution Imaging Spectrometer (MODIS) satellite sensor. The CLAS AutoMCU algorithm was found to be minimally sensitive to uncertainties in aerosol and water vapor from MODIS (Asner et al. 2005a). To further understand the effect that the atmospheric correction has on the sensitivity of entire CLAS process, we atmospherically corrected five Landsat image pairs using randomly-selected, monthly aerosol and water vapor values from MODIS. The difference in the amount of automatically detected logging between the different atmospherically-corrected images was only 0.7%.
Unobserved Area Uncertainty
When cloud and cloud-shadow cover is greater than 50% in any 5,625 km2 area (2,500 x 2,500 pixels), the area of observed logging is used to estimate the amount of logging in the unobserved, cloudy areas. We assessed our sensitivity to this type of error by simply quantifying the fractional cover of clouds and cloud shadows in comparison to observed logging extent. The calculated absolute uncertainty caused by this step was approximately +5% over the five states (Asner et al., 2005).
5. Data Acquisition Materials and Methods:
Geographic Coverage
The Brazilian Amazon basin covers an area of approximately 4.1 million km2. Our study areas included the states of Brazilian states of Acre, Amapa, Amazonas, Maranhao, Mato Grosso, Para, Rondonia, and Roraima.
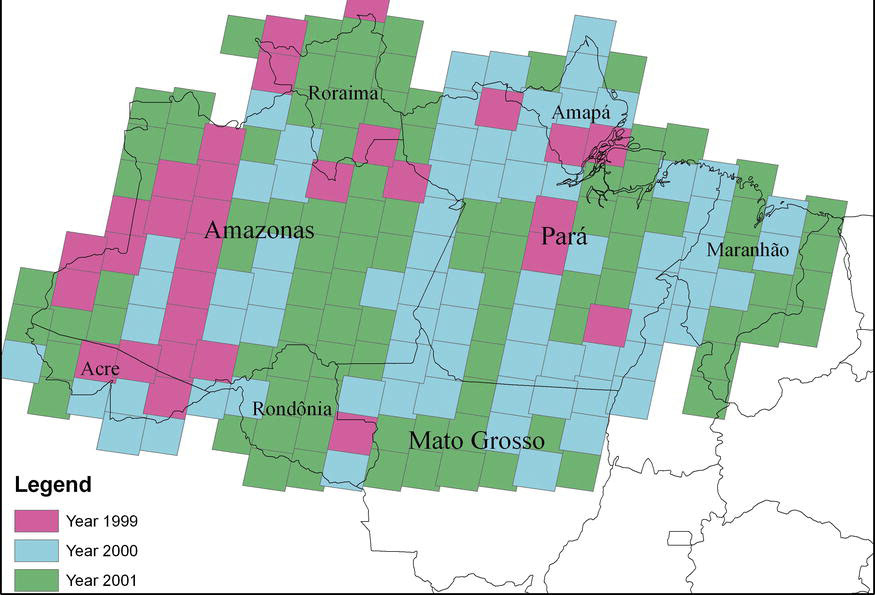
Figure 2. States of the Brazilian Amazon included in this data set. This figure displays a subset of the Landsat ETM+ images provided in this data set. ETM+ images are shown with acquisition year indicated (Asner et al., 2005).
Materials and Methods Processing Methodology
ETM+ satellite images were acquired of the Brazilian states of Acre, Amapa, Amazonas, Maranhao, Mato Grosso, Para, Rondonia, and Roraima, for the years 1999-2002. These images were processed using CLAS, which uses high spatial resolution satellite data for regional and global studies of forest disturbance (Asner et al., 2005).
CLAS is an automated processing system that includes: (i) atmospheric correction of satellite data; (ii) deconvolution of spectral signatures into sub-pixel fractional cover of live forest canopy, forest debris and bare substrates; (iii) cloud, water, and deforestation masking; and (iv) pattern recognition algorithms for forest disturbance mapping.
Image Preparation and Atmospheric Correction
The version of CLAS utilized ingested raw ETM+ satellite imagery and applied sensor gains and offsets to convert from digital number (DN) to exo-atmospheric radiance. The radiance data were passed to a fully automated version of the 6S atmospheric radiative transfer model. The 6S program was integrated into the CLAS processing stream and used monthly averages of aerosol optical thickness (AOT) and water vapor (WV) values from the MODIS sensor onboard the NASA Terra spacecraft. Time-stamping of MODIS AOT and WV data with Landsat data was done on an automated basis.
Sub-pixel Analysis
The CLAS process relies upon the quantitative determination of fractional material cover at the sub-pixel scale (e.g., within each Landsat 30 x 30 m pixel). This core step employs a probabilistic spectral mixture sub-model. This process spectrally decomposed each image pixel into fractional cover estimates (0-100% cover) of PV canopy, NPV, and bare substrate. It is fully automated and uses a Monte Carlo Unmixing (AutoMCU) approach to derive uncertainty estimates of the sub-pixel cover fraction values (Asner et al., 2005).
Our mixture modeling technique requires spectral reflectance bundles (rho pv(lambda), rho npv(lambda), and rho substrate(lambda)) that encompass the common variation in canopy and soil properties. Asner (1998), Asner et al. (2004) and Asner et al.(2003) collected these spectral data using full optical range field spectroradiometers (Analytical Spectral Devices, Inc., Boulder, CO, USA) during field campaigns conducted from 1996 to 2000. The spectral endmember database encompasses the common variation in materials found throughout the Brazilian Amazon, with statistical variability well defined (Asner et al. 2004).
Non-forest Masking and Atmospheric Compensation
A series of automated masks were designed to
exclude clouds, water bodies, cloud shadows, non-image and non-forest
areas (e.g., pasture, urban and agriculture) from the CLAS processing
stream.
- Clouds are masked using the thermal channel (band 6) from the raw Landsat images, prior to execution of the AutoMCU sub-model.
- Water bodies are masked by finding pixels in the calibrated Landsat reflectance data in which bands 1-4 (blue, green, red, and near-infrared) have a negative slope.
- Non-image areas containing zero values are also masked.
- Cloud shadows are identified using the RMS error image that results from the AutoMCU processing.
- To limit the logging analysis to forested areas, Landsat thermal band 6, combined with the AutoMCU results, was used to identify pixels containing primarily forest and non-forest areas. The minimum and maximum thermal thresholds, which encompass forested areas in the thermal mask, were dynamically generated for each image by calculating the mean thermal value of all pixels having a PV fraction cover greater than 80% and then masking all pixels with values > 15 DN from the mean thermal value.
These final masking steps have the added feature of removing residual clouds and cloud shadows that were missed in the masks applied earlier in the CLAS process.
6. Data Access:
This data is available through the Oak Ridge National Laboratory (ORNL) Distributed Active Archive Center (DAAC).
Data Archive Center:
Contact for Data Center Access Information:
E-mail: uso@daac.ornl.gov
Telephone: +1 (865) 241-3952
7. References:
Asner, G.P., 1998. Biophysical and biochemical sources of variability in canopy reflectance. Remote Sens. Environ., 64, 234-253.
Asner, G.P. and D.B. Lobell, 2000. A biogeophysical approach for automated SWIR unmixing of soils and vegetation. Remote Sens. Environ., 74, 99-112.
Asner, G.P. and K.B. Heidebrecht, 2002. Spectral unmixing of vegetation, soil and dry carbon cover in arid regions: Comparing multispectral and hyperspectral observations. Int. J. Remote Sens., 23, 3939-3958.
Asner, G.P. and A.S. Warner, 2003. Canopy shadow in IKONOS satellite observations of tropical forests and savannas. Remote Sens. Environ., 87, 521-533.
Asner, G.P., M.M.C. Bustamante, and A.R. Townsend, 2003. Scale dependence of biophysical structure in deforested areas bordering the Tapajos National Forest, Central Amazon. Remote Sens. Environ., 87, 507-520.
Asner, G.P., M. Keller, R. Pereira, J.C. Zweede, and J.N.M. Silva, 2004. Canopy damage and recovery after selective logging in Amazonia: Field and satellite studies. Ecol. Appl., 14, S280-S298.
Asner GP, Knapp DE, Cooper AN, Bustamante MMC, Olander LP. 2005a. Ecosystem Structure throughout the Brazilian Amazon from Landsat Observations and Automated Spectral Unmixing. Earth Interactions, 9, 1-31.
Asner, G.P., D.E. Knapp, A.N. Cooper, M.M.C. Bustamante, and L.P. Olander. 2005. Ecosystem Structure throughout the Brazilian Amazon from Landsat Observations and Automated Spectral Unmixing. Earth Interactions 9(7):1-31.
Asner, G.P., M. Keller, J.N M. Silva. 2005b Global Change Biol. 10, 7652005b Gastellu-Etchegorry, J.P., P. Guillevic, F. Zagloski, V. Demarez, V. Trichon, D. Deering, and M. Leroy, 1999. Modeling BRF and radiation regime of boreal and tropical forests: I. BRF. Remote Sens. Environ., 68, 281-316.
INPE (Instituto Nacional de Pesquisas Espaciais (INPE), 2005. PRODES: Assessment of deforestation in Brazilian Amazonia (http://www.obt.inpe.br/prodes/index. html).
Nepstad DC, Verissimo A, Alencar A, Nobre C, Lima E, Lefebvre P, Schlesinger P, Potter C, Moutinho P, Mendoza E, Cochrane M, Brooks V. (1999). Large-scale impoverishment of Amazonian forests by logging and fire. Nature, 398, 505-508.
Roberts, D.A., M.O. Smith, and J.B. Adams, 1993. Green vegetation, nonphotosynthetic vegetation,and soils in Aviris data. Remote Sens. Environ., 44, 255-269.
Souza and Barreto 2000 Int'l J. Rem. Sens. 21, 173 Ungar, S.G. J.S. Pearlman, J.A. Mendenhall, D. Reuter, IEEE Trans. Geosci. Rem. Sens. 41, 1149.
Related Publications
- Asner, G.P., E.N. Broadbent, P.J.C. Oliveira, M. Keller, D.E. Knapp, and J.N.M. Silva. 2006. Condition and fate of logged forests in the Brazilian Amazon. Proceedings of the National Academy of Sciences of the United States of America 103(34):12947-12950.