Get Data
Summary:
These multispectral reflectance data were collected by the EO-1 Hyperion sensor on 10-July-2004 at 13:16:16 GMT over Mato Grosso, Brazil. Data were calibrated to apparent surface reflectance using the Atmospheric CORrection Now (ACORN) atmospheric model (Miller, 2002). The data are in ENVI format, which includes an image file without headers and a separate ASCII header file (*.hdr) which describes the data characteristics. Reflectances for 200 bands are reported at 30-m resolution.
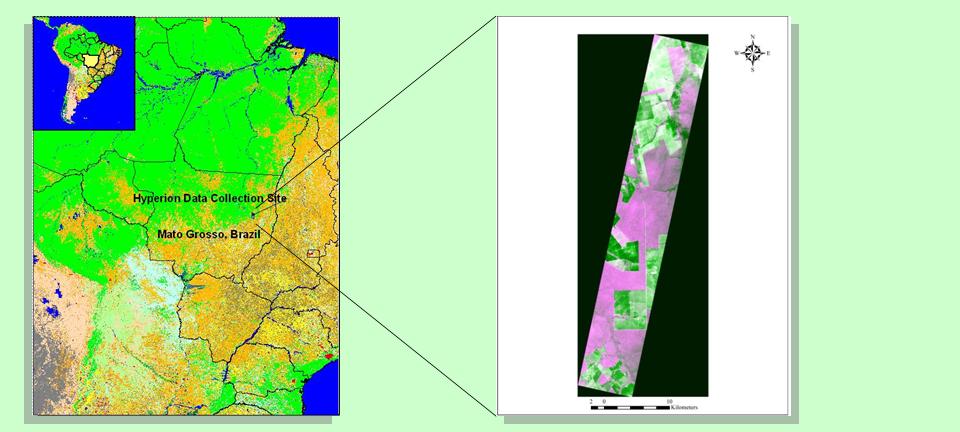
Figure 1. Selected Hyperion reflectance bands collected over Mato Grosso:
Band 5 (396.29 nm, blue), Band 20 (548.92 nm, green), and Band 39 (742.25 nm, red).
The Hyperion imager has a spectral range of 400-2500 nm, a spectral resolution of 10 nm, spatial resolution of 30 m, and a swath width of 7.8 km. Sampling is scene based (256 samples, 512 lines) (http://eo1.usgs.gov/sensors.php). Through these large number of spectral bands, complex land ecosystems can be imaged and accurately classified.
Data from the EO-1 Hyperion imaging spectrometer may greatly increase our ability to estimate the presence and structural attributes of selective logging in the Amazon Basin using four "biogeophysical indicators" not yet derived simultaneously from any satellite sensor: 1) green canopy leaf area index; 2) degree of shadowing; 3) presence of exposed soil and; 4) non-photosynthetic vegetation material. Airborne, field and modeling studies have shown that the optical reflectance continuum (400-2500 nm) contains sufficient information to derive estimates of each of these indicators. Our ongoing studies in the eastern Amazon basin also suggest that these four indicators are sensitive to logging intensity. Satellite-based estimates of these indicators should provide a means to quantify both the presence and degree of structural disturbance caused by various logging regimes.
Data Citation:
Cite this data set as follows:
Asner, G.P., K.M. Carlson, and D.E. Knapp. 2008. LBA-ECO LC-18 Hyperion 30-m Surface Reflectance, Mato Grosso, Brazil: July 2004. Data set. Available on-line [http://daac.ornl.gov] from Oak Ridge National Laboratory Distributed Active Archive Center, Oak Ridge, Tennessee, U.S.A. doi:10.3334/ORNLDAAC/889.
Implementation of the LBA Data and Publication Policy by Data Users:
The LBA Data and Publication Policy [http://daac.ornl.gov/LBA/lba_data_policy.html] is in effect for a period of five (5) years from the date of archiving and should be followed by data users who have obtained LBA data sets from the ORNL DAAC. Users who download LBA data in the five years after data have been archived must contact the investigators who collected the data, per provisions 6 and 7 in the Policy.
This data set was archived in July of 2008. Users who download the data between July 2008 and June 2013 must comply with the LBA Data and Publication Policy.
Data users should use the Investigator
contact information in this
document to communicate with the data provider. Alternatively, the LBA
Web Site
[http://lba.inpa.gov.br/lba/]
in
Data users should use the Data Set Citation and other applicable references provided in this document to acknowledge use of the data.
Table of Contents:
- 1 Data Set Overview
- 2 Data Characteristics
- 3 Applications and Derivation
- 4 Quality Assessment
- 5 Acquisition Materials and Methods
- 6 Data Access
- 7 References
1. Data Set Overview:
Project: LBA (Large-Scale Biosphere-Atmosphere Experiment in the Amazon)
Activity: LBA-ECO
LBA Science Component: Land Use and Land Cover
Team ID: LC-18 (Asner / Natalino da Silva)
The investigators were Asner, Gregory Paul; Silva, Jose Natalino Macedo; Aires, Keila Souza; Alencar, Ane A. C.; Fernandes, Erick C.M.; Hare, Anna Quinn; Keller, Michael M.; McCubbin, Ian B; Pereira, Rodrigo Antonio; Souza, Rosineide Silva; Treuhaft, Robert N. and Zweede, Johan Cornelis . You may contact Asner, Gregory P. (gpa@stanford.edu) and Knapp, David E. (deknapp@stanford.edu).
LBA Data Set Inventory ID: LC18_Hyperion
This data set was created from an Hyperion image collected on 10-July-2004 over a study area in Mato Grosso, Brazil. The image was calibrated to apparent surface reflectance using the ACORN atmospheric correction model.
2. Data Characteristics:
The data are in ENVI format, which includes an image file without headers and a separate ASCII header file (*.hdr) which contains the data characteristics. Reflectances for 200 bands are reported at 30-m resolution. The center wavelength for each band can be found in header file (bands listed ordinally 1-200) and as the spectral center wavelength in the binary ENVI file.
Image file: tanguro_hyp_071004_bil_sub_acorn_refl_destrspline_geo
Header file: tanguro_hyp_071004_bil_sub_acorn_refl_destrspline_geo.hdr
Raster dataset information:
- SDTS raster type: Pixel
- Number of raster bands: 200 (See Mato_Grasso_July_2004_image_bands.xls in companion files for specific Hyperion bands. The ENVI header file lists the bands ordinally 1-200).
Raster properties:
- Origin location: Upper Left
- Data compression type: None
- Display type: pixel codes
Cell information:
- Number of cells on x-axis:668
- Number of cells on y-axis:1852
- Number of cells on z-axis:1
- Number of bits per cell:16
Cell Size:
- X distance: 30.000000
- Y distance: 30.000000
Spatial Reference:
- Projected coordinate system name: WGS_1984_UTM_Zone_22S
Companion Files:
Two companion files are included that provide more information on the HYPERION multispectral bands.
- Mato_Grasso_July_2004_image_bands.pdf file lists the 200 specific Hyperion bands reported in this data set.
- Hyperion_Spectral_Coverage.pdf lists the full set of bands collected by Hyperion. (http://eo1.usgs.gov/sensors.php)
Site boundaries: (All latitude and longitude given in degrees and fractions)
| Site (Region) | Westernmost Longitude | Easternmost Longitude | Northernmost Latitude | Southernmost Latitude | Geodetic Datum |
|---|---|---|---|---|---|
| Mato Grosso (Mato Grosso) | -52.46424 | -52.28002 | -12.66487 | -13.16784 | World Geodetic System, 1984 (WGS-84) |
Time period:
- The data set covers the period 2004/07/10 to 2004/07/10.
- Temporal Resolution: Virtually Instantaneous Image Acquisition on 10-July-2004 at 13:16:16 GMT.
Platform/Sensor/Parameters measured include:
-
EO-1 (EARTH OBSERVING 1) / HYPERION / REFLECTANCE
3. Data Application and Derivation:
This image can be used to detect changes in land cover based on the reflectance in the 200 reported spectral bands.
The Hyperion imager has a spectral range of 400-2500 nm, a spectral resolution of 10 nm, spatial resolution of 30 m, and a swath width of 7.8 km. Sampling is scene based (256 samples, 512 lines). The Hyperion capabilities provide resolution of surface properties into hundreds of spectral bands versus the six optical multispectral bands flown on traditional Landsat imaging missions. Through these large number of spectral bands, complex land ecosystems can be imaged and accurately classified.
Potential applications include improved multiresolution characterization of the surface (scaling), improved optical-geometric characterization of vegetation canopies, improved assessments of surface phenology and ecosystem seasonal dynamics, and improved maintenance of long-term, inter-annual, time series data records.
4. Quality Assessment:
This image was visually and quantitatively assessed for reasonable and accurate values in various spectral regions.
5. Data Acquisition Materials and Methods:
The original Hyperion data were acquired from NASA Goddard Space Flight Center. Data were calibrated to apparent surface reflectance using the Atmospheric CORrection Now (ACORN) atmospheric model.
Sensors used include:
- HYPERION
6. Data Access:
This data is available through the Oak Ridge National Laboratory (ORNL) Distributed Active Archive Center (DAAC) or the EOS Data Gateway.
Data Archive center:
Contact for Data Center Access Information:
E-mail: uso@daac.ornl.gov
Telephone: +1 (865) 241-3952
7. References:
Asner, G.P. 2008. Hyperspectral remote sensing of canopy chemistry, physiology and diversity in tropical rainforests. Chapter 12 in Hyperspectral remote sensing of tropical and subtropical forests. M. Kalacska and G.A. Sanchez-Azofeifa (eds.) Taylor and Francis Group.
Asner, G.P., D.E. Knapp, E.N. Broadbent, P.J.C. Oliveira, M. Keller, and J.N. Silva. 2005. Selective logging in the Brazilian Amazon. Science 310:480-482.
Miller, C. J., 2002, Performance assessment of ACORN atmospheric correction algorithm, Proceedings SPIE Algorithms and Technologies for Multispectral, Hyperspectral, and Ultraspectral Imagery VIII ,v. 4725, pp. (http://eo1.usgs.gov/hyperion.php). Source:TRENDS IN ECOLOGY EVOLUTION (Regional ecosystem structure and function: ecological insights from remote sensing of tropical forests), Chambers JQ, Asner GP, Morton DC, et al., Volume: 22 Issue: 8 Pages: 414-423 Published: AUG 2007.