Summary:
This data set provides (1) soil maps for Brazil that are digital versions of the MAPA DE SOLOS DO BRASIL (EMBRAPA, 1981) classified at three levels of detail, 19-class, 70-class and 249-class; (2) vegetation maps for Brazil that are digital versions of the MAPA DE VEGETACAO DO BRASIL (IBGE, 1988) classified at three levels of detail, 13-class, 59-class, and an overprint (combination) class; and (3) a land cover map for all of South America that was derived from National Oceanic and Atmospheric Administration (NOAA) Advanced Very High Resolution Radiometer (AVHRR) data over the time period 1987 through 1991 (Stone et al., 1994).
The seven soil, vegetation, and general land cover classification maps are provided as GeoTIFF files (*.tif) files. There are also three companion files (.pdf), one each, for the soil, vegetation, and land cover maps, with information on map units, class values, codes, and descriptions.
Data Citation:
Cite this data set as follows:
Bliss, N. 2013. LBA-ECO LC-08 Soil, Vegetation, and Land Cover Maps for Brazil and South America. Data set. Available on-line (http://daac.ornl.gov) from Oak Ridge National Laboratory Distributed Active Archive Center, Oak Ridge, Tennessee, U.S.A. http://dx.doi.org/10.3334/ORNLDAAC/1155
Implementation of the LBA Data and Publication Policy by Data Users:
The LBA Data and Publication Policy [http://daac.ornl.gov/LBA/lba_data_policy.html] is in effect for a period of five (5) years from the date of archiving and should be followed by data users who have obtained LBA data sets from the ORNL DAAC. Users who download LBA data in the five years after data have been archived must contact the investigators who collected the data, per provisions 6 and 7 in the Policy.
This data set was archived in April 2013. Users who download the data between April 2013 and March 2018 must comply with the LBA Data and Publication Policy.
Data users should use the investigator contact information in this document to communicate with the data provider.
Data users should use the Data Set Citation and other applicable references provided in this document to acknowledge use of the data.
Table of Contents:
- 1 Data Set Overview
- 2 Data Characteristics
- 3 Applications and Derivation
- 4 Quality Assessment
- 5 Acquisition Materials and Methods
- 6 Data Access
- 7 References
1. Data Set Overview:
Project: LBA (Large-Scale Biosphere-Atmosphere Experiment in the Amazon)
Activity: LBA-ECO
LBA Science Component: Land Use and Land Cover
Team ID: LC-08 (Moore / Nobre)
The investigators were Moore, Berrien; Nobre, Carlos Afonso; Braswell, Rob H.; Frolking, Steve; Hagen, Stephen Charles; Hurtt, George C.; Moorcroft, Paul R.; Pacala, Steve; Peterson, Bruce J.; Tian, Hanqin; Vorosmarty, Charles J.; Wildes, Pam and Xiao, Xiangming. You may contact Blaha, Denise (support@eos-webster.sr.unh.edu).
LBA Data Set Inventory ID: LC08_EOS_Maps
This data set provides (1) soil maps for Brazil that are digital versions of the MAPA DE SOLOS DO BRASIL (EMBRAPA, 1981) classified at three levels of detail, 19-class, 70-class and 249-class; (2) vegetation maps for Brazil that are digital versions of the MAPA DE VEGETAÇÃO DO BRASIL (IBGE, 1988) classified at three levels of detail, 13-class, 59-class, and an overprint (combination) class; and (3) a land cover map for all of South America that was derived from National Oceanic and Atmospheric Administration (NOAA) Advanced Very High Resolution Radiometer (AVHRR) data over the time period 1987 through 1991 (Stone et al., 1994).
2. Data Characteristics:
There are seven GeoTIFF files (*.tif) files with this data set which includes three soil map files, three vegetation map files, and one land cover file. There are also three companion files (.pdf), one each, for the soils, vegetation, and land cover map, with information on map units, class values, codes, and descriptions.
Soil Classification Map Files
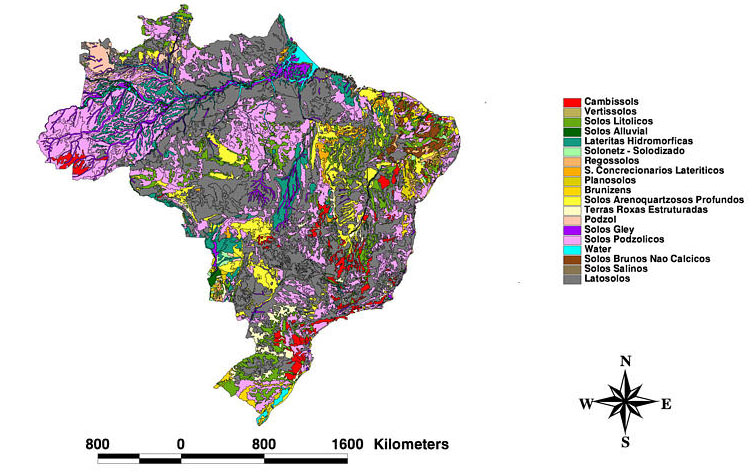
Figure 1. Soil map of Brazil (IBGE 1981).
Soil maps are available at three levels of classification: 19-class, 70-class and 249-class. Data represent the year 1981, based on the publication date.
The data resolution is 0.0083 degrees (nominally 1 km).
Projection: Geographic
Datum: D_Clarke 1866
Angular unit: degree
Prime Meridian: Greenwich
Semimajor Axis: 6378206.400000000400000000
Semiminor Axis: 6356583.799998980900000000
Spatial Extent: Brazil
min.X: -73.9777
max.X: -29.29609
min.Y: -33.77586
max.Y: 5.239861
Data file names and descriptions:
Brazil_Soils_Map_19class.tif :
A digitized soil map of Brazil. Data are integer class data with values ranging from 1 through 19. Missing data and ocean mask are represented by the value -9999.
Brazil_Soils_Map_70class.tif:
A digitized soil map of Brazil. Data are integer class data with values ranging from 1 through 70. Missing data and ocean mask are represented by the value -9999.
Brazil_Soils_Map_249class.tif:
A digitized soil map of Brazil. Data are integer class data with values ranging from 1 through 249. Missing data and ocean mask are represented by the value -9999.
Documentation:
For documentation of the respective data files 19, 70, and 249 soil classification values and names, refer to Brazil_Soils_Map_class_aux.pdf.
Vegetation Classification Map Files
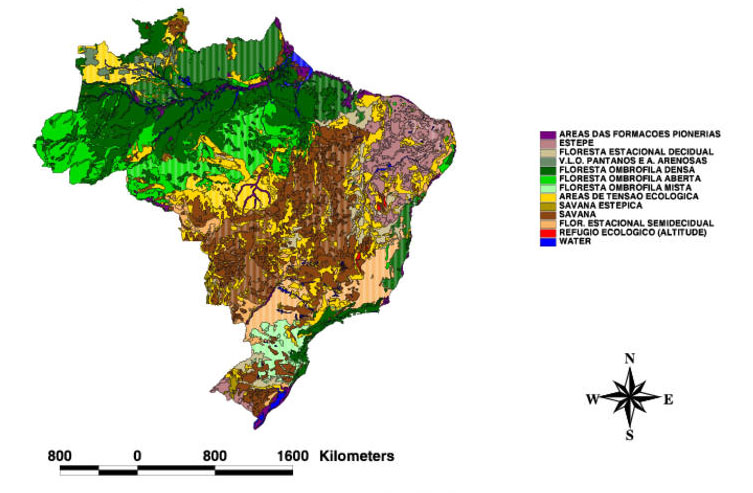
Figure 2. Vegetation map of Brazil (IBGE 1996).
Vegetation maps are available in three files and are digital versions of the MAPA DE VEGETACAO DO BRASIL (IBGE, 1988).
The data resolution is 0.0083 degrees (nominally 1 km).
Projection: Geographic
Datum: D_Clarke 1866
Angular unit: degree
Prime Meridian: Greenwich
Semimajor Axis: 6378206.400000000400000000
Semiminor Axis: 6356583.799998980900000000
Spatial Extent: Brazil
min. X: -73.97890
max. X: -34.81103
min. Y: -33.77921
max. Y: 5.230429
Data file names and descriptions:
BrazilVegMap_13class.tif :
Data are in 13 classes that are generalizations of the 59-class major vegetation classes. Missing data values/ocean mask are represented by the value -9999.
BrazilVegMap_59class.tif:
Data values represent clases and are integers ranging from 1 through 59. Missing data values/ocean mask are represented by the value -9999. For additional information on file processing, and the 59 class values and names, refer to BrazilVegMap_class_aux.pdf.
BrazilVegMap_OverprintCodes.tif:
Data are in 6 classes that are areas best described by a combination of two classes. Generalized classes were determined from the original subheadings on the original published map which was used use to digitize the data set. Overprint classes were originally displayed with special symbols printed over major classification shades on the original map. The overprint classifications are also referred to as subclasses in the original data.
Documentation:
For documentation of the respective data files 13, 59, and overprint vegetation classification values and names, refer to BrazilVegMap_class_aux.pdf.
Land Cover Map of South America
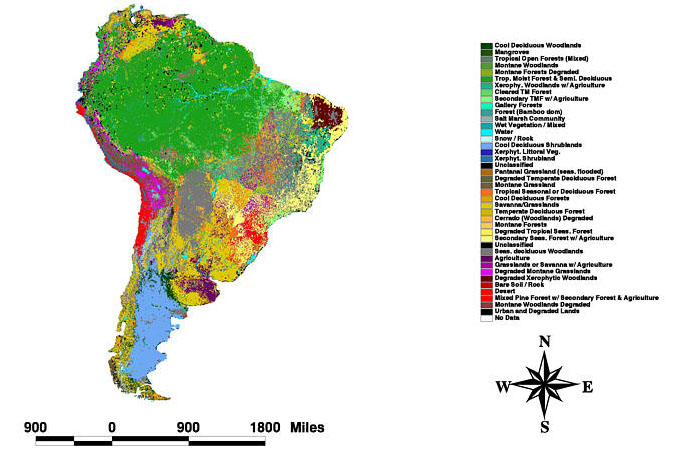
Figure 3. Land cover map of South America (Stone et al., 1994).
The data resolution is 0.0083 degrees (nominally 1 km).
Projection: Geographic
Semimajor Axis: 6378206.400000000400000000
Semiminor Axis: 6356583.799998980900000000
Spatial Extent: South American Continent
min. X : -81.3572464
max. X : -34.8444290
min. Y : -56.0928993
max. Y : 12.4712601
Data file name and description:
SA_lc_Map_41class.tif:
This 1-km resolution, 41-class, land cover map of South America was produced from 1-15 km National Oceanic and Atmospheric Administration (NOAA) Advanced Very High Resolution Radiometer (AVHRR) data over the time period 1987 through 1991. Data are integer class values ranging from 1 through 41, with a fill value/missing data value of 0.
For documentation of the 41-class values and names, refer to SA_lc_Map_41class_aux.pdf.
Site boundaries: (All latitude and longitude given in decimal degrees)
| Site (Region) | Westernmost Longitude | Easternmost Longitude | Northernmost Latitude | Southernmost Latitude | Geodetic Datum |
|---|---|---|---|---|---|
| Brazil | -74 | -30 | 5.5 | -34 | World Geodetic System, 1984 (WGS-84) |
| South America | -81.35725 | -34.8444 | 12.4712601 | -34.8444 | World Geodetic System, 1984 (WGS-84) |
Time period: This data set covers the period 1981/01/01 to 1994/08/31.
Temporal Resolution: The original soils map was published in 1981, the vegetation map in 1988, and the land cover map was derived from data collected between 1987- 1991.
Platform/Sensor/Parameters measured include:
- FIELD INVESTIGATION / DIGITIZER / SOIL CLASSIFICATION
- FIELD INVESTIGATION / DIGITIZER / LAND COVER
- FIELD INVESTIGATION / DIGITIZER / VEGETATION COVER
3. Data Application and Derivation:
Maps are a useful reference point reflecting the land use and land cover status at this point in time.
4. Quality Assessment:
The information contained in the soils maps are highly generalized and there is not soil uniformity in large expanses.
The map units are predominantly associations of several soil types; only the principal ones are specified within each map unit. The naming of each map unit is given according to the areal importance of those soil types that are contained in each association. Soil types with little areal importance are not listed. The composition of the map units is not entirely consistent across the full range of the map, nor is the precision of the map unit boundaries uniform.
5. Data Acquisition Materials and Methods:
Soils Maps:
The soil maps of Brazil are digital versions of the MAPA DE SOLOS DO BRASIL (EMBRAPA, 1981), digitized at the U.S. Geological Survey's EROS Data Center, Sioux Falls, South Dakota, in 1992.
These data were acquired from the Woods Hole Research Center and modified for incorporation in the University of New Hampshire (UNH) EOS-WEBSTER system. The subset for the LBA study region was downloaded from EOS-WEBSTER.
The files were processed with ArcInfo, and based on the Woods Hole Full Soil Map Unit Classifications. There are three soil maps available as three different classes: one 19-class, one 70-class, and one 249, detailed class. Refer to the companion file Brazil_Soils_Map_class_aux.pdf for the class value codes and names.
Vegetation Maps:
The vegetation maps of Brazil are digital versions of the MAPA DE VEGETACAO DO BRASIL (IBGE, 1988), digitized at the U.S. Geological Survey's EROS Data Center, Sioux Falls, South Dakota, in 1992. These data were acquired from the Woods Hole Research Center.
Data are generalizations of the major vegetation classes. Generalized classes were determined from the original subheadings on the original published map.
Overprint classes are used to define areas which are best described by a combination of two classes, one from the major classification and the other from the overprint classification. Overprint classes were originally displayed with special symbols printed over major classification shades on the original map. For instance, a series of stipple marks or hash marks were printed on top of major class shades to represent areas which had characteristics from the major classification as well as the overprint classification. The overprint classifications were also referred to as subclasses in the original data.
The files were processed with ArcInfo, and based on the Woods Hole General Vegetation Classification. There are three vegetation maps available as three different classes: one 19-class, one 70-class, and one 249, detailed class. Refer to the companion file BrazilVegMap_class_aux.pdf for the class value codes and names.
Land cover map:
The land cover map of South America was produced from 1-15 km National Oceanic and Atmospheric Administration (NOAA) Advanced Very High Resolution Radiometer (AVHRR) data over the time period 1987 through 1991. The data were acquired from Woods Hole Research Center.
The file was processed with ArcInfo and resulted in a 1-km resolution, 41-class, land cover map of South America. Refer to the companion file SA_lc_Map_41class_aux.pdf for the class values and names.
6. Data Access:
This data is available through the Oak Ridge National Laboratory (ORNL) Distributed Active Archive Center (DAAC).
Data Archive Center:
Contact for Data Center Access Information:
E-mail: uso@daac.ornl.gov
Telephone: +1 (865) 241-3952
7. References:
Stone, T.A., P. Schlesinger, G.M. Woodwell, and R.A. Houghton, 1994. A Map of the Vegetation of South America Based on Satellite Imagery. Photogrammetric Engineering and Remote Sensing. 60(5):541-551.