Get Data
Summary:
This data set provides estimates of monthly carbon dioxide (CO2) flux from the Amazon mainstem rivers, tributary stream networks, and their associated varzeas (floodplains). CO2 flux was calculated using two aggregation approaches: for defined river basins and for defined river reaches. Flux was calculated from (1) estimated surface water area by month for the Amazon mainstem rivers, associated varzeas, and tributary stream networks, (2) mean daily partial pressures of CO2 (pCO2) concentrations for the mainstem rivers, and (3) calculated mean pCO2 values for the varzea waters. Mean monthly discharge data for 11 mainstem rivers are also included.
There are five comma-delimited data files with this data set.
Amazon mainstem is a region covering the Amazon/Solimoes River mainstem from 70 degrees W to 54 degrees W. Data from the Japanese Earth Resources Satellite-1 (JERS-1) L-band synthetic aperture radar were used to estimate the areal coverage and inundation status of rivers and floodplains over 100 m in width and compiled into mosaics for periods of high and low water. For each mosaic, the study area was classified into either flooded or non-flooded areas.
Data for the seasonal and spatial distributions of pCO2 within each hydrographic region were utilized from more than 1,800 samples taken on 13 Carbon in the Amazon River Experiment (CAMREX) expeditions at different water stages throughout a 2,000 km reach of the central Amazon mainstem, tributary, and floodplain waters (Degens et al., 1991, Devol et al., 1995, Richey et al., 1988).
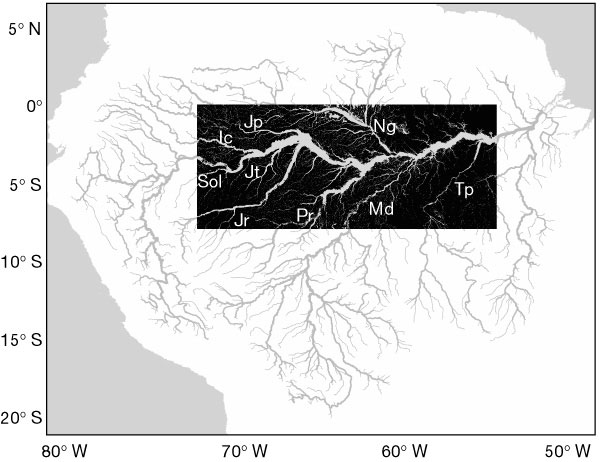
Figure 1: Flooded area of the central Amazon Basin at high water, as mapped from the Japanese Earth Resources Satellite radar data (May-June 1996). The flooded area is shown as light areas in dark inset (the study quadrant). Underlying the inundation image is a digital river network (derived from the Digital Chart of the World, the GTOPO30 digital elevation model and ancillary cartographic information). Major tributaries are labelled: Negro (Ng), Japura (Jp), Ica (Ic), Solimoes (Sol, the Amazon mainstem exiting Peru), Jutaı (Jt), Jurua (Jr), Purus (Pr), Madeira (Md), and Tapajos (Tp). Image is from Richey et al., 2002.
Data Citation:
Cite this data set as follows:
Richey, J.E., J.M. Melack, A.K. Aufdenkampe, M.V.R. Ballester and L.L. Hess. 2013. LBA-ECO CD-06 Flux of CO2 from Amazon Mainstem Rivers, Tributaries, and Floodplains. Data set. Available on-line [http://daac.ornl.gov] from Oak Ridge National Laboratory Distributed Active Archive Center, Oak Ridge, Tennessee, USA. http://dx.doi.org/10.3334/ORNLDAAC/1151
Implementation of the LBA Data and Publication Policy by Data Users:
The LBA Data and Publication Policy [http://daac.ornl.gov/LBA/lba_data_policy.html] is in effect for a period of five (5) years from the date of archiving and should be followed by data users who have obtained LBA data sets from the ORNL DAAC. Users who download LBA data in the five years after data have been archived must contact the investigators who collected the data, per provisions 6 and 7 in the Policy.
This data set was archived in March 2013. Users who download the data between March 2013 and February 2018 must comply with the LBA Data and Publication Policy.
Data users should use the investigator contact information in this document to communicate with the data provider.
Data users should use the Data Set Citation and other applicable references provided in this document to acknowledge use of the data.
Table of Contents:
- 1 Data Set Overview
- 2 Data Characteristics
- 3 Applications and Derivation
- 4 Quality Assessment
- 5 Acquisition Materials and Methods
- 6 Data Access
- 7 References
1. Data Set Overview:
Project: LBA (Large-Scale Biosphere-Atmosphere Experiment in the Amazon)
Activity: LBA-ECO
LBA Science Component: Carbon Dynamics
Team ID: CD-06 (Richey / Victoria)
The investigators were Richey, Jeffrey E.; Victoria, Reynaldo Luiz; Souza, Reginaldo; Aalto, Rolf Erhart; Abdo, Mara Silvia Aguiar; Alin, Simone Rebecca; Aufdenkampe, Anthony K.; Ballester, Maria Victoria Ramos; Barbosa, Roosevelt Passos; Bernardes, Marcelo Correa; Bezerra de Barros Lima, Roberta; Bolson, Marcos Alexandre; Bolson, Marcos Alexandre; Bonelle, Nilton; Brito, David Silva; Cabianchi, Giovana; Cogo, Michelle Cristine; da Silva, Luis Vilmar Souza; Dalmagro, Higo Jose; de Oliveira, Carolina Barisson Marques; Deus, Fabiano Alves de; Devol, Allan H.; do Nascimento, Clive Reis; Ellis, Erin Elizabeth; Ferro, Jaderson Coradi; Filho, Walter Jorge do Nascimento; Frickmann, Fernando Cruz; Gamero Guandique, Manuel Enrique; Gomes, Beatriz M.; Gomes, Viviane; Gouveia Neto, Sergio Candido; Hanada, Lais de Carvalho; Holtgrieve, Gordon William; Kelly Batalha Silva, Roberta; Krusche, Alex; Kurzatkowski, Dariusz; Lacerda, Francisco A. Siebra; Leite, Nei; Logsdon, Miles Grant; Macedo, Gelson de; Marcondes, Renata; Marilheuza, Campos Paro; McGeoch, Lauren; Melo, Emanuele Gurgel de Freitas; Mendes, Francisco de Assis; Moreira, Marcelo Zacharias; Munhoz, Kelli; Neu, Vania; Ometto, Jean Pierre; Pimentel, Tania Pena; Priante Filho, Nicolau; Rabelo, Claudenir Silva; Rasera, Maria de Fatima Fernandes Lamy; Remington, Sonya Marie; Rodda, Sarah; Ruiz Mateus, Neuza Maria; Salimon, Cleber; Santiago, Alailson Venceslau; Santos, Arnoldo Marcilio dos; Silva, Cleoni Virginio da; Silva, Jonismar; Silva, Simao Correa da; Sousa, Eliete; Souzapetro, Petronio Lopes de; Toledo, Andre Marcondes Andrade; Tumang, Cristiane Azevedo; Umetsu, Cristiane Akemi; Victoria, Daniel de Castro and Xavier, Farley de Oliveira . You may contact Richey, Jeffrey E. (jrichey@uwashington.edu).
LBA Data Set Inventory ID: CD06_Outgassing
This data set provides estimates of monthly carbon dioxide (CO2) flux from the Amazon mainstem rivers, tributary stream networks, and their associated varzeas (floodplains). CO2 flux was calculated using two aggregation approaches: for defined river basins and for defined river reaches. Flux was calculated from (1) estimated surface water area by month for the Amazon mainstem rivers, associated varzeas, and tributary stream networks, (2) mean daily partial pressures of CO2 (pCO2) concentrations for the mainstem rivers, and (3) calculated mean pCO2 values for the varzea waters. Mean monthly discharge data for 11 mainstem rivers are also included.
2. Data Characteristics:
Data are available in five comma separated ASCII files:
File 1: Monthly_mean_hydrograph.csv
Mean monthly flow rates for 11 mainstem river basins. Reference Figure 2 rivers.
File 2: River_area_basin_scale.csv
Calculated areas of large and small rivers for defined basins. Basins in Files #2 and #3 are the same.
File 3: Calculated_CO2_fluxes_basins.csv
CO2 flux calculated from river areas and pCO2. Basins in Files #2 and #3 are the same.
File 4: Varzea_pCO2.csv
pCO2 of river reaches as defined in Figure 2.
File 5: Calculated_CO2_fluxes_reaches.csv
CO2 flux calculated from mainstem and floodplain river areas and pCO2 for reaches as defined in Figure 2.
File 1: Monthly_mean_hydrograph.csv
| Column | Heading | Units/format | Description |
|---|---|---|---|
| 1 | River_basin | River basin name (see Figure 2) | |
| 2 | Month | Month of the year | |
| 3 | Mean_monthly_dischage | m3/s | Monthly average discharge reported in meters cubed per second (m3/s) |
| 4 | Percent_max | % | Percent of maximum monthly average discharge |
| Missing data are indicated by -9999 | |||
Example data records
|
River_basin,Month,Mean_monthly_discharge ,Percent_max SPO,January,46495,73 Ica,January,5582,57 ... Japura,April,13450,67 Purus,April,18754,99 ... Xingu,December,3918,20 Tapajos,December,7198,37 |
File 2: River_area_basin_scale.csv
| Column | Heading | Units/format | Description | |
|---|---|---|---|---|
| 1 | Basin_name | Basin name | ||
| 2 | Basin_ID | Basin identification: each basin is assigned a unique numeric identifier | ||
| 3 | Total_basin_area | km2 | Total land area in the delineated basin reported in square kilometers (km2) | |
| 4 | Month | Month of the year | ||
| 5 | Area_large_rivers | km2 | Calculated area of rivers with a width greater than or equal to 100 m reported in square kilometers (km2). These rivers were detectable in satellite images | |
| 6 | Area_small_rivers | km2 | Calculated area of rivers with a width less than 100 m reported in square kilometers (km2). Area was derived by a stream density function since these were too small to be detected in imagery | |
| Missing data are indicated by -9999 | ||||
Example data records
|
Basin_name,Basin_ID,Total_basin_area,Month,Area_large_rivers,Area_small_rivers central varzea/channel,Basin 1 ,152830,Jan,28814,-9999 central varzea/channel,Basin 1 ,152830,Feb,28149,-9999 ... Manacapura,Basin 19,13013.67,May,2383,719 Manacapura,Basin 19,13013.67,Jun,3009,907 ... Xingu,Basin 5,56195.15,Nov,353,506 Xingu,Basin 5,56195.15,Dec,464,770 |
File 3: Calculated_CO2_fluxes_basins.csv
| Column | Heading | Units/format | Description |
|---|---|---|---|
| 1 | Basin_name | Basin name | |
| 2 | Basin_ID | Basin_ID | |
| 3 | Month | Month of the year | |
| 4 | SA_large_rivers | km2 | Surface area of large (greater than 100 m width) rivers in the basin reported in kilometers squared (km2) |
| 5 | pCO2_large_rivers | uM CO2/L | Mean pCO2 for the month from the CAMREX data reported in micromoles of CO2 per liter (uM CO2/L): where no direct measurements are available values for the nearest location were used |
| 6 | z_large_rivers | um | Surface boundary layer for the large rivers reported in microns (um) |
| 7 | CO2_flux_m2_large_rivers | umoles O2/m2/s | Evasion of CO2 from the large rivers reported in micromoles of CO2 per meter squared per second (uM CO2/m2/s) |
| 8 | CO2_flux_km2_large_rivers | mt CO2/km2/month | Evasion of CO2 from the large rivers reported in metric tons of CO2 per kilometer squared per month (mt CO2/km2/month) |
| 9 | CO2_flux_basin_large_rivers | Tg CO2/month | Evasion of CO2 from the large rivers reported in teragrams of CO2 per month for the entire basin (Tg CO2/month) |
| 10 | SA_small_rivers | km2 | Surface area of small ( less than 100 m width) rivers in the basin reported in square kilometers (km2) |
| 11 | pCO2_small_rivers | uM CO2/L | Mean pCO2 for the month from the CAMREX data reported in micromoles of CO2 per liter (uM CO2): where no direct measurements are available values for the nearest location were used |
| 12 | z_small_rivers | um | Surface boundary layer for the small rivers reported in microns (um) |
| 13 | CO2_flux_m2_small_rivers | umoles CO2/m2/s | Evasion of CO2 from the small rivers reported in micromoles of CO2 per meter squared per second (umol CO2/m2/s) |
| 14 | CO2_flux_km2_small_rivers | mt CO2/km2/month | Evasion of CO2 from the small rivers reported in metric tons of CO2 per kilometer squared per month (mt CO2/km2/month) |
| 15 | CO2_flux_basin_small_rivers | Tg CO2/month | Evasion of CO2 from the small rivers reported in teragrams of CO2 per month for the entire basin (Tg CO2/month) |
| Missing data are indicated by -9999 | |||
Example data records
|
Basin_name,Basin_ID,Month,SA_large_rivers,pCO2_large_rivers,z_large_rivers, CO2_flux_m2_large_rivers,CO2_flux_km2_large_rivers,CO2_flux_basin_large_rivers, SA_small_rivers,pCO2_small_rivers,z_small_rivers,CO2_flux_m2_small_rivers,CO2_flux_km2_small_rivers, CO2_flux_basin_small_rivers Javari,Basin 29,Jan,2734,159,183,1.82,57,0.16,2697,159,180,1.85,58,0.16 Javari,Basin 29,Feb,2931,174,183,1.99,63,0.18,2892,174,180,2.03,64,0.18 ... Manacapura,Basin 19,Nov,790,81,183,0.93,29,0.02,238,81,180,0.95,30,0.01 Manacapura,Basin 19,Dec,783,61,183,0.7,22,0.02,222,61,180,0.71,22,0 ... Xingu,Basin 5,Nov,353,105,183,1.2,38,0.01,506,105,180,1.22,39,0.02 Xingu,Basin 5,Dec,464,81,183,0.92,29,0.01,770,81,180,0.94,30,0.02 |
File 4: Varzea_pCO2.csv
| Column | Heading | Units/format | Description |
|---|---|---|---|
| 1 | Location | General description of the sampling location | |
| 2 | Reaches | The identity of the reaches included in the general sampling location. See accompanying information for more detail about the reaches (see Figure 2) | |
| 3 | Sampling_location | Description of the sample location: "surface depth" and "sides" are locations within lakes, while "all" includes all samples from lakes and paranas (side channels) | |
| 4 | pCO2_mean | uM CO2/L | Partial pressure of CO2 reported in micromoles of CO2 per liter (uM CO2/L) of water |
| 5 | pCO2_Stdev | uM CO2/L | Standard deviation of the mean value of pCO2 reported in micromoles of CO2 per liter (uM CO2/L) of water |
| 6 | N | Number of samples included in the calculation of the mean and standard deviation | |
| Missing data are indicated by -9999 | |||
Example data records
|
Location,Reaches,Sampling_location,pCO2_mean,pCO2_Stdev,N Upriver,1 through 10,All (surface + depth + sides + paranas),488,352,316 Upriver,1 through 10,Surface,392,269,121 ... Midriver,11 through 16,All (Off Solimoes + Off or near Madeira),339,185,49 Midriver,11 through 16,Off Solimoes ,313,180,35 ... Downstream,17 through 18,Sides,218,146,57 Downstream,17 through 18,Paranas (side channels) and tributaries,246,174,44 |
File 5: Calculated_CO2_fluxes_reaches.csv
| Column | Heading | Units/format | Description |
|---|---|---|---|
| 1 | Reach Name | Name of mainstem river reach (see Figure 2) | |
| 2 | Reach_ID | Numeric identification of river reach defining the mainstem (see Figure 2) | |
| 3 | Month | Month | |
| 4 | Area_mainstem | km2 | Area of the mainstem river in kilometers squared (km2) |
| 5 | pCO2_mainstem | uM CO2/L | Mean monthly pCO2 concentrations for each mainstem river reach based on measured values from CAMREX cruises reported in micromoles of CO2 per liter (uM CO2/L) |
| 6 | Z_mainstem | um | Surface boundary layer for the mainstem river reported in microns (um) |
| 7 | CO2_flux_m2_mainstem | umoles CO2/m2/s | Calculated rate of CO2 outgassing from the mainstem river surface reported in micromoles of CO2 per square meter per second |
| 8 | CO2_flux_km2_mainstem | mt CO2/km2/month | Calculated rate of CO2 outgassing from the mainstem river surface reported in metric tons of CO2 per square kilometer per month (mt CO2/km2/month) |
| 9 | CO2_flux_reach_mainstem | Tg CO2/month by reach | Total amount of CO2 outgassing from the mainstem river surface reported in teragrams of CO2 per delineated reach of the river per month (Tg CO2/month) |
| 10 | Area_ varzea | km2 | Area of the varzea region calculated from satellite images and reported in kilometers squared (km2) |
| 11 | pCO2_varzea | uM CO2/L | Mean pCO2 concentrations for the varzea regions based on measured values from CAMREX cruises reported in micromoles of CO2 per liter (uM CO2/L). Mean values were calculated for three regions: upriver; midriver and lower river |
| 12 | Z_varzea | um | Surface boundy layer for the varzea reported in microns (um) |
| 13 | CO2_flux_m2_varzea | micromoles CO2/m2/s | Calculated rate of CO2 outgassing from the varzea surface reported in micromoles of CO2 per square meter per second |
| 14 | CO2_flux_km2_varzea | mt CO2/km2/month | Calculated rate of CO2 outgassing from the varzea surface reported in metric tons of CO2 per square kilometer per month (mt CO2/km2/month) |
| 15 | CO2_flux_reach_varzea | Tg CO2/month by reach | Total amount of CO2 outgassing from the varzea surface reported in teragrams of CO2 per delineated reach of the river per month (Tg CO2/month) |
| Missing data are indicated by -9999 | |||
Example data records
|
Reach
Name,Reach_ID,Month,Area_mainstem ,pCO2_mainstem
,Z_mainstem,CO2_flux_m2_mainstem,CO2_flux_km2_mainstem,CO2_flux_reach_mainstem, Area_ varzea,pCO2_varzea,Z_varzea,CO2_flux_m2_varzea,CO2_flux_km2_varzea, CO2_flux_reach_varzea Border-SPO,R0,Jan,648,69,100,1.46,46,0.03,661,488,310,3.31,104,0.07 Border-SPO,R0,Feb,648,77,100,1.61,51,0.03,825,488,310,3.31,104,0.09 ... Itapeua,R11,Sep,360,205,78,5.52,174,0.06,2010,488,310,3.31,104,0.21 Itapeua,R11,Oct,360,187,78,5.03,159,0.06,1217,488,310,3.31,104,0.13 ... Obidos,R21,Nov,1332,131,58,4.74,149,0.2,2905,217,310,1.47,46,0.13 Obidos,R21,Dec,1332,86,58,3.13,99,0.13,2714,217,310,1.47,46,0.13 |
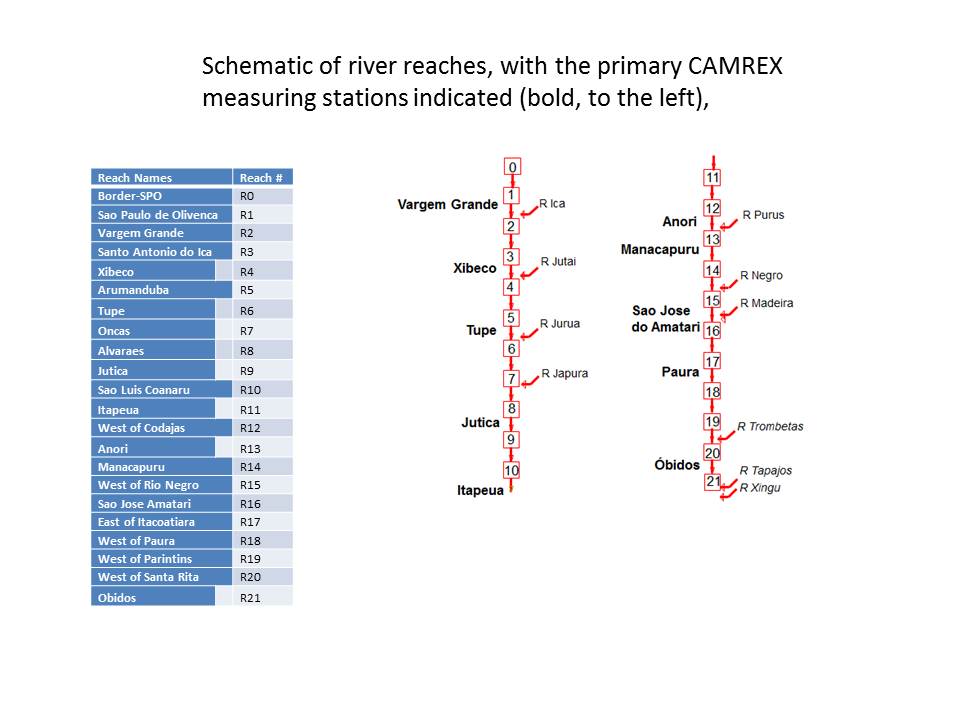
Figure 2. Amazon mainstem and tributary rivers and defined reaches for surface water area and CO2 flux calculations as used in data files #4 and #5.
Site boundaries: (All latitude and longitude given in decimal degrees)
| Site (Region) | Westernmost Longitude | Easternmost Longitude | Northernmost Latitude | Southernmost Latitude | Geodetic Datum |
|---|---|---|---|---|---|
| Amazon mainstem (Amazon Basin) | -72 | -52 | 0 | -7.5 | World Geodetic System, 1984 (WGS-84) |
Time period: This data set covers the period: 19820401-19960630
Platform/Sensor/Parameters measured include:
- COMPUTER MODEL /ANALYSIS / CARBON DIOXIDE
3. Data Application and Derivation:
Assuming that the fluxes computed for the Amazon are representative of fluvial environments of lowland humid tropical forests in general, surface water CO2 evasion in the tropics may help to explain an anomaly in the current balance of the global carbon cycle. Estimates that the tropics are a net carbon sink are not consistent with recent calculations from global inverse modeling, which imply that the tropics are at least in balance with the atmosphere if not a net source. Extrapolating over the global area covered by humid tropical forests with our estimate of areal evasion rates for the Amazon basin yields a flux of roughly 0.9 Gt C/yr (three times larger than previous estimates of global evasion). A return flux from water to the atmosphere of this magnitude comes closer to reconciling independent carbon budgets for the tropics (Richey et al., 2002).
4. Quality Assessment:
Area coverage and inundation: The uncertainty of the procedure was estimated using high-resolution airborne, digital videography (Hess et al., 2002) to be plus or minus 5% at high water and plus or minus 10% to 15% at low water.
pCO2 concentrations: The standard deviation ranged from 16% to 37% of mean monthly values. Annual profiles for each tributary were similarly constructed, with assumed standard deviations of 40% for each month. For regions not directly sampled, profiles were used from the nearest neighbor with data, with assumed uncertainties of 80%.
5. Data Acquisition Materials and Methods:
Delineation of Study Areas and SAR Mosaics
The central Amazon is a 1.77 million km2 quadrant covering the Amazon Basin between 0 and 8 degrees S latitude and 72 to 54 degrees W longitude. The Amazon Mainstem is a region covering the Amazon/Solimoes river mainstem from 70 degrees W to 54 degrees W..
Data from the Japanese Earth Resources Satellite-1 (JERS-1) L-band synthetic aperture radar were used to estimate the areal coverage and inundation status of rivers and floodplains over 100 m in width and compiled into mosaics for periods of high water (May through June 1996) and low water (October 1995) (Siqueira et al., 2000).
For each mosaic, the study area was classified into either flooded or non-flooded areas based on radar backscatter intensities as delineated by image segmentation (Barbosa et al., 2000), and was divided into 25 tributary sub-basins from the river network. To account for river corridors less than 100 m in width, an area density function was computed by extending a geometric series relating stream length and width to stream order from the river network for the whole basin, and applied to the study area.
Mean monthly stage data from multiyear hydrographic records within each tributary sub-basin (Richey et al., 2004) were used to estimate tributary flooding sequences by assuming a temporal correspondence between stage height and areal extent of inundation. The major tributaries are the Negro, Japura, Ica, Solimoes, Jutaı, Jurua, Purus, Madeira, and the Tapajos (Richey et al., 2002). For five sub-basins without gauging records, the normalized hydrograph for the nearest neighbor with similar climatology was used. The temporal sequence of inundation within the mainstem and its floodplain was computed from multi-year monthly composite Scanning Multichannel Microwave Radiometer (SMMR) data (Sippel et al., 1998).
CO2 Distributions
Data for the seasonal and spatial distributions of pCO2 within each hydrographic region were utilized from over 1,800 samples taken on 13 expeditions at different water stages throughout a 2,000 km reach of the central Amazon mainstem, tributary, and floodplain waters (Degens et al., 1991, Devol et al., 1995, Richey et al., 1988). A ten-year time series (Devol et al., 1995) at the Marchantaria mainstem station gave a statistically robust picture of seasonal trends in pCO2. The standard deviation ranged from 16% to 37% of mean monthly values. Annual profiles for each tributary were similarly constructed, with assumed standard deviations of 40% for each month. For regions not directly sampled, profiles were used from the nearest neighbor with data, with assumed uncertainties of 80%. Floodplain measurements exhibited no obvious seasonal trends but a pronounced gradient from higher concentrations upriver to intermediate and then lower concentrations downriver. Hence, results were aggregated by up-, mid-, and downriver sections.
CO2 Evasion
Evasion was computed from the gas transfer model, F=K(Cs-Co), where F is the evasive flux, Cs is the surface water concentration, Co is the atmospheric equilibrium, and K is the exchange coefficient (piston velocity). We determined K from direct measurements of O2 and 222Rn accumulation in free-floating chambers (Devol et al., 1987) on (1) the mainstem (K=2.3 +/- 0.9 meters/day) and (2) primary tributaries (K=1.2 +/- 0.5 meters/day) and of (3) CO2 and CH4 accumulation on the floodplain (K=0.65 +/ 0.25 meters/day).
A water temperature of 28 degrees C (Devol et al., 1987) and diffusion coefficient for CO2 in the range of 1.9 (25 C) to 2.4 (35 C) 10^-5 cm^2 sec^-1 (Jahne et al., 1987) was used in calculating the reported surface boundary layer (z).
6. Data Access:
This data is available through the Oak Ridge National Laboratory (ORNL) Distributed Active Archive Center (DAAC).
Data Archive Center:
Contact for Data Center Access Information:
E-mail: uso@daac.ornl.gov
Telephone: +1 (865) 241-3952
7. References:
Barbosa, C., Hess, L.,Melack, J. & Novo, E.Mapping Amazon Basin wetlands through region-growing segmentation and segmented-based classification of JERS-1 data. IX Latin Am. Symp. Remote Sensing (6 to10 November 2000) 1168 to 1176 (Universidad Nacional de Lujan, Puerto Iguazu, Argentina, 2000).
Degens, E. T., Kempe, S. & Richey, J. E. (eds) 1991. Biogeochemistry of Major World Rivers 323-397 (Wiley,Chichester).
Devol, A. H., Forsberg, B. R., Richey, J. E. & Pimentel, T. P. 1995. Seasonal variation in chemical distributions in the Amazon (Solimoes) River: a multiyear time series. Glob. Biogeochem. Cycles 9, 307-328.
Devol, A. H., Quay, P. D., Richey, J. E. & Martinelli, L. A. 1987. The role of gas exchange in the inorganic carbon, oxygen and 222 radon budgets of the Amazon River. Limnol. Oceanogr. 32, 235-248.
Hess, L., E.M.L.M. Novo, D.M. Slaymaker, J. Holt, C. Steffen, D.M. Valeriano, L.A.K. Mertes, T. Krug, J.M. Melack, M. Gastil, C. Holmes & C. Hayward 2002. Geocoded digital videography for validation of land cover mapping in the Amazon Basin. Int. J. Remote Sensing DOI:10.1080/01431160110092687
Jahne, B., G. Heinz, and W. Dietrich. 1987. Measurement of the Diffusion Coefficients of Sparingly Soluble Gases in Water. Journal of Geophysical Research, Vol. 92, NO. C10, Pages 10,767-10,776.
MacIntyre, S., Eugster, W. & Kling, G.W. 2001. in Gas Transfer at Water Surfaces (eds Donelan, M. A., Drennan, W. M., Saltzman, E. S. & Wanninkhof, R.) 135-139 (American Geophysical Union, Washington).
Richey, J. E., Devol, A. H., Wofsy, S. C., Victoria, R. & Ribeiro, M. N. G. 1988. Biogenic gases and the oxidation and reduction of carbon in the Amazon River and floodplain waters. Limnol. Oceanogr. 33,551-561.
Richey, J.E., R L. Victoria, J.I. Hedges, T. Dunne, L.A. Martinelli, L. Mertes, and J. Adams. 2008. Pre-LBA Carbon in the Amazon River Experiment (CAMREX) Data. Data set. Available on-line [http://daac.ornl.gov] from Oak Ridge National Laboratory Distributed Active Archive Center, Oak Ridge, Tennessee, U.S.A. doi:10.3334/ORNLDAAC/904.
Richey, J.E., J.M. Melack, A.K. Aufdenkampe, V.M. Ballester and L.L. Hess. 2002. Outgassing from Amazonian rivers and wetlands as a large tropical source of atmospheric CO2.Nature 416:617-619.
Richey, J. E., R.L. Victoria, Mayorga, E., Martinelli, L. A. & Meade, R. H. 2004. Integrated Analysis in a Humid Tropical Region- The Amazon Basin. Pages 415-428 in Vegetation, Water, Humans and the Climate(ed. Kabat, P. et al) Springer, Berlin.
Sippel, S. J., Hamilton, S. K., Melack, J. M. & Novo, E. M. 1998. Passive microwave observations of inundation area and the area/stage relation in the Amazon River floodplain. Int. J. Remote Sensing 19,3055-3074.
Siqueira, P. et al. 2000. A continental-scale mosaic of the Amazon Basin using JERS-1 SAR. IEEE Trans. Geosci. Remote Sensing 38, 2638-2644.