Get Data
Summary:
This data set provides spatially extensive and temporally intensive surveys of the river biogeochemistry of the Ji-Parana River Basin in Western Amazonia, Rondonia, Brazil. The concentrations of major nutrient ions, dissolved organic and inorganic carbon, pH, temperature, dissolved oxygen, and conductivity were measured in Ji-Parana River and tributary samples at the defined seasonal or monthly intervals. Dominant landuse/landcover classes, slope, and soil cation exchange capacity are included for each of the extensive sampling locations derived from river basin and sub-basin characteristics.
Water samples were collected from 1999 to 2003 along the main stem of the Ji-Parana River as well as from the major tributaries including the Urupa. Shapefiles with the boundaries of the major sub-basins of the study area as well as the location of the sample collection points are included for the intensive and extensive sampling campaigns as well as the Urupa River campaign.
There are six comma-separated data files (.csv) and five compressed shapefiles (.zip) with this data set.
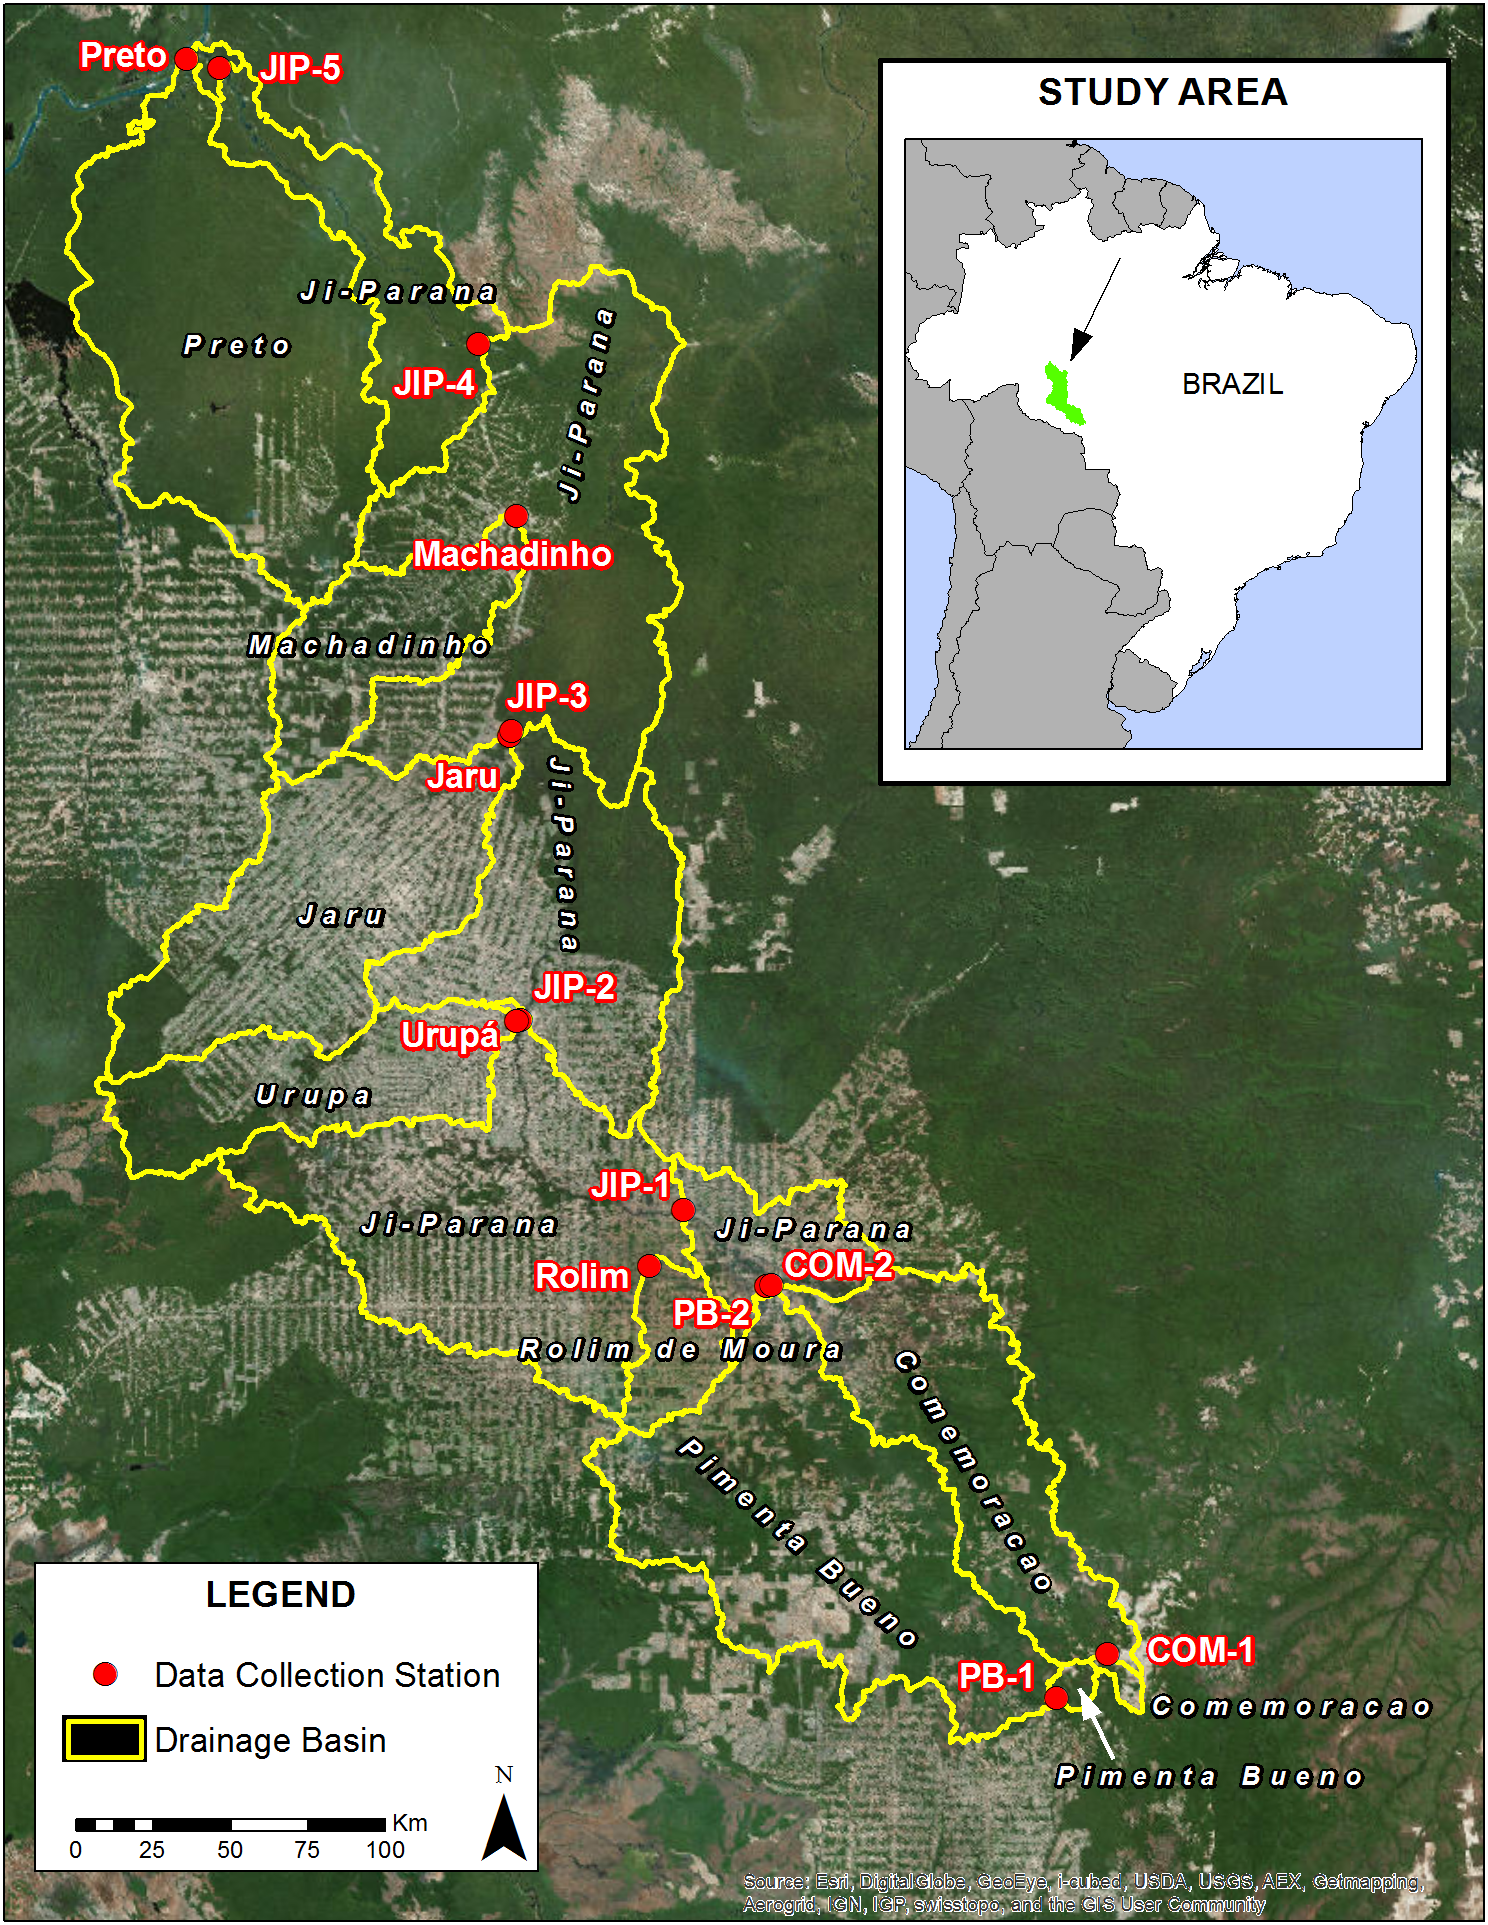
Figure 1. Map indicating the 14 sites for the intensive sampling campaign and river drainage basins.
Data Citation:
Cite this data set as follows:
Richey, J.E., A.V. Krusche, R.L. Victoria, M.V.R. Ballester, N.K. Leite, B.M. Gomes, M. Bolson, S.G. Neto, and A.A. Montebelo. 2014. LBA-ECO CD-06 Biogeochemistry of Ji-Parana River and Tributaries, Brazil: 1999-2003. Data set. Available on-line (http://daac.ornl.gov) from ORNL DAAC, Oak Ridge, Tennessee, USA. http://dx.doi.org/10.3334/ORNLDAAC/1227
Implementation of the LBA Data and Publication Policy by Data Users:
The LBA Data and Publication Policy [http://daac.ornl.gov/LBA/lba_data_policy.html] is in effect for a period of five (5) years from the date of archiving and should be followed by data users who have obtained LBA data sets from the ORNL DAAC. Users who download LBA data in the five years after data have been archived must contact the investigators who collected the data, per provisions 6 and 7 in the Policy.
This data set was archived in June 2014. Users who download the data between June 2014 and July 2019 must comply with the LBA Data and Publication Policy.
Data users should use the Investigator contact information in this document to communicate with the data provider.
Data users should use the Data Set Citation and other applicable references provided in this document to acknowledge use of the data.
Table of Contents:
- 1 Data Set Overview
- 2 Data Characteristics
- 3 Applications and Derivation
- 4 Quality Assessment
- 5 Acquisition Materials and Methods
- 6 Data Access
- 7 References
1. Data Set Overview
Project: LBA (Large-Scale Biosphere-Atmosphere Experiment in the Amazon)
Activity: LBA-ECO
LBA Science Component: Land Surface Hydrology
Team ID: CD-06 (Richey / Victoria)
The investigators were Richey, Jeffrey E.; Victoria, Reynaldo Luiz; Aalto, Rolf Erhart; Abdo, Mara Silvia Aguiar; Alin, Simone Rebecca; Aufdenkampe, Anthony K.; Ballester, Maria Victoria Ramos; Barbosa, Roosevelt Passos; Bernardes, Marcelo Correa; Bolson, Marcos Alexandre; Bonelle, Nilton; Brito, David Silva; Cogo, Michelle Cristine; Cunha, Hillandia Brandao; Silva, Luis Vilmar Souza da; Deus, Fabiano Alves de; Devol, Allan H.; Ellis, Erin Elizabeth; Ferro, Jaderson Coradi; Filho, Walter Jorge do Nascimento; Frickmann, Fernando Cruz; Guandique, Manuel Enrique Gamero; Gomes, Beatriz M.; Neto, Sergio Candido Gouveia; Hanada, Lais de Carvalho; Holtgrieve, Gordon William; Krusche, Alex V.; Lacerda, Francisco A. Siebra; Leite, Nei Kavaguichi; Logsdon, Miles Grant; Macedo, Gelson de; Marcondes, Renata; McGeoch, Lauren; Melo, Emanuele Gurgel de Freitas; Mendes, Francisco de Assis; Moreira, Marcelo Zacharias; Neu, Vania; Oliveira, Carolina Barisson Marques; Ometto, Jean Pierre H.B.; Pimentel, Tania Pena; Filho, Nicolau Priante; Rasera, Maria de Fatima Fernandes Lamy; Remington, Sonya Marie; Rodda, Sarah; Salimon, Cleber Ibraim; Santiago, Alailson Venceslau; Santos, Arnoldo Marcilio dos; Silva, Cleoni Virginio da; Silva, Jonismar Souza; Silva, Simao Correa da; Souzapetro, Petronio Lopes de; Toledo, Andre Marcondes Andrade; Tumang, Cristiane Azevedo and Victoria, Daniel de Castro. You may contact Ballester, Maria Victoria Ramos (vicky@cena.usp.br) and Krusche, Alex V. (alex@cena.usp.br)
LBA Data Set Inventory ID: CD06_BGC_JiParana
This data set provides spatially extensive and temporally intensive surveys of the river biogeochemistry of the Ji-Parana River Basin (Rondonia State, Western Amazonia). The concentrations of major nutrient ions, dissolved organic and inorganic carbon, pH, temperature, dissolved oxygen, and conductivity were measured. Landcover data of dominant land use covers and soil cation exchange capacity are included for stations in the Ji Parana Basin corresponding to the extensive sampling locations.
Water samples were collected from 1999 to 2003 along the main stem of the Ji-Parana river as well as from the major tributaries including the Urupa. Shapefiles with the boundaries of the major sub-basins of the study area as well as the location of the sample collection points are included for the intensive and extensive sampling campaigns as well as the Urupa river campaign.
Related Data Sets
- LBA-ECO CD-06 Ji-Parana River Basin Land Use and Land Cover Map, Brazil: 1999 (Land use and land cover map for the study region)
- LBA-ECO CD-06 Physical, Political, and Hydrologic Maps, Ji-Parana River Basin, Brazil (Hydrologic, physical and political maps of the study area)
- LBA-ECO CD-06 Soil Classification Map, Ji-Parana River Basin, Rondonia, Brazil (Soils classification map of the study area)
- LBA-ECO CD-06 Water Balance of the Ji-Parana River Basin, Brazil: 1995-1996 (Water balance calculated for the study area)
- LBA-ECO CD-06 Land Use/Land Cover Time Series, Ji-Parana Basin, Brazil: 1986-2001 (Land Use and Land cover time series for the study area)
2. Data Characteristics:
There are six comma-separated (.csv) data files and five compressed shapefiles (.zip) with this data set.
Data File Descriptions:
- Ji_Parana_Intensive_bgc.csv and Ji_Parana_Org_matter_chemistry.csv
Basic riverwater chemistry and organic matter chemistry were measured nine times over a three year period at 14 sites. - Extensive_sites_bgc_wet_season.csv and Extensive_sites_bgc_dry_season.csv
A more spatially extensive sampling of riverwater with the same chemistry measurements was done once in the dry season and once in the wet season at a larger set of sampling points (38 and 33 sites, respectively) within the Ji Parana Basin. - Urupa_bgc.csv
Weekly collections of river water between Nov 2001 and May 2003 were done at six stations on the Urupa River for the same basic chemistry measurements. - Ji_Parana_Extensive_landcover_soils.csv
An analysis of dominant land use classes is provided for stations in the Ji Parana Basin corresponding to the extensive sampling locations. - ext_sampling_sites.zip, ext_sub-basins.zip, int_sites.zip,
int_sub_basins.zip, and urupa_basin.zip
Five shape files with the boundaries of the major sub-basins of the study area as well as the location of the sample collection points available for the intensive and extensive sampling campaigns as well as the Urupa river campaign.
There is also a companion file, CD06_BGC_JP_sites_coordinates.csv which contains the site coordinates, names, and site codes of the sampling sites. Note that this information is also provided in the individual data files.
The comma-separated (.csv) data files are organized as follows:
File #1: Ji_Parana_Intensive_bgc.csv
Sampling dates: 1999-05 to 2002-04 (no sampling day provided).
| Column | Column Heading | Units/format | Description |
|---|---|---|---|
| 1 | Year | YYYY | Year of sampling (YYYY) |
| 2 | Month | M | Month of sampling (M) |
| 3 | Long | decimal degrees | Location of the sampling site in decimal degrees of longitude; negative values indicate west of the Prime Meridian |
| 4 | Lat | decimal degrees | Location of the sampling site in decimal degrees of latitude; negative values indicate south of the Equator |
| 5 | Site_Name | Sampling site name or description | |
| 6 | Site_Code | Sampling site location code | |
| 6 | Temp | degrees C | Water temperature reported in degrees Celsius (degrees C) |
| 7 | pH | pH of water sample | |
| 8 | Cond | uS/cm | Conductivity of sample in microSiemens per centimeter (uS/cm) |
| 9 | OD_conc | ppm | Concentration of dissolved oxygen reported in parts per million (ppm) |
| 10 | OD_sat | % sat | Concentration of dissolved oxygen reported in percent saturation (%sat) |
| 11 | AOU | uM | Apparent oxygen utilization defined as the deviation of the concentration expected if dissolved O2 was in equilibrium with atmosphere reported in micromoles of oxygen per liter (uM) |
| 12 | Resp | uM/h | Respiration reported in micromoles of CO2 per hour (uM/h) |
| 13 | DOC_wt | ppm | Concentration of dissolved organic carbon reported in parts per million (ppm) |
| 14 | DIC_mol | uM | Concentration of dissolved inorganic carbon reported in micromoles of carbon per liter (uM) |
| 15 | CO2_excess | uM | Excess CO2 defined as the deviation of the concentration expected if dissolved CO2 was in equilibrium with atmosphere reported in micromoles of CO2 per liter (uM) |
| 16 | HCO3 | uM | Concentration of bicarbonate reported in micromoles of HCO3 per liter (uM) |
| 17 | CO3 | uM | Concentration of carbonate reported in micromoles of CO3 per liter (uM) |
| 18 | Cl | uM | Chloride ion concentration reported in micromoles per liter (uM) |
| 19 | NO2 | uM | Nitrite ion concentration reported in micromoles per liter (uM) |
| 20 | NO3 | uM | Nitrate ion concentration reported in micromoles per liter (uM) |
| 21 | PO4 | uM | Phosphate ion concentration reported in micromoles per liter (uM) |
| 22 | SO4 | uM | Sulfate ion concentration reported in micromoles per liter (uM) |
| 23 | Na | uM | Sodium ion concentration reported in micromoles per liter (uM) |
| 24 | NH4 | uM | Ammonium ion concentration reported in micromoles per liter (uM) |
| 25 | K | uM | Potassium ion concentration reported in micromoles per liter (uM) |
| 26 | Mg | uM | Magnesium ion concentration reported in micromoles per liter (uM) |
| 27 | Ca | uM | Calcium ion concentration reported in micromoles per liter (uM) |
| 28 | TZ_HCO3 | ueq/L | Sum of negative charges calculated using the concentrations reported in columns 16 through 22 reported in microequivalents per liter (ueq/L) |
| 29 | TZ_DIC | ueq/L | Sum of negative charges calculated as for the previous column but using the concentration of DIC reported in column 14 instead of the HCO3 concentration reported in microequivalents per liter (ueq/L) |
| 30 | TZ_pos | ueq/L | Sum of positive charges calculated using the concentrations reported in columns 23 through 27 reported in microequivalents per liter (ueq/L) |
| 31 | TZ_neg_TZ_pos | Ratio of negative to positive charges calculated as column 29 divided by column 30 | |
| 32 | CSS | mg sed/L | Coarse suspended sediments reported in milligrams of sediment per liter (mg sed/L) |
| 33 | FSS | mg sed/L | Fine suspended sediments reported in milligrams of sediment per liter (mg sed/L) |
| 34 | TSS | mg sed/L | Total suspended sediments reported in milligrams of sediment per liter (mg sed/L) |
| Missing data are represented by -9999 and values below detection limits are represented by zeros | |||
Sample data from File #1:
|
Year,Month,Long,Lat,Site_Name,Site_Code,Temp,pH,Cond,OD_conc,OD_sat,AOU,Resp,DOC_wt,DIC_mol, CO2_excess, HCO3,CO3,Cl,NO2,NO3,PO4,SO4,Na,NH4,K,Mg,Ca,TZ_HCO3,TZ_DIC,TZ_pos,TZ_neg_TZ_pos,CSS,FSS,TSS 1999,5,1,COM-1,May-99,24.7,4.26,7.46,7.38,89.2,29.38,0.23,1.53,58.64,47.84, 0.44, -9999,7.36,-9999,9.25,-9999,1.3,5.18,-9999,2.84,1.88,1.83,19.64,77.84, 15.45,5.04,-6.23,-40.17,1.98,1.41,3.39 1999,5,2,COM-2,May-99,25.9,6.29,17.9,8.03,99.1,3.44,0.42,4.29,114.32,50.78, 53.22,-9999,10.04,-9999,8.02,-9999,2.52,20.5,4.51,25.03,18.51,21.75,76.32, 137.42,126.05,1.09,-6.49,-38.25,6.04,26.83,32.87 .... 2000,9,-60.3703,-12.8674,Pimenta Bueno 1,PB-1,25.5,5.83,6.5,7.82,95.8,11.88,0.2,1.36,182.27,129.67,42.28,-9999, 4.71,1.44,13.9,-9999,0.2,6.23,5,13.33,4.52,3.84,61.29,201.28,36.28,5.55,3.36,6.27,9.64 2000,9,-61.1945,-11.6831,Pimenta Bueno 2 ,PB - 2,28.9,7.12,28.9,7.32,95.3,12.81,0.16,4.02,440.91,53.87,376.7, 0.23,10.08,10.13,10.24,-9999,2.5,45.51,4.84,42.56,52.4,63.89,402.02,466.23,320.66,1.45,1.26,13.99,15.25 ... 2002,4,-61.9608,-9.4254,Machadinho River,MAC,27.3,6.21,16.1,6.04,76.4,242.09,0.14,2.85,133.14,0,55.93,-9999,7.1,-9999,4.42,-9999,0.78,28.59,4,31.84,15.68,14.63,69,146.21,121.06,1.21,11.13,0.34,11.47 2002,4,-62.928291,-8.091527,Preto River,PRETO,26.7,5.45,7.5,4.66,58.4,246.28,0.12,2.54,93.14,0,10.41,-9999,7.48,-9999,2.54,-9999,0.73,11.69,1.55,7.8,2.54,3.68,21.89,104.62,31.93,3.28,5.84,0.52,6.36 |
File #2: Ji_Parana_Org_matter_chemistry.csv
Sampling dates: 1999-05 to 2001-05 (no sampling day provided).
| Column | Column Heading | Units/format | Description |
|---|---|---|---|
| 1 | Year | YYYY | Year in which samples were collected and measurements made (YYYY) |
| 2 | Month | M | Month in which samples were collected and measurements made (M) |
| 3 | Long | decimal degrees | Location of the sampling site in decimal degrees of longitude; negative values indicate west of the Prime Meridian |
| 4 | Lat | decimal degrees | Location of the sampling site in decimal degrees of latitude; negative values indicate south of the Equator |
| 5 | Site_Name | Sampling site name or description | |
| 6 | Site_Code | Sampling site location code | |
| 7 | Size_fraction | Measurements were made on three distinct components: coarse suspended solids (CSS: greater than 63 um diameter); fine suspended solids (FSS; greater than 0.1 and less than or equal to 63 um diameter); and ultrafine dissolved organic matter (UDOM) | |
| 8 | delta_13C | per mil | delta 13C defined as the ratio of 13C to 12C in the sample relative to the Pee Dee Belemnite standard (PDB) |
| 9 | Org_C_conc | percent | Concentration of organic C in the organic matter sample |
| 10 | delta_15N | per mil | delta 15N defined as the ratio of 15N to 14N in the sample relative to atmospheric nitrogen |
| 11 | N_conc | percent | Concentration of total N in the organic matter sample |
| 12 | NtoC | Ratio of nitrogen to carbon calculated from the measured carbon and nitrogen concentrations and reported on a mass basis | |
| 13 | Lambda | mg per 100 g Corg | Total yield of lignin-derived phenols normalized to 100 mg of organic carbon in the sample |
| 14 | Acid_Ald | Acid-to-aldehyde ratio of vanillyl phenol | |
| 15 | Cin_to Van | The ratio of the sum of cinnamyl phenols to vanillyl phenol | |
| 16 | Syr_to_Van | The ratio of the sum of syringyl phenols to vanillyl phenol | |
| 17 | Q | m3 per s | Annual mean discharge based on measured rates between 1999 and 2001 and reported in cubic meters per second |
| missing data are represented by -9999 | |||
Sample data from File #2:
|
Year,Month,Long,Lat,Site_Name,Site_Code,Size_fraction,delta_13C,Org_C_conc,delta_15N,N_conc,NtoC, Lambda,Acid_Ald,Cin_to Van,Syr_to_Van,Q 1999,9,COM-1,FSS,-9999,-9999,-9999,-9999,-9999,-9999,-9999,-9999,-9999,-9999 1999,9,-60.1906,-12.7333,Comemoracao 1 ,COM-1,FSS,-9999,-9999,-9999,-9999,-9999,-9999,-9999,-9999,-9999,-9999 1999,9,-60.3703,-12.8674,Pimenta Bueno 1 ,PB-1,FSS,-9999,-9999,-9999,-9999,-9999,-9999,-9999,-9999,-9999,-9999 ... 2000,2,-60.1906,-12.7333,Comemoracao 1 ,COM-1,FSS,-9999,-9999,-9999,-9999,-9999,-9999,-9999,-9999,-9999,-9999 2000,2,-60.3703,-12.8674,Pimenta Bueno 1 ,PB-1,FSS,-9999,-9999,-9999,-9999,-9999,-9999,-9999,-9999,-9999,-9999 ... 2001,3,-62.0564,-8.93097,Ji-Parana River 4 ,JIP-4,UDOM,-26.87,23.4,4.74,0.9,0.039,-9999,-9999,-9999,-9999,-9999 2001,3,-62.7342,-8.32701,Ji-Parana River 5 ,JIP-5,UDOM,-9999,-9999,-9999,-9999,-9999,-9999,-9999,-9999,-9999,-9999 |
File #3: Extensive_sites_bgc_wet_season.csv
No sampling dates provided.
| Column | Column Heading | Units/format | Description |
|---|---|---|---|
| 1 | Long | decimal degrees | Location of the sampling site in decimal degrees of longitude; negative values indicate west of the Prime Meridian |
| 2 | Lat | decimal degrees | Location of the sampling site in decimal degrees of latitude negative values indicate south of the Equator |
| 3 | Site_Code | Site alphanumeric codes | |
| 4 | Site_Name | Sampling site name or description | |
| 5 | Cond | uS/cm | Conductivity of the water sample reported in microSiemens per centimeter (uS/cm) |
| 6 | OD_sat | % sat | Concentration of dissolved oxygen reported in percent saturation (%sat) |
| 7 | AOU | uM | Apparent oxygen utilization defined as the deviation of the concentration expected if dissolved O2 was in equilibrium with atmosphere reported in micromoles of oxygen per liter (uM) |
| 8 | Resp | uM/h | Respiration reported in micromoles of CO2 per hour (uM/h) |
| 9 | DOC_mol | uM | Concentration of dissolved organic carbon reported in micromoles of carbon per liter (uM) |
| 10 | DIC_mol | uM | Concentration of dissolved inorganic carbon reported in micromoles of carbon per liter (uM) |
| 11 | CO2_excess | uM | Excess CO2 defined as the deviation of the concentration expected if dissolved CO2 was in equilibrium with atmosphere reported in micromoles of CO2 per liter (uM) |
| 12 | CO2_free | uM | Concentration of free CO2 (also called hydrated CO2) reported in micromoles of CO2 per liter (uM) |
| 13 | pCO2 | uM | Partial pressure of CO2 reported in micromoles of CO2 per liter (uM) |
| 14 | HCO3 | uM | Concentration of bicarbonate reported in micromoles of HCO3 per liter (uM) |
| 15 | CO3 | uM | Concentration of carbonate reported in micromoles of CO3 per liter (uM) |
| 16 | Cl | uM | Chloride ion concentration reported in micromoles per liter (uM) |
| 17 | NO2 | uM | Nitrite ion concentration reported in micromoles per liter (uM) |
| 18 | SO4 | uM | Sulfate ion concentration reported in micromoles per liter (uM) |
| 19 | NO3 | uM | Nitrate ion concentration reported in micromoles per liter (uM) |
| 20 | PO4 | uM | Phosphate ion concentration reported in micromoles per liter (uM) |
| 21 | Na | uM | Sodium ion concentration reported in micromoles per liter (uM) |
| 22 | NH4 | uM | Ammonium ion concentration reported in micromoles per liter (uM) |
| 23 | K | uM | Potassium ion concentration reported in micromoles per liter (uM) |
| 24 | Mg | uM | Magnesium ion concentration reported in micromoles per liter (uM) |
| 25 | Ca | uM | Calcium ion concentration reported in micromoles per liter (uM) |
| 26 | FSS | mg sed/L | Fine suspended sediments reported in milligrams of sediment per liter (mg sed/L) |
| 27 | CSS | mg sed/L | Coarse suspended sediments reported in milligrams of sediment per liter (mg sed/L) |
| 27 | TSS | mg sed/L | Total suspended sediments reported in milligrams of sediment per liter (mg sed/L) |
| missing data are represented by -9999 | |||
Sample data from File #3:
|
Long,Lat,Site_Code,Site_Name,Cond,OD_sat,AOU,Resp,DOC_mol,DIC_mol,CO2_excess,CO2_free,pCO2, HCO3,CO3,Cl,NO2,SO4,NO3,PO4,Na,NH4,K,Mg,Ca,FSS,CSS,TSS -60.19064,-12.73326,COM-1,Comemoracao 1,12.1,91.5,23.125,0.08,177.25,32.02,19,29.4,0.1,2.7,0,8.5,-9999,0.4,10.1,-9999,12.2,0.3,3,1.9,4.9,9.6,0.4,10 -60.26182,-12.61035,C-2,Second Station on Comemoracao,8.2,87.8,32.5,0.13,133.89,36.64,19.9,30.3,0.1,6.3,0,21.1,-9999,0.3,17,-9999,23.3,1.2,4.5,2.4,5,2.2,3.8,6 ... -61.64514,-11.72705,R-3,Bamburro Stream,67.1,80.7,49.0625,0.29,391.53,745.68,165.7,176,0.6,569.5,0.2,20.9,4.9,0.9,-9999,-9999,175,-9999,79.4,91,111,42.4,2,42.6 -61.7145,-11.90544,R-2,Bamburro Stream at Santa Luzia,118.7,81.1,50,0.23,369.64,1375.68,159.8,170.2,0.5,1204.6,0.9,22.1,7,1.4,-9999,-9999,294.3,-9999,70.2,175.6,237,51.2,10.4,61.6 ... -62.83156,-10.81348,JA-4,Jaru River at Tarilandia,45.1,85.2,38.75,0.15,303.64,403.64,97.2,107.5,0.3,296.1,0.1,10.4,3.1,1.5,1.2,-9999,110.2,-9999,62.7,43.4,73,16.1,3.3,19.4 -62.61016,-11.08211,U-4,Urupa River at Mirante da Serra,22.9,82.7,44.6875,0.13,250.75,207.59,62.2,72.5,0.2,135,0,7.8,8.1,2.9,4.4,-9999,54.7,0.3,34.7,27,30.3,-9999,-9999,-9999 |
File #4: Extensive_sites_bgc_dry_season.csv
Sampling dates: 2001-07-02 to 2001-07-19
| Column | Column Heading | Units/format | Description |
|---|---|---|---|
| 1 | Long | decimal degrees | Location of the sampling site in decimal degrees of longitude: negative values indicate west of the Prime Meridian |
| 2 | Lat | decimal degrees | Location of the sampling site in decimal degrees of latitude negative values indicate south of the Equator |
| 3 | Site_Code | Site code for site name or "None" if none provided | |
| 4 | Site Name | Sampling site name or description | |
| 5 | Date | YYYYMMDD | Sampling date |
| 6 | Time | HH:MM | Sampling time in local time reported using a 24 hour clock |
| 7 | Temp | degrees C | Water temperature reported in degrees Celsius (degrees C) |
| 8 | pH | pH of the water sample reported in pH units | |
| 9 | Cond | uS/cm | Conductivity of the water sample reported in microSiemens per centimeter (uS/cm) |
| 10 | OD_conc | ppm | Concentration of dissolved oxygen reported in parts per million (ppm) |
| 11 | OD_sat | % sat | Concentration of dissolved oxygen reported in percent saturation (% sat) |
| 12 | AOU | uM | Apparent oxygen utilization defined as the deviation of the concentration expected if dissolved O2 was in equilibrium with atmosphere reported in micromoles of oxygen per liter (uM) |
| 13 | Resp | uM/h | Respiration reported in micromoles of CO2 per hour (uM/h) |
| 14 | DOC_wt | mg/L | Concentration of dissolved organic carbon reported in milligrams of carbon per liter (mg/L) |
| 15 | DOC_mol | uM | Concentration of dissolved organic carbon reported in micromoles of carbon per liter (uM) |
| 16 | DIC_wt | mg/L | Concentration of dissolved inorganic carbon reported in milligrams of carbon per liter (mg/L) |
| 17 | DIC_mol | uM | Concentration of dissolved inorganic carbon reported in micromoles of carbon per liter (uM) |
| 18 | CO2_excess | uM | Excess CO2 defined as the deviation of the concentration expected if dissolved CO2 was in equilibrium with atmosphere reported in micromoles of CO2 per liter (uM) |
| 19 | CO2_free | uM | Concentration of free CO2 (also called hydrated CO2) reported in micromoles of CO2 per liter (uM) |
| 20 | pCO2 | uM | Partial pressure of CO2 reported in micromoles of CO2 per liter (uM) |
| 21 | HCO3 | uM | Concentration of bicarbonate reported in micromoles of HCO3 per liter (uM) |
| 22 | CO3 | uM | Concentration of carbonate reported in micromoles of CO3 per liter (uM) |
| 23 | Cl | uM | Chloride ion concentration reported in micromoles per liter (uM) |
| 24 | NO2 | uM | Nitrite ion concentration reported in micromoles per liter (uM) |
| 25 | NO3 | uM | Nitrate ion concentration reported in micromoles per liter (uM) |
| 26 | PO4 | uM | Phosphate ion concentration reported in micromoles per liter (uM) |
| 27 | SO4 | uM | Sulfate ion concentration reported in micromoles per liter (uM) |
| 28 | Na | uM | Sodium ion concentration reported in micromoles per liter (uM) |
| 29 | NH4 | uM | Ammonium ion concentration reported in micromoles per liter (uM) |
| 30 | K | uM | Potassium ion concentration reported in micromoles per liter (uM) |
| 31 | Mg | uM | Magnesium ion concentration reported in micromoles per liter (uM) |
| 32 | Ca | uM | Calcium ion concentration reported in micromoles per liter (uM) |
| 33 | FSS | mg sed/L | Fine suspended sediments reported in milligrams of sediment per liter (mg sed/L) |
| 34 | CSS | mg sed/L | Coarse suspended sediments reported in milligrams of sediment per liter (mg sed/L) |
| 35 | TSS | mg sed/L | Total suspended sediments reported in milligrams of sediment per liter (mg sed/L) |
| missing data are represented by -9999 | |||
Sample data from File #4:
|
Long,Lat,Site_Code,Site_Name,Date,Time,Temp,pH,Cond,OD_conc,OD_sat,AOU,Resp,DOC_wt,DOC_mol, DIC_wt,DIC_mol,CO2_excess,CO2_free,pCO2,HCO3,CO3,Cl,NO2,NO3,PO4,SO4,Na,NH4,K,Mg,Ca,FSS, CSS,TSS -60.11478,-12.87033,None,Headwaters of Piracolino Stream,20010702,15:20,-9999,5.58,-9999,7.55,91.8,-9999,-9999,-9999,-9999,1.72,39.11,-9999,35.56,0.11,3.56,0,11.87,-9999,0.64,0.46,0.59,12.95,30.89,11.66,2.96,2.59,-9999,-9999,-9999 -60.19064,-12.73326,COM-1,Comemoracao 1 (COM-1),20010703,7:45,21.7,5.05,5.53,7.9,90.2,27.81,0.09,0.91,76.08,1.17,26.55,14.88,25.36,0.08,1.19,0,3.62,0.12, 9.23,0.09,0.25,6.51,18.81,3.54,1.23,1.38,5.5,0.64,6.14 ... -61.08051,-12.29893,P-2,Pimenta Bueno River at Boa Esperanca,20010705,11:00,26,7.07,34.1,7.37,91.4,23.75,0.09,1.59,132.63,13.75,312.5,39.69,49.99,0.16, 262.36,0.14,4.73,9.74,9.87,0.25,0.36,45.13,11.79,22.64,59.15,75.18,22.77,1.71,24.48 -61.19186,-11.66643,COM-2,Comemoracao 2 (COM-2)20010705,16:00,26,6.29,9.86,7.91,98,6.88,0.09,1.52,127,2.44,55.52,19.37,29.67,0.09,25.85,0,6.66,-9999,8.96,0.01,2.13,15.74,27.21,17.15,8.24,11.78,10.06,0.84,10.9 ... -62.83156,-10.81348,JA-4,Jaru River at Tarilandia,20010718,14:45,27.5,6.89,54.6,7.13,90.7,24.69, -9999,2.18,181.42,23.89,542.95,111.37,121.5,0.39,421.3,0.15,12.86,14.13,8.83,0.01,3.08,157.22, -9999,88.59,68.43,134.79,10.7,0.59,11.29 -62.61016,-11.08211,U-4,Urupa River at Mirante da Serra,20010719,9:15,26,6.9,37.9,6.06,74.9,64.69,-9999,2.61,217.44,16.26,369.55,70.92,81.23,0.26,288.21,0.11,22.92,9.12,2.61,0.01,2.55,93.43,24.89,58.08, 61.69,83.92,9.24,0.5,9.74 |
File #5: Urupa_bgc.csv
Sampling dates: 2001-11-06 to 203-05-20. Samples were collected along the Urupa River between the cities of Ji-Parana and Urupá, Urupa River at Urupa, Urupa River upstream of Urupa, and the Urupa River at Mirante da Serra. There were also two additional samplng sites however the coordinates for those sites were not provided.
| Column | Column Heading | Units/format | Description |
|---|---|---|---|
| 1 | Long | decimal degrees | Location of the sampling site in decimal degrees of longitude: negative values indicate west of the Prime Meridian |
| 2 | Lat | decimal degrees | Location of the sampling site in decimal degrees of latitude negative values indicate south of the Equator |
| 3 | Site_Code | Site code for site name or "None" if none provided | |
| 4 | Site_Name | Sampling site name or description | |
| 5 | Date | YYYYMMDD | Sampling date |
| 6 | Time | HH:MM | Sampling time in local time reported using a 24 hour clock |
| 7 | Temp | degrees C | Water temperature reported in degrees Celsius (degrees C) |
| 8 | pH | pH of the water sample reported in pH units | |
| 9 | Cond | uS/cm | Conductivity of the water sample reported in microSiemens per centimeter (uS/cm) |
| 10 | OD_conc | ppm | Concentration of dissolved oxygen reported in parts per million (ppm) |
| 11 | OD_sat | % sat | Concentration of dissolved oxygen reported in percent saturation (%sat) |
| 12 | Resp | uM/h | Respiration reported in micromoles of CO2 per hour (uM/h) |
| 13 | Cl | uM | Chloride ion concentration reported in micromoles per liter (uM) |
| 14 | NO2 | uM | Nitrite ion concentration reported in micromoles per liter (uM) |
| 15 | SO4 | uM | Sulfate ion concentration reported in micromoles per liter (uM) |
| 16 | NO3 | uM | Nitrate ion concentration reported in micromoles per liter (uM) |
| 17 | PO4 | uM | Phosphate ion concentration reported in micromoles per liter (uM) |
| 18 | Na | uM | Sodium ion concentration reported in micromoles per liter |
| 19 | NH4 | uM | Ammonium ion concentration reported in micromoles per liter (uM) |
| 20 | K | uM | Potassium ion concentration reported in micromoles per liter (uM) |
| 21 | Mg | uM | Magnesium ion concentration reported in micromoles per liter (uM) |
| 22 | Ca | uM | Calcium ion concentration reported in micromoles per liter (uM) |
| 23 | DOC_wt | mg/L | Concentration of dissolved organic carbon reported in milligrams of carbon per liter (mg/L) |
| 24 | DIC_wt | mg/L | Concentration of dissolved inorganic carbon reported in milligrams of carbon per liter (mg/L) |
| 25 | DOC_mol | uM | Concentration of dissolved organic carbon reported in micromoles of carbon per liter (uM) |
| 26 | DIC_mol | uM | Concentration of dissolved inorganic carbon reported in micromoles of carbon per liter (uM) |
| 27 | OD_umol | uM | Concentration of dissolved oxygen reported in micromoles of oxygen per liter of water |
| missing data are represented by -9999 | |||
Sample data from File #5:
| Long,Lat,Site_Name,Site_code,Date,Time,Temp,pH,Cond,OD,OD_sat,Resp,Cl,NO2,SO4,NO3,PO4,Na,NH4,K, Mg,Ca,DOC_wt,DIC_wt,DOC_mol,DIC_mol,OD_umol, -62.1177,-11.0019,Urupa River between the cities of Ji-Parana and Urupá,U-1,20011106,8:10,25,6.04,24.3,7.28,88.4,0.225,7.08,3.76,3.78,3.96,-9999,38.49, 40.92,59.51,32.07,25.91, 6.22,6.78,518.04,154.02,227.5 -62.1177,-11.0019,Urupa River between the cities of Ji-Parana and Urupá,U-1,20011113,8:11,26.3,6.26,20.8,6.68,82.9,0.079,7.13,4.56,3.76,4.06,-9999, 35.95,38.41,52.81,34.25,30.59,4.76,7.85,396.58,178.34,208.75 ... -62.546,-11.1261,Urupa River upstream of Urupa,U-3,20011120,11:50,29.3,7.09,52.5,7.3,95.6,0.186,13.2,11.62,3.15,-9999,-9999,112.46,12.91,85.24,92.45,117.6,3.81,21.92,317.17,498.18,228.13 -62.546,-11.1261,Urupa River upstream of Urupa,U-3,20011127,11:30,27.6,6.63,43,7.17,91,0.258,16.9,8.84,6.39,1.58,-9999,121.21,-9999,117.96,75.7,91.89,8.08,16.04,673.71,364.55,224.06 ... -9999,-9999,-9999,U-6,20030506,17:20,27.4,7.05,50.4,6.41,79.7,0.231,18.6,-9999,2.17,-9999,2.2,104.67,1.61,-9999,71.62,91.54,5.87,21.38,-9999,-9999,-9999 -9999,-9999,-9999,U-6,20030520,16:32,29.2,7.32,55.4,7.6,97.4,0.125,10.34,-9999,0.31,-9999,1.48,115.22,0.76,51.2,86.5,110.33,2.58,18.64,-9999,-9999,-9999 |
File #6: Ji_Parana_Extensive_landcover_soils.csv
No sampling dates were provided for these data.
| Column | Column Heading | Units/format | Description |
|---|---|---|---|
| 1 | Long | decimal degrees | Location of the sampling site in decimal degrees of longitude: negative values indicate west of the Prime Meridian |
| 2 | Lat | decimal degrees | Location of the sampling site in decimal degrees of latitude negative values indicate south of the Equator |
| 3 | Site_Name | Sampling site name or description | |
| 4 | Site_Code | Sampling site location code | |
| 5 | Pasture | % | Percent of river basin area in pasture |
| 6 | Forest | % | Percent of river basin area in forest |
| 7 | Urbanization | % | Percent of river basin area in urban land cover |
| 8 | Other | % | Percent of river basin area in land cover other than pasture forest or urban |
| 8 | Slope | degrees | Average slope for the basin. Data were derived from the SIGTERON data set (Cochrane and Cochrane, 1998) |
| 10 | ECEC | cMol kg-1 | Effective cation exchange capacity of the soils in the catchment area. (calculated as the sum of Ca2+, Mg2+, Na+, K+, H+, and Al3+) reported in centimoles of charge per kg of soil. Data were derived from the SIGTERON data set (Cochrane and Cochrane, 1998) |
Sample data from File #6:
| Long,Lat,Site_Name,Site_Code,Pasture,Forest,Urbanization,Other,Slope,ECEC -60.1906,-12.7333,Comemoracao 1,COM-1,12,46,0.2,53.9,1.68,1.35 -60.2618,-12.6104,Second Station on Comemoracao,C-2,7.9,63.6,4.7,35.7,1.69,1.21 ... -61.7145,-11.9054,Bamburro Stream at Santa Luzia,R-2,80.7,19.3,0,80.7,1.99,6.16 -61.7784,-11.7603,Anta Atirada Stream before the city of Rolim de Moura,R-4,69.3,27.9,0,72.1,2.41,5.18 ... -62.8316,-10.8135,Jaru River at Tarilandia,JA-4,21.7,78.3,0,21.7,3.45,3.04 -62.6102,-11.0821,Urupa River at Mirante da Serra,U-4,17.3,72.3,0,24.8,3.92,3 |
ShapeFile Descriptions
There are five shapefiles provided as compressed files (.zip). When unzipped, files 7, 8, 9, and 11 contain six files (*.shx, *.dbf, *.prj, *.sbn,*.sbx, and *.shp). File # 10 also contains an xml (.xml) file, for a total of seven files. The shapefile parameters and attributes are described below.
File #7: ext_sampling_sites.zip:This file depicts the sampling site locations.
Parameters:
Geometry Type: Point
Projected Coordinate System: WGS_1984_UTM_Zone_20S
Geographic Coordinate
System: GCS_WGS_1984
Datum: D_WGS_1984
Prime Meridian: Greenwich
Angular Unit: Degree
Projection:
Transverse Mercator
Scale Factor: 0.99960000
Latitude of Origin: 0.00000000
False_Easting:
500000.00000000
False_Northing: 10000000.00000000
Central_Meridian: -63.00000000
Linear_Unit:
Meter
Attributes
FID: Internal feature number; sequential unique whole numbers that are automatically generated
Shape:
Feature geometry
PONTOS_ID: Number generated by data provider; no reference found
File #8: ext_sub-basins.zip: This shapefile depicts a smaller subset of the main study drainage basins.
Parameters:
Geometry Type: Polygon
Projected Coordinate System: WGS_1984_UTM_Zone_20S
Geographic Coordinate
System: GCS_WGS_1984
Datum: D_WGS_1984
Prime Meridian: Greenwich
Angular Unit: Degree
Projection:
Transverse Mercator
Scale Factor: 0.99960000
Latitude of Origin: 0.00000000
False_Easting:
500000.00000000
False_Northing: 10000000.00000000
Central_Meridian: -63.00000000
Linear_Unit:
Meter
Attributes:
FID: Internal feature number; sequential unique whole numbers that are automatically generated
Shape:
Feature geometry
AREA: Area of polygon in square meters
PERIMETER: Perimeter of polygon in
meters
GRID_CODE: Number generated by data provider; no reference found
RIO: River drainage
basin
ID: Data collection station ID
File #9: int_sitesI.zip: This shapefile depicts the locations of data collection stations.
Parameters:
Geometry Type: Point
Projected Coordinate System: WGS_1984_UTM_Zone_20S
Geographic Coordinate
System: GCS_WGS_1984
Datum: D_WGS_1984
Prime Meridian: Greenwich
Angular Unit: Degree
Projection:
Transverse Mercator
Scale Factor: 0.99960000
Latitude of Origin: 0.00000000
False_Easting:
500000.00000000
False_Northing: 10000000.00000000
Central_Meridian: -63.00000000
Linear_Unit:
Meter
Attributes:
FID: Internal feature number; sequential unique whole numbers that are automatically generated
Shape:
Feature geometry
AREA: Possibly an extraneous field since this is a point shapefile. All values are
zero.
PERIMETER: Possibly an extraneous field since this is a point shapefile. All values are zero.
PONTOS_:
Number generated by data provider; no reference found
PONTOS_ID: Number generated by data provider; no
reference found
STATIONS_: Number generated by data provider; no reference found
NOME: Data
collection station ID
File #10: int_sub_basinsI.zip: This shapefile depicts the area of the drainage basins. Note- when unzipped, this file also contains a .xml file.
Parameters:
Geometry Type: Polygon
Projected Coordinate System: WGS_1984_UTM_Zone_20S
Geographic Coordinate
System: GCS_WGS_1984
Datum: D_WGS_1984
Prime Meridian: Greenwich
Angular Unit: Degree
Projection:
Transverse Mercator
Scale Factor: 0.99960000
Latitude of Origin: 0.00000000
False_Easting:
500000.00000000
False_Northing: 10000000.00000000
Central_Meridian: -63.00000000
Linear_Unit:
Meter
Attributes:
FID: Internal feature number; sequential unique whole numbers that are automatically generated
Shape:
Feature geometry
AREA: Area of polygon in square meters
PERIMETER: Perimeter of polygon in
meters
ID: Data collection station ID
River: River drainage basin
File #11: urupa_basin.zip:This shapefile depicts the area of the Urupa drainage basin.
Parameters:
Geometry Type: Polygon
Projected Coordinate System: WGS_1984_UTM_Zone_20S
Geographic Coordinate
System: GCS_WGS_1984
Datum: D_WGS_1984
Prime Meridian: Greenwich
Angular Unit: Degree
Projection:
Transverse Mercator
Scale Factor: 0.99960000
Latitude of Origin: 0.00000000
False_Easting:
500000.00000000
False_Northing: 10000000.00000000
Central_Meridian: -63.00000000
Linear_Unit:
Meter
Attributes:
FID: Internal feature number; sequential unique whole numbers that are automatically generated
Shape:
Feature geometry
AREA: Area of polygon in square meters
PERIMETER: Perimeter of polygon in
meters
GRID_CODE: Number generated by data provider; no reference found
RIO: River drainage
basin
ID: Data collection station ID
Site boundaries: (All latitude and longitude given in decimal degrees)
| Site (Region) | Westernmost Longitude | Easternmost Longitude | Northernmost Latitude | Southernmost Latitude | Geodetic Datum |
|---|---|---|---|---|---|
| Rondonia - Rio Ji-Parana (Rondonia) | -63.41528 | -60.015 | -8.03333 | -12.92694 | World Geodetic System, 1984 (WGS-84) |
Time period:
- The data set covers the period 1999/05/24 to 2003/05/20.
- Temporal Resolution: Monthly (Ji Parana intensive sampling), weekly ( Urupa intensive sampling) and two seasonal campaigns (one dry season, one wet season for the Ji Parana extensive sampling)
Platform/Sensor/Parameters measured include:
- FIELD INVESTIGATION / FIELD SURVEY / SURFACE WATER CHEMISTRY
- DEM (DIGITAL ELEVATION MODEL) / ANALYSIS / WATERSHED CHARACTERISTICS
3. Data Application and Derivation:
These data are useful for river biogeochemical characterization and modeling.
4. Quality Assessment:
All data sets were checked for inconsistencies. During analyses in the laboratory standard QA/QC protocols were followed with blanks and known standards run regularly to ensure the accuracy and precision of the results.
Overall land-use/land cover classification accuracy was 89.12%, with an overall Kappa Statistic of 0.8667. These values were above the minimum limits for acceptance described in the literature (Ballester et al., 2001).
5. Data Acquisition Materials and Methods:
Site description
The Ji-Parana Basin, with a drainage area of 75,000 km2, is located in Rondonia state in the southwestern Amazon Basin. The headwaters of the Ji-Parana River are formed by the confluence of the Comemoracao and Pimenta Bueno rivers. The Ji-Parana River channel has a total length of 972 km and varies in width from 150 to 500 m, whereas the channel widths of the major tributaries range from 30 to 200 m. The high and low water periods for these rivers range from December to May, and from June to November, respectively. Oxisols and Ultisols are the predominant soil types in the basin, encompassing 47% and 24% of the total drainage area, respectively. Entisols cover 14%, Alfisols 13% and Eptisols 2% of the basin.
The basin was divided into 14 drainage units according to the river network morphology and degree of land-use impact. Four categories of land use impact were determined as a function of the percentage of pasture coverage: low (0 to 15 percent); medium (15 to 30 percent); high (30 to 50 percent) and very high (50 to 75 percent).
Sampling Campaigns
For the intensive sampling campaign, water samples were collected nine times between 1999 and 2001. Samples were collected at five sites along the main channel of the Ji-Parana´ River, at the mouths of six major tributaries, and at three headwater sites, for a total of 14 sampling stations. See Figure 1.
A more spatially extensive sampling of riverwater with the same chemistry measurements was done once in the dry season and once in the wet season at a larger set of sampling points (38 and 33 sites, respectively) within the Ji Parana Basin.
Weekly collections of river water between Nov 2001 and May 2003 were done at six stations on the Urupa River for the same basic chemistry measurements.
Methods
At each site, 50-100 L of water were collected from the river in the middle of the channel at 60 percent of the total depth using an electric pump. Water samples were taken from the middle of the river channel with a Niskin bottle. Aliquots of sample were filtered, stored in polyethylene bottles and preserved with thymol.
Ion concentrations:
Concentration of ions (Ca, Mg, Na, K, Cl and the soluble reactive form of the nutrient phosphate—PO4) were later determined in the laboratory by liquid chromatography, with a Dionex DX500. Electrical conductivity was measured in the field with an Amber Science portable meter, model 1481-61, and pH with Orion 250 A meter (Ballester et al., 2003).
Organic matter analyses:
At each site, 50–100 L of water were collected from the river in the middle of the channel at 60% of the total depth using an electric pump. The water sample was sieved (greater than 63 um) in order to separate the coarse suspended solid (CSS) fraction, which was immediately preserved with HgCl2, to a final concentration of 100 mM. The fine suspended solid (FSS) fraction (less than 63 um and greater than 0.1 um) and ultrafiltered dissolved organic matter (UDOM) fraction (less than 0.1 um and greater than 1000 daltons) were isolated in the laboratory with a Millipore tangential flow ultrafiltration system (model Pellicon-2; Millipore, Billerica, Massachusetts, USA), using membrane cartridges having a nominal 0.1-mm pore size (model Durapore VVPP; Millipore) and a 1000-daltons molecular weight nominal cut off (model PLAC; Millipore), respectively. After filtration, the material was roto-evaporated and then dried to constant mass in an oven, both at 508 degrees C. The average percentage recovery of organic matter in all samples during ultrafiltration was 98 plus or minus 8 percent, of which an average of 20 plus or minus 6 percent was recovered as UDOM, from both forested and pasture drainage areas (Bernardes et al., 2004).
Determination of Lignin-derived Phenols:
Lignin oxidation, elemental, and isotopic analysis Lignin analyses were made according to the CuO oxidation procedure of Hedges and Ertel (1982) as modified by Goni and Hedges (1990). Briefly, between 30 to 300 mg of dry sample was oxidized at 1558 degrees C for 3 h with CuO under basic (8 percent NaOH) conditions. The reaction solution was spiked with a nine-compound gas chromatography recovery standard mixture (in pyridine), acidified and extracted with diethyl ether. The lignin extract was diluted in pyridine, mixed with regisil plus an absolute recovery standard, and analyzed on a Hewlett Packard 5890 series II gas chromatograph (Agilent Technologies, Palo Alto, California, USA) fitted with a DB-1 fused-silica capillary column (J&W Scientific, Folsom, California, USA). Identities of all phenols were confirmed by mass spectrometry of selected samples vs. commercial standards (Bernardes et al., 2004).
Carbon and Nitrogen Concentrations:
Organic carbon and nitrogen concentrations were determined using a Carlo Erba CHN analyzer (Thermoquest, Rodano, Italy). Isotope measurements were performed with a Finnigan Delta-E mass spectrometer (ThermoFinnigan, Bremen, Germany) fitted with dual inlet and dual collector systems.
Basin characterization:
River sites and basin characteristics were calculated using the data sets compiled as layers in ArcInfo (ESRI, 1997) Geographical Information System (GIS) and ERDASIMAGINE (Image Processing) software. To delineate subbasins boundaries of the sampling sites, a 50-m horizontal and vertical resolution Digital Elevation Model (DEM) and the river network were derived from 1:100,000 maps from the Brazilian Institute of Geography and Statistics (Ballester et al., 2003). Watershed boundaries were delineated using ArcInfo,GIS hydrological modeling tools. First, a depressionless DEM was produced by identifying and filling all sinks. Then, flow direction and accumulation were derived from this DEM, using the approach developed by Jenson and Domingues (1988). Finally, watersheds were delineated, assuming a minimum contributing area of 50 cells above a set of cells in a grid, or as the total area flowing to a given outlet (each sampling point in this case). The zonal statistic function of ArcInfo was used to calculate average values of ECEC and slope in the areas drained by each of the 14 river sectors.
6. Data Access:
This data is available through the Oak Ridge National Laboratory (ORNL) Distributed Active Archive Center (DAAC).
Data Archive Center:
Contact for Data Center Access Information:
E-mail: uso@daac.ornl.gov
Telephone: +1 (865) 241-3952
7. References:
Ballester, M.V.R., D.D. Victoria, A.V. Krusche, R. Coburn, R.L. Victoria, J.E. Richey, M.G. Logsdon, E. Mayorga, and E. Matricardi. 2003. A remote sensing/GIS-based physical template to understand the biogeochemistry of the Ji-Parana river basin (Western Amazonia). Remote Sensing of Environment 87(4):429-445.
Bernardes, M.C., L.A. Martinelli, A.V. Krusche, J. Gudeman, M. Moreira, R.L. Victoria, J.P.H.B. Ometto, M.V.R. Ballester, A.K. Aufdenkampe, J.E. Richey, and J.I. Hedges. 2004. Riverine organic matter composition as a function of land use changes, Southwest Amazon. Ecological Applications 14(4):S263.
Cochrane, T. T., and Cochrane, T. A. (1998). SIGTERON, Sistema de Informacao Geografica para os terrenos e solos do Estado de Rondoˆnia, Brasil. (Geographic Information System for terrains and soils of Rondonia State, Brazil). Porto Velho, Rondonia: Tecnosolo/DHV Consultants, Portuguese.
ESRI (1997). Arc-Info version 7.3. Redlands, CA, USA: Environmental Systems Research Institute.
Gon i, M. A., and J. I. Hedges. 1990. Cutin-derived CuO reaction products from purified cuticles and tree leaves. Geochimica et Cosmochimica Acta 54:3065–3072.
Hedges, J. I., and J. R. Ertel. 1982. Characterization of lignin by capillary gas chromatography of cupric oxide oxidation products. Analytical Chemistry 54:174–178.
Jenson, S. K., and Domingues, J. O. (1988, November). Extracting topographic structure from digital elevation data for geographic information system analysis. Photogrammetric Engineering and Remote Sensing, 54(11), 1593– 1600.
Victoria, R. L., Richey, J. E., Bernardes, M., Ballester, M. V. R., Gomes, B. M., Krusche, A. V., and Mayorga, E. (2000). Effects of land use changes in the biogeochemistry of Ji-Parana river, a meso-scale river in the state of Rondonia, southern Amazon. Proceedings of the LBA Experiment in Amazonia First Scientific Conference, Belem, Para-Brazil, June 25-28.
Related Publications
- Aufdenkampe, A.K., J.I. Hedges, J.E. Richey, A.V. Krusche, and C.A. Llerena. 2001. Sorptive fractionation of dissolved organic nitrogen and amino acids onto fine sediments within the Amazon Basin. Limnology and Oceanography 46(8):1921-1935.
- Krusche, A.V., M.V.R. Ballester, R.L. Victoria, et al. 2005. Effects of land use changes in the biogeochemistry of fluvial systems of the Ji-Parana River Basin, Rondonia. Acta Amazonica 35(2):197-205.
- Richey, J.E., A.V. Krusche, L.A. Deegan, V.M. Ballester, T.W. Biggs, and R. Victoria. 2001. Land use changes and the biogeochemistry of river corridors in the Amazon. Global Change Newsletter 45:19-22.