Get Data
Summary:
This data set reports soil moisture expressed as volumetric water content (VWC), daily precipitation, air temperature, relative humidity, and dew point measurements conducted at the Seca Floresta site, km 67, Tapajos National Forest, Brazil. The measurements were part of the Rainfall Exclusion Experiment (REE) established to study the response of a humid Amazonian forest to severe drought.
- VWC was measured with continuous high-resolution frequency-domain reflectometry to 11-m depth in two 1-ha plots from 1999 to 2007. One plot was subjected to ~75 percent throughfall exclusion during the rainy season (exclusion) and another monitored under normal conditions (control).
- Daily precipitation was measured in the control plot and in a nearby clearing between 1999 and 2006 using wedge rain gauges.
- Air temperature, relative humidity, and dew point were measured along the vertical forest profile of the control and dry plots of the site between 2000 and 2003.
There are three comma-delimited data files (.csv) with this data set.
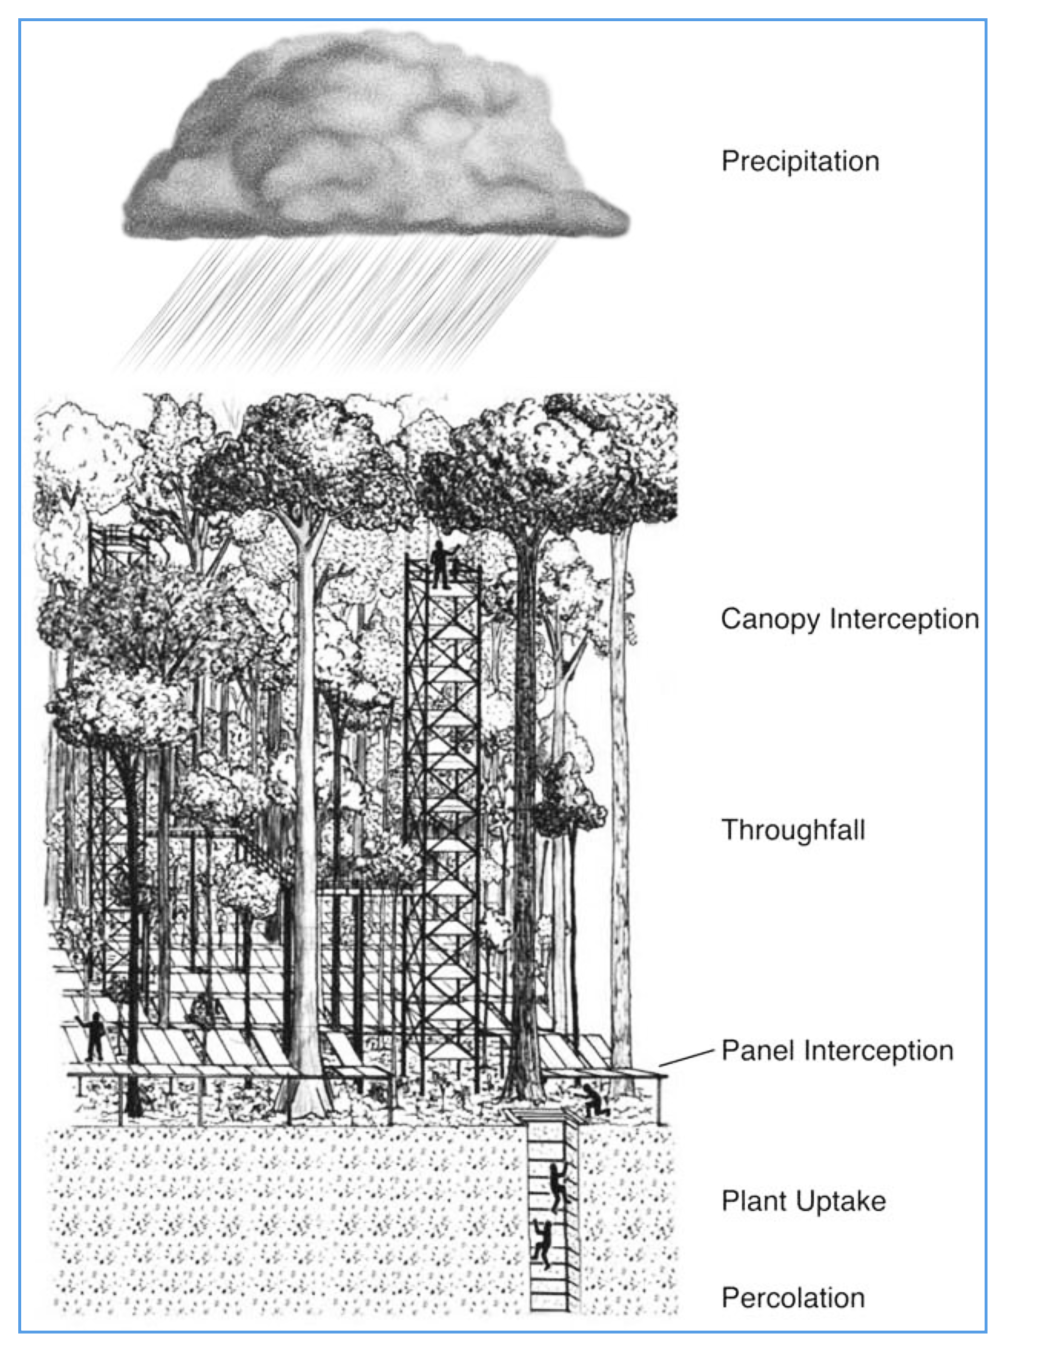
Figure 1. Illustration of the Rainfall Exclusion Experiment (REE), Tapajo´s National Forest (Nepstad et al., 2002).
Data Citation:
Cite this data set as follows:
Nepstad, D.C., P.R. Moutinho, and P. Brando. 2013. LBA-ECO CD-05 Soil VWC and Meteorology, Rainfall Exclusion, Tapajos National Forest. Data set. Available on-line [http://daac.ornl.gov] from Oak Ridge National Laboratory Distributed Active Archive Center, Oak Ridge, Tennessee, USA http://dx.doi.org/10.3334/ORNLDAAC/1169
Implementation of the LBA Data and Publication Policy by Data Users:
The LBA Data and Publication Policy [http://daac.ornl.gov/LBA/lba_data_policy.html] is in effect for a period of five (5) years from the date of archiving and should be followed by data users who have obtained LBA data sets from the ORNL DAAC. Users who download LBA data in the five years after data have been archived must contact the investigators who collected the data, per provisions 6 and 7 in the Policy.
This data set was archived in June 2013. Users who download the data between June 2013 and May 2018 must comply with the LBA Data and Publication Policy.
Data users should use the Investigator contact information in this document to communicate with the data provider.
Data users should use the Data Set Citation and other applicable references provided in this document to acknowledge use of the data.
Table of Contents:
- 1 Data Set Overview
- 2 Data Characteristics
- 3 Applications and Derivation
- 4 Quality Assessment
- 5 Acquisition Materials and Methods
- 6 Data Access
- 7 References
1. Data Set Overview:
Project: LBA (Large-Scale Biosphere-Atmosphere Experiment in the Amazon)
Activity: LBA-ECO
LBA Science Component: Land Use and Land Cover
Team ID: CD-05 (Nepstad / Miranda)
The investigators were Nepstad, Daniel Curtis; Miranda, Heloisa S.; Andrade, Sergio Viana de ; Arce, Javier Alberto; Asner, Gregory Paul; Bamberger, Barbara; Belk, Elizabeth Leslie; Bishop, Joshua Thomas; Breyer, Lace Medeiros; Cardinot, Gina Knust; Carvalho Jr., Oswaldo de; Chermont, Larissa Steiner; Dias-Filho, Moacyr Bernardino; Diaz, Maria del Carmen Vera; Figueiredo, Ricardo de Oliveira; Guerrero, Jose Benito; Holbrook, Noel Michele; Kingerlee, Wendy; Klink, Carlos Augusto; Lefebvre, Paul A.; Maklouf, Eduardo Jorge; Markewitz, Daniel; Merry, Frank David; Miranda, Antonio C.; Monaco, Luciana Magalhaes; Morton, Douglas C.; Moutinho, Paulo Roberto de Souza; Oliveira, Rafael Silva; Peters, Charles Merideth; Pinto, Flavia dos Santos; Quesada, Carlos Alberto Nobre; Ray, David G.; Rivero, Sergio; Santos, Alexandre J.B.; Schwalbe, Karen R.; Silva, Dulce Alves da; Solorzano, Luis Anibal Cardenas and Silva, Wanderley Rocha da. You may contact Nepstad, Daniel Curtis (dnepstad@whrc.org); Moutinho, Paulo Roberto de Souza (moutinho@amazon.com.br); Ray, David G. (dray@whrc.org) and Lefebvre, Paul A. (paul@whrc.org).
LBA Data Set Inventory ID: CD05_Micromet
This data set reports soil moisture expressed by volumetric water content (VWC), daily precipitation, air temperature, relative humidity, and dew point measurements conducted at the Seca Floresta site, km 67, Tapajos National Forest, Brazil. The measurements were part of the Rainfall Exclusion Experiment (REE) established to study the response of a humid Amazonian forest to severe drought.
- VWC was measured with continuous high-resolution frequency-domain reflectometry to 11-m depth in two 1-ha plots from 1999 to 2007. One plot was subjected to ~75 percent throughfall exclusion during the rainy season (exclusion) and another monitored under normal conditions (control).
- Daily precipitation was measured in the control plot and in a nearby clearing between 1999 and 2006 using wedge rain gauges.
- Air temperature, relative humidity, and dew point were measured along the vertical forest profile of the control and dry plots of the site between 2000 and 2003.
Related Data Sets:
LBA-ECO ND-02 Soil Volumetric Water Content, Tapajos National Forest, Brazil (Soil VWC measurements from the same site)
LBA-ECO ND-30 Water Chemistry, Rainfall Exclusion, km 67, Tapajos National Forest (Chemical composition of rainfall, throughfall and soil solutions from the same site)
LBA-ECO ND-02 Soil Gas and Water Content, Rainfall Exclusion, Tapajos National Forest (Soil measurements from the same site)
2. Data Characteristics:
Data are provided in three comma-delimited ASCII files:
File #1: VWC_REE_plots_1999_2007.csv
File #2: Rainfall_REE_plots_1999_2006.csv
File #3: Temp_RH_REE_plots_2000_2003.csv
File organization is as follows:
File 1: VWC_REE_plots_1999_2007.csv. Samples were collected from May 17, 1999 through April 20, 2007.
| Column | Heading | Units/format | Description |
|---|---|---|---|
| 1 | Treatment | Plot identification: control or exclusion | |
| 2 | Date | YYYYMMDD | Sampling date |
| 3 | Pit | Pit identification: 1-10 | |
| 4 | Side | Location of the sensor in the pit, either the right (R) or left (L) wall | |
| 5 | Depth | cm | Depth in the soil at which the sensor is located reported in centimeters below the soil surface |
| 6 | VWC_original | cm3 per cm3 | Volumetric water content (VWC) reported in centimeters cubed (cm3) of water per centimeter cubed (cm3) of soil |
| 7 | VWC_reprocessed | cm3 per cm3 | VWC reprocessed reported in centimeters cubed (cm3) of water per centimeter cubed (cm3) of soil; where original values were determined to be unreliable, the reprocessed value is -9999 |
| 8 | Reprocessed | Flag to indicate that the original VWC value was reprocessed: 1 indicates reprocessing was necessary, 0 indicates original values are considered valid, and -9999 indicates there were no original values to consider | |
| missing data are indicated by -9999 | |||
Example data records:
|
Treatment,Date,Pit,Side,Depth,VWC_original,VWC_reprocessed,Reprocessed Control,19990517,4,L,30,0.3649,0.3649,0 Control,19990608,4,L,30,0.2957,0.2957,0 Control,19990804,4,L,30,0.3369,0.3369,0 ... Exclusion,20010517,1,L,50,-9999,-9999,-9999 Exclusion,20010618,1,L,50,0.3206,0.3206,0 Exclusion,20010719,1,L,50,0.2944,0.2944,0 ... Exclusion,20050623,9,R,1100,0.3932,0.3932,0 Exclusion,20050726,9,R,1100,0.3897,0.3897,0 Exclusion,20050823,9,R,1100,0.3894,0.3894,0 |
File 2: Rainfall_REE_plots_1999_2006.csv. Samples were collected from January 1, 1999, through January 31, 2006.
| Column | Heading | Units/format | Description |
|---|---|---|---|
| 1 | Date | YYYYMMDD | Sampling date (YYYYMMDD) |
| 2 | Ppt_Casa | mm | Rainfall over previous 24 hours measured at the Casa Onca site approximately 1 km from the experimental plots and reported in mm. Collections were not done on weekends, so Monday collections represent 3 days minus some evaporation |
| 3 | Ppt_REE_tower | mm | Rainfall over previous 24 hours measured at tower located in the control plot and reported in mm. Collections were not done on weekends, so Monday collections represent 3 days minus some evaporation |
| 4 | Exclusion | Indicates whether the exclusion panels were in place, with 1 indicating yes and 0 indicating no | |
| missing data are indicated by -9999 | |||
Example data records:
|
Date,Ppt_Casa,Ppt_REE_tower,Exclusion 19990101,0,-9999,0 19990102,-9999,-9999,0 19990103,-9999,-9999,0 ... 20010514, 64, 68, 1 20010515, 9, 9.5, 1 20010516, 12.5, 22, 1 ... 20060129, -9999, -9999, 0 20060130, 0, 0, 0 20060131, 0, 0, 0 |
File 3: Temp_RH_REE_plots_2000_2003.csv. Samples were collected from 2000 through August 2003. Note that there are nearly 515,000 observations in this 30-MB file.
| Column | Heading | Units/format | Description |
|---|---|---|---|
| 1 | Treatment | Plot identification: control or exclusion | |
| 2 | Sensor_code | Sensor identification | |
| 3 | Location | Sensors were located in both gap and closed forest locations | |
| 4 | Height | m | Height of sensor reported in meters above the soil |
| 5 | Date | YYYYMMDD | Sampling date in local time (YYYYMMDD) |
| 6 | Time | HH:MM | Sampling time in local time ( local time is UTC-4) |
| 7 | T_air | degrees C | Air temperature reported in degrees Celsius |
| 8 | T_dewpoint | degrees C | Dewpoint temperature reported in degrees Celsius |
| 9 | RH | percent | Relative humidity reported in percent |
| missing data are indicated by -9999 | |||
Example data records:
|
Treatment,Sensor_code,Location,Height,Date,Time,T_air,T_dewpoint,RH Exclusion,05RHT,Gap,15,20020709,9:33,27.91,26.8,93.7 Exclusion,05RHT,Gap,15,20020709,10:03,28.31,25.5,84.8 Exclusion,05RHT,Gap,15,20020709,10:33,28.7,25.53,83 ... Control, 11RHT, Closed, forest, 1.5, 20030828, 14:00, 27.12, 27.12, 100 Control, 12RHT, Gap, 1.5, 20020709, 10:58, 27.52, 27.52, 100 Control, 12RHT, Gap, 1.5, 20020709, 11:28, 27.9,1 27.91, 100 ... Control, 18RHT, Closed, forest, 25, 20021231, 22:52, 22.86, 22.86, 100 Control, 18RHT, Closed, forest, 25, 20021231, 23:22, 22.48, 22.48, 100 Control, 18RHT, Closed, forest, 25, 20021231, 23:52, 22.48, 22.48, 100 |
Site boundaries: (All latitude and longitude given in decimal degrees)
| Site (Region) | Westernmost Longitude | Easternmost Longitude | Northernmost Latitude | Southernmost Latitude | Geodetic Datum |
|---|---|---|---|---|---|
| Para Western (Santarem) - km 67 Seca-Floresta Site (Para Western (Santarem)) | -55.0000 | -55.0000 | -2.75000 | -2.75000 | World Geodetic System, 1984 (WGS-84) |
Time period:
- The data set covers the period 1999/01/01 to 2007/04/20.
- Temporal Resolution: Daily
Platform/Sensor/Parameters measured include:
- GROUND STATION / HUMIDITY SENSOR / HUMIDITY
- FIELD CAMPAIGN / TIME DOMAIN REFLECTOMETER / SOIL MOISTURE
- GROUND STATION / RAIN GAUGE / RAINFALL
3. Data Application and Derivation:
Assessments of the effects of soil water stress on Amazonian
vegetation:
This topic is of wide interest given that several lines of evidence
suggest that Amazon forests may experience increased drought intensity and
frequency in the future as a result of increased atmospheric CO2 and
deforestation.
Development, parameterization, and validation of dynamic global
vegetation models:
Models have been developed to predict the potential
effects of drought on Amazonian vegetation. However, there is a lack of data sets
that can be used to improve these models.
4. Quality Assessment:
VWC: where original values were determined to be unreliable, the reprocessed value was set to -9999.
Precipitation: measurements noted on Mondays resulted from the accumulated precipitation over the weekend minus evaporation. This bias in our measurements is expected to consistently reduce precipitation estimates.
Relative humidity, dew point, and air temperature: although some extreme unrealistic values were removed from this data set due to problems with the sensors, temperature is still consistently lower than expected during some rainy-season periods.
5. Data Acquisition Materials and Methods:
Site Description
To study the response of a humid Amazonian forest to severe drought, a partial throughfall exclusion study was initiated in 1998 in the Tapajo´s National Forest, east-central Amazonia, near Santarem, Brazil (Nepstad et al., 2002). This forest receives on average approximately 2,000 mm of rainfall per year. The Seca Floresta study plots are situated on an upper landscape plateau where the soils support a dense, humid, evergreen forest (terra firme) that does not flood annually. The canopy at this site is horizontally continuous and approximately 30 m tall. Soils are well-drained, predominantly Haplustox (Latasolos vermelhos), dominated by kaolinite clays.
Experiment Description
This experiment compared two 1-ha plots, one of which received natural rainfall, while the other had plastic panels installed in the forest understory during the rainy season. Throughfall was partially excluded from the treatment plot during the rainy seasons between 2000 and 2004, from late January to early August, using 5,660 panels made of clear, PAR-transmitting greenhouse plastic mounted on wooden frames. The panels were removed during the dry season to reduce their influence on the forest floor through shading and heating. While they were in place, the panels were flipped on their sides every 2 to 3 days to transfer accumulated litter onto the forest floor beneath. Each 3-by-0.5-m panel drained into a plastic-lined, wooden gutter (30 cm wide) that carried the water into the trench, which was also lined with plastic. The gutters served as catwalks for various measurements and panel maintenance. Water flowed by gravity from the perimeter trench into a deeper drainage ditch (1.7 to 2.3-m depth), which extended 220-m away from the plot into a small valley. The panels and gutters covered apporoximately 75 percent of the forest floor, because we left openings around tree stems.
Volumetric soil water content:
VWC (cm3 water per cm3 soil) was monitored to 11-m depth in both the treatment and control plots using Time Domain Reflectrometry (TDR), in which an electromagnetic wave is propagated along three, 30-cm, parallel-stainless steel rods embeddedin the soil to determine the soil average dielectric moment (which is mostly a function of soil water content). The rods of each sensor were embedded at one end in an epoxy resin head. Each sensor was installed at the end of a 1.5-m auger hole drilled horizontally into the wall of the shaft (the rods pushed into the intact soil) to avoid shaft effects on soil moisture; the holes were then back-filled with soil. Each of the shafts had two vertical sensors at the soil surface, and two horizontal sensors, in opposite walls, at 0.5, 1, 2-m, and at 1-m intervals to 11-m depth.
VWC measurements were made using a cable tester (Tektronix 1502C) and the calibration equation developed in a similar Belterra clay formation, in eastern Amazonia. TDR waveforms were recorded and analyzed using the WATTDR program (v3.11, Waterloo Centre of Groundwater Research, 1996). Each waveform was visually inspected for possible errors generated by the WATTDR algorithm.
Precipitation:
Precipitation was monitored using two wedge rain gauges from 1999 to 2006. One rain gauge was located in the control plot of the Seca Floresta experiment on top of 35-m wooden tower, where no trees could obstruct rainfall collection. The other gauge was located in a clearing at a distance of approximately 1 km from the experimental area. Measurements on Mondays reflected the accumulated precipitation over the weekend minus evaporation.
Micrometeorological measurements:
To evaluate the effects of drought-induced changes on microclimatic conditions, 17 sensors (Hobo Pro RH Temp Data Logger; Onset Computer Corp., Bourne, MA 02532, USA) were installed in the dry (N=8) and control (N=9) plots. These sensors, at different time intervals, measured relative humidity (percent), air temperature (degrees C), and dew-point temperature (degrees C). The sensors were distributed across the experimental plots to measure microclimate conditions in two types of environments: a gap and dense forest. These sensors were also distributed to capture the vertical variability of microclimatic conditions.
In the control, sensors were installed at 1.5-m, 15-m and 25-m along the vertical profile of the forest, while in the dry plot the sensors were installed at 2-m, 15-m, and 25-m. To avoid the effects of direct radiation on the measurements, the sensors were protected by a PVC cover.
6. Data Access:
This data is available through the Oak Ridge National Laboratory (ORNL) Distributed Active Archive Center (DAAC).
Data Archive Center:
Contact for Data Center Access Information:
E-mail: uso@daac.ornl.gov
Telephone: +1 (865) 241-3952
7. References:
Silver, W. L., et al., (2000). Effects of soil texture on belowground carbon and nutrient storage in a lowland Amazonian forest ecosystem, Ecosystems, 3, 193-209. doi:10.1007/s100210000019
Nepstad,D.C., P. Moutinho, M. B. Dias-Filho, E. Davidson, G. Cardinot, D. Markewitz, R. Figueiredo, N. Vianna, J. Chambers, D. Ray, J. B. Guerreiros, P. Lefebvre, L. Sternberg, M. Moreira, L. Barros, F. Y. Ishida, I. Tohlver, E. Belk, K. Kalif, K. Schwalbe. 2002. The effects of partial throughfall exclusion on canopy processes, aboveground production, and biogeochemistry of an Amazon forest. Journal of Geophysical Research 107:8085
Related Publications
- Markewitz, D., S. Devine, E. A. Davidson, P. Brando, and D. C. Nepstad. 2010. Soil moisture depletion under simulated drought in the Amazon: impacts on deep root uptake. New Phytologist 187:592-607.
- Brando, P. M., S. J. Goetz, A. Baccini, D.C. Nepstad, P. S. A. Beck, and M. C. Christman. 2010. Seasonal and interannual variability of climate and vegetation indices across the Amazon. Proceedings of the National Academy of Sciences of the United States of America 107:14685-14690
- Brando, P. M., D. C. Nepstad, E. A. Davidson, S. E. Trumbore, D. Ray, and P. Camargo. 2008. Drought effects on litterfall, wood production and belowground carbon cycling in an Amazon forest: results of a throughfall reduction experiment. Philosophical Transactions of the Royal Society of London. Series B, Biological sciences 363:1839-1848.
- Davidson, E., P. A. Lefebvre, P. M. Brando, D. M. Ray, S. E. Trumbore, L. A. Solorzano, J. N. Ferreira, M. M. C. Bustamante, and D. C. Nepstad. 2011. Carbon inputs and water uptake in deep soils of an eastern Amazon forest. Forest Science 57:51-58.