Get Data
Summary:
This data set reports 30-minute values for above-canopy meteorology and fluxes of momentum, heat, and carbon dioxide, and within-canopy carbon dioxide and water vapor concentrations collected at 12 collected at 12 levels between 10 cm and 64 m at the tower located within a logging gap at the km 83 Tower Site in the Tapajos National Forest, Para, Brazil. Data were collected over 1.5 years between June 3, 2002 and January 30, 2004. All of the data are contained in one comma separated file.
Two towers are located at the km 83 site. The first tower was installed in an intact forest area at this site in June 2000 (the 'intact' tower). In September 2001, the area adjacent to the tower was selectively logged (Bruno et al., 2006). The second tower (the ‘gap’ tower) was installed and operating in June 2002, 400 m east of the intact tower. The gap tower was installed in the middle of a 50 m x 50 m log landing.
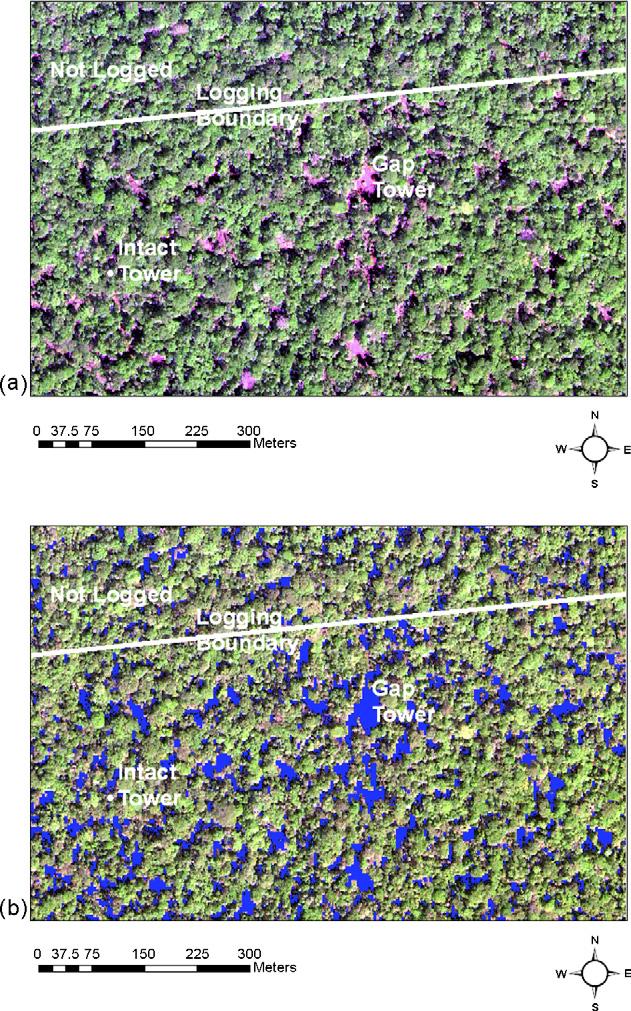
Figure 1. (a) False
color IKONOS image for November
14, 2001 at 14:15 Universal Time showing the locations of the intact
forest tower, the logging gap tower, and the approximate
boundary between selectively
logged areas to the south and unlogged forest to the
north. Red corresponds to the
IKONOS red band; Green is the near IR band; Blue is the blue band.
Vegetation shows up as green due to the reflectance of foliage in the
near IR; bare soil, litter and slash showup as pink, shadows are dark.
The sun was to the southeast during the image (Sun Azimuth: 133.48, Sun
Elevation: 67.28), and the northwestern sides of gaps are mostly pink
(illuminated soil) and the southeastern sides of gaps are mostly dark
(shadow); (b) Same as (a), except gaps, which were identified as areas with a
Normalized Difference Vegetation Index (NDVI) of less than 0.4 are shown as
blue. From Miller et al., 2007.
Data Citation:
Cite this data set as follows:
Miller, S.D., M.L. Goulden, H.R. da Rocha. 2010. LBA-ECO CD-04 CO2 and Heat Flux, km 83 Gap Tower Site, Tapajos National Forest. Data set. Available on-line [http://daac.ornl.gov] from Oak Ridge National Laboratory Distributed Active Archive Center, Oak Ridge, Tennessee, U.S.A. doi:10.3334/ORNLDAAC/978
Implementation of the LBA Data and Publication Policy by Data Users:
The LBA Data and Publication Policy [http://daac.ornl.gov/LBA/lba_data_policy.html] is in effect for a period of five (5) years from the date of archiving and should be followed by data users who have obtained LBA data sets from the ORNL DAAC. Users who download LBA data in the five years after data have been archived must contact the investigators who collected the data, per provisions 6 and 7 in the Policy.
This data set was archived in July of 2010. Users who download the data between July 2010 and June 2015 must comply with the LBA Data and Publication Policy.
Data users should use the Investigator contact information in this document to communicate with the data provider. Alternatively, the LBA Web Site [http://lbaeco-archive.ornl.gov/] in Brazil will have current contact information.
Data users should use the Data Set Citation and other applicable references provided in this document to acknowledge use of the data.
Table of Contents:
- 1 Data Set Overview
- 2 Data Characteristics
- 3 Applications and Derivation
- 4 Quality Assessment
- 5 Acquisition Materials and Methods
- 6 Data Access
- 7 References
1. Data Set Overview:
Project: LBA (Large-Scale Biosphere-Atmosphere Experiment in the Amazon)
Activity: LBA-ECO
LBA Science Component: Carbon Dynamics
Team ID: CD-04 (Goulden / Rocha)
The investigators were Goulden, Dr. Michael L.; Menton, Mary Catherine; Miller, Dr. Scott D.; Rocha, Prof. Humberto Ribeiro da; Freitas, Helber Custodio de; Pinto, Leandro D.V.O.; Figuera, Michela; Sousa, Cleilim Albert Dias de; Doughty, Chris and Read, Edward L.. You may contact Miller, Dr. Scott D. (smiller@albany.edu) and Goulden, Dr. Michael L. (mgoulden@uci.edu) .
LBA Data Set Inventory ID: CD04_Tower_Flux_Gap
Mean 30-minute values are reported for above-canopy meteorology and fluxes (momentum, heat, carbon dioxide), and within canopy, carbon dioxide and water vapor values are reported at 12 levels between 10 cm and 64 m at the tower located within a logging gap at km 83 in the Tapajos National Forest, Para, Brazil. Data were collected over 1.5 years between June 3, 2002 and January 30, 2004. Data have been reviewed and no further modifications are anticipated.
Related Data Sets
- LBA-ECO CD-04 CO2 Profiles, km 83 Tower Site, Tapajos National Forest (Carbon dioxide profile measurements from a nearby 65 m tower at the intact forest site with an overlapping time period)
- LBA-ECO CD-04 Meteorological and Flux Data, km 83 Tower Site, Tapajos National Forest (Carbon dioxide flux data from the nearby 65 m tower at the intact forest site with an overlapping time period)
2. Data Characteristics:
Data were collected at the tower located within a logging gap within the Tapajos
National Forest, 83 km south of the city of Santarem, Para. Data are
presented in one comma-delimited ASCII file. There are 44 columns of ASCII data
values representing measured or
calculated quantities.
This file contains a total of 29,193 records (rows) including:
- a header section (rows 1-51)
- column headings (row 52)
- data (rows 53-29,188), each corresponding to a 30-minute interval
beginning June 3, 2002 and ending January 30, 2004
- missing data are represented by -999.
Filename: CD04_gap_tower_met_CO2_fluxes.csv
| Column number | Column heading | Units/Format | Sensor | Variable description |
|---|---|---|---|---|
| 1 | Experiment_day | Decimal day | "Day the measurements were taken (0 = January 1 2000 00:00 hours)" | |
| 2 | Date | yyyy-mm-dd | Measurement date (yyyy-mm-dd) | |
| 3 | Year | yyyy | Year the measurements were taken (2002 or 2003) | |
| 4 | Month | mm | Month the measurements were taken (1-12) | |
| 5 | Day | dd | Day of the month the measurements were taken (1 - 31) | |
| 6 | Hour | hh | Hour (0-23) at the start of each sampling period as GMT (note local time is GMT -4) | |
| 7 | Minute | mm | "Minute at the start of each sampling period (0, 29, 30, or 50) | |
| 8 | Air_temp_64m | degrees C | Campbell CSAT3 | Sonic air temperature at 64 m height in degrees Celsius |
| 9 | Press_64m | kPa | Campbell CSAT3 | Air pressure at 64 m height measured in kiloPascals (kPa) |
| 10 | H2O_64m | mmol/mol | LI-COR LI7500 | Concentration of water vapor in the air measured in millimoles of water per mol of air at 64 m height using an open path LI-COR 7500 |
| 11 | Wind_speed_64m | m/s | Campbell CSAT3 | Wind speed measured in meters per second (m/s) with a sonic anemometer 64 m height |
| 12 | Wind_dir_64m | degrees | Campbell CSAT3 | Wind direction measured in degrees (meteorological convention) with a sonic anemometer at 64 m height |
| 13 | CO2_64m | ppm | LI-COR LI7500 | Concentration of carbon dioxide in the atmosphere measured in parts per million (ppm) at 64 m height using an open path LI-COR 7500 |
| 14 | CO2_10cm | ppm | LI-COR LI800 | Concentration of carbon dioxide in the atmosphere measured in parts per million (ppm) at 0.1 m height |
| 15 | CO2_35cm | ppm | LI-COR LI800 | Concentration of carbon dioxide in the atmosphere measured in parts per million (ppm) at 0.35 m height |
| 16 | CO2_70cm | ppm | LI-COR LI800 | Concentration of carbon dioxide in the atmosphere measured in parts per million (ppm) at 0.70 m height |
| 17 | CO2_1_4m | ppm | LI-COR LI800 | Concentration of carbon dioxide in the atmosphere measured in parts per million (ppm) at 1.40 m height |
| 18 | CO2_3m | ppm | LI-COR LI800 | Concentration of carbon dioxide in the atmosphere measured in parts per million (ppm) at 3.0 m height |
| 19 | CO2_6m | ppm | LI-COR LI800 | Concentration of carbon dioxide in the atmosphere measured in parts per million (ppm) at 6.0 m height |
| 20 | CO2_10_7m | ppm | LI-COR LI800 | Concentration of carbon dioxide in the atmosphere measured in parts per million (ppm) at 10.70 m height |
| 21 | CO2_20m | ppm | LI-COR LI800 | Concentration of carbon dioxide in the atmosphere measured in parts per million (ppm) at 20.00 m height |
| 22 | CO2_35m | ppm | LI-COR LI800 | Concentration of carbon dioxide in the atmosphere measured in parts per million (ppm) at 35.00 m height |
| 23 | CO2_40m | ppm | LI-COR LI800 | Concentration of carbon dioxide in the atmosphere measured in parts per million (ppm) at 40.00 m height |
| 24 | CO2_50m | ppm | LI-COR LI800 | Concentration of carbon dioxide in the atmosphere measured in parts per million (ppm) at 50.00 m height |
| 25 | CO2_64m | ppm | LI-COR LI800 | Concentration of carbon dioxide in the atmosphere measured in parts per million (ppm) at 64.00 m height |
| 26 | H2O_10cm | mmol/mol | LI-COR LI800 | Concentration of water vapor in the atmosphere measured in millimoles water per mole air (mmol/mol) at 0.10 m height |
| 27 | H2O_35cm | mmol/mol | LI-COR LI800 | Concentration of water vapor in the atmosphere measured in millimoles water per mole air (mmol/mol) at 0.35 m height |
| 28 | H2O_70cm | mmol/mol | LI-COR LI800 | Concentration of water vapor in the atmosphere measured in millimoles water per mole air (mmol/mol) at 0.70 m height |
| 29 | H2O_1_4m | mmol/mol | LI-COR LI800 | Concentration of water vapor in the atmosphere measured in millimoles water per mole air (mmol/mol) at 1.40 m height |
| 30 | H2O_3m | mmol/mol | LI-COR LI800 | Concentration of water vapor in the atmosphere measured in millimoles water per mole air (mmol/mol) at 3.00 m height |
| 31 | H2O_6m | mmol/mol | LI-COR LI800 | Concentration of water vapor in the atmosphere measured in millimoles water per mole air (mmol/mol) at6.00 m height |
| 32 | H2O_10_7m | mmol/mol | LI-COR LI800 | Concentration of water vapor in the atmosphere measured in millimoles water per mole air (mmol/mol) at 10.70 m height |
| 33 | H2O_20m | mmol/mol | LI-COR LI800 | Concentration of water vapor in the atmosphere measured in millimoles water per mole air (mmol/mol) at 20.00 m height |
| 34 | H2O_35m | mmol/mol | LI-COR LI800 | Concentration of water vapor in the atmosphere measured in millimoles water per mole air (mmol/mol) at 35.00 m height |
| 35 | H2O_40m | mmol/mol | LI-COR LI800 | Concentration of water vapor in the atmosphere measured in millimoles water per mole air (mmol/mol) at 40.00 m height |
| 36 | H2O_50m | mmol/mol | LI-COR LI800 | Concentration of water vapor in the atmosphere measured in millimoles water per mole air (mmol/mol) at 50.00 m height |
| 37 | H2O_64m | mmol/mol | LI-COR LI800 | Concentration of water vapor in the atmosphere measured in millimoles water per mole air (mmol/mol) at 64.00 m height |
| 38 | Friction_velocity_64m | m/s | Campbell CSAT3 | Friction velocity (u_star) in meters per second (m/s) measured at 64 m height in meters per second |
| 39 | Sensible_heat_flux_64m | W/m2 | Sensible heat flux measured in Watts per meter squared (W/m2) at 64 m height | |
| 40 | Latent_heat_flux_64m | W/m2 | Latent heat flux measured in Watts per meter squared (W/m2) at 64 m height | |
| 41 | CO2_flux_64m | umol/m2/s | Net flux of carbon dioxide in micromoles of carbon dioxide per meter squared per second (umol/m2/s) at 64 m height. Positive values represent flux upward and negative values represent a downward flux | |
| 42 | CO2_storage_64m | umol/m2/s | Calculated storage of carbon dioxide below 64 m in micro moles of CO2 per meter squared per second (umol/m2/s) | |
| 43 | NEE_raw | umol/m2/s | Net ecosystem exchange calculated based on CO2 measurements with no correction during periods of low friction velocity in micromoles of CO2 per meter squared per second (umol/m2/s) | |
| 44 | NEE_corr | umol/m2/s | Net ecosystem exchange calculated based on CO2 measurements with friction velocity (u_star) corrected with 0.22 m/s cutoff (umol/m2/s) |
Example
data records:
Experiment_day,Date,Year,Month,Day,Hour,Minute,Air_temp_64m,Press_64m,H2O_64m,Wind_speed_64m,Wind_dir_64m, CO2_64m,CO2_10cm,CO2_35cm,CO2_70cm,CO2_1_4m,CO2_3m,CO2_6m,CO2_10_7m,CO2_20m,CO2_35m, CO2_40m,CO2_50m,CO2_64m,H2O_10cm,H2O_35cm,H2O_70cm,H2O_1_4m ,H2O_3m,H2O_6m,H2O_10_7m, H2O_20m,H2O_35m,H2O_40m,H2O_50m,H2O_64m,Friction_velocity_64m,Sensible_heat_flux_64m,Latent_heat_flux_64m, CO2_flux_64m,CO2_storage_64m,NEE_raw,NEE_corr 885,2002-06-03,2002,6,3,0,0,27.793494,98.851497,28.439289,2.603938,55.894123, 380.032299,-999,-999,-999,-999,-999,-999,-999,-999,-999, 387.955142,387.038845,382.934134,-999,-999,-999,-999,-999,-999,-999, -999,-999,28.440155,28.26809,27.997728,0.246397,-18.687878,49.996735, 9.547383,-999,-999,-999 885.020833,2002-06-03,2002,6,3,0,30,27.772336,98.885206,27.517323,2.754689,62.15423, 377.503361,-999,445.819547,414.175328,442.356354,-999,428.315086,-999,412.909541,388.641362, 388.573601,384.825059,380.467529,-999,28.878946,28.613601,28.839289,-999,28.732323,-999, 28.475118,27.601395,27.537451,27.367376,27.087395,0.184523,-13.462401,23.286157, 6.000996,-999,-999,-999 885.041667,2002-06-03,2002,6,3,1,0,27.486377,98.912688,27.839325,2.610075,49.564987, 380.082424,442.81277,435.295833,424.853022,430.217705,445.900646,434.21457,416.879111,416.183829,390.93016, 388.698053,386.931076,381.434725,28.645426,28.415124,28.350015,28.484821,28.668677,28.434639,28.155599, 28.134648,27.354239,27.264799,27.161372,26.943763,0.217103,-16.614595,20.904091, 9.21241,9.804168,19.016578,19.016578 ... |
Site boundaries: (All latitude and longitude given in degrees and fractions)
| Site (Region) | Westernmost Longitude | Easternmost Longitude | Northernmost Latitude | Southernmost Latitude | Geodetic Datum |
|---|---|---|---|---|---|
| Para Western (Santarem) - km 83 Logged Forest Tower (Para Western (Santarem)) | -54.9707 | -54.9707 | -3.017 | -3.017 | World Geodetic System, 1984 (WGS-84) |
Time period:
- The data set covers the period 2002/06/03 to 2004/01/30
- Temporal Resolution: 30-Minute
Platform/Sensor/Parameters measured include:
- TOWER / SONIC ANEMOMETER / SURFACE WINDS
- TOWER / TEMPERATURE SENSOR / AIR TEMPERATURE
- TOWER / IRGA (INFRARED GAS ANALYZER) / CARBON DIOXIDE
- TOWER / IRGA (INFRARED GAS ANALYZER) / WATER VAPOR
- TOWER / SONIC ANEMOMETER / CARBON DIOXIDE
- TOWER / SONIC ANEMOMETER / WATER VAPOR
3. Data Application and Derivation:
Data Calculations
For the storage flux, molar densities of CO2 and H2O in the profile were
determined using an IRGA. The amount of CO2 stored beneath the eddy
flux sensors (64 m) was calculated by integrating the profile between 0
and 64 m. The storage flux was then calculated by differentiating this
quantity with respect to time.
Net ecosystem exchange (NEE) was calculated for each half-hour interval
as the sum of the turbulent CO2 flux at 64 m and the change in the
amount of CO2 in the air column beneath 64 m (the storage flux).
Uncertainties in the calculation of respiration and NEE at the Tapajos
sites are discussed in detail in Saleska et al. [2003] and Miller et
al. [2004].
Applications
Analysis of eddy covariance observations provides information useful
for identifying which physiological and physical processes play
dominant roles in controlling CO2 exchange. In turn, this information
contributes to the development and improvement of models of
ecosystem-atmosphere CO2 exchange and to understanding which processes
are
particularly sensitive to future change.
4. Quality Assessment:
This data set is not gap-filled. Missing values or data that were flagged as unreliable have been given a value of -999. It is up to the end-user to fill these values if necessary.
5. Data Acquisition Materials and Methods:
Flux measurements were made from a 65 m
tower located in a gap created by a reduced impact logging operation
conducted at the Tapajos National Forest, Para, Brazil. Winds from the
east predominate at 64 m, accounting for about 85% of day and night
intervals. The data acquisition computer and closed-path gas analyzers
were located in an air-conditioned hut 8 m south of the tower base.
Data acquisition and control systems were automated and data were
downloaded weekly.
Profile measurements:
Closed path IRGA
An infra-red gas analyzer (IRGA, LI-COR LI800, Lincoln NE) sequentially
measured the concentrations of CO2 and H2O at 12 heights (0.1, 0.35,
0.7,
1.4, 3, 6, 10.7, 20, 35, 40, 50, 64 m above the ground) every 48 minutes.
Four standard liters per minute (slpm) of air were drawn through a filter at each altitude, down
5.5-mm inner-diameter polyethylene lined tubing (Furon Dekabon 1300),
through a solenoid manifold in an enclosure at the base of the tower
(Parker General Valve, Fairfield NJ), into the equipment hut, and
through the IRGA cell. The pressure in the IRGA cell was actively
controlled at 83 kPa (MKS Instruments, Andover MA). The IRGA was
calibrated for CO2 and water vapor daily by sequentially sampling purge
air, CO2 standard in air (+-1% Scott Marin, Riverside CA), CO2 free air
(Scott Marin, Riverside CA), and 16 C dew point air (LI-COR LI610,
Lincoln NE).
Atmospheric CO2 and H2O
concentrations: Open path IRGA
An independent measurement of CO2 and H2O at 64 m was made with an open
path IRGA (LI-COR LI7500, Lincoln NE) positioned 40-cm south of the
sonic anemometer. The open path was calibrated by comparison with the
simultaneous measurements made with the closed-path eddy covariance
IRGA.
Flux
measurements
The turbulent fluxes of sensible heat, latent heat, CO2, and momentum
at 64 m were determined with the eddy covariance technique. The signals
directly required for flux calculation were digitized and stored at 4
Hz. Wind and temperature were measured with a 3-axis sonic anemometer
pointed due east (Campbell Scientific, Logan UT).
6. Data Access:
This data is available through the Oak Ridge National Laboratory (ORNL) Distributed Active Archive Center (DAAC).
Data Archive Center:
Contact for Data Center Access Information:
E-mail: uso@daac.ornl.gov
Telephone: +1 (865) 241-3952
7. References:
Bruno, R.D., H.R. da Rocha, H.C. de Freitas, M.L. Goulden, and S.D. Miller. 2006. Soil moisture dynamics in an eastern Amazonian tropical forest. Hydrological Processes 20(12):2477-2489.doi:10.1002/hyp.6211
Miller, S.D., M.L. Goulden, M.C. Menton, H.R. da Rocha, H.C. de Freitas, A.M.E.S. Figueira, and C.A.D. de Sousa. (2004) Biometric and micrometeorological measurements of tropical forest carbon balance. Ecological Applications 14(4):S114-126. doi:10.1890/02-6005
Saleska SR, SD Miller, DM Matross, ML Goulden, SC Wofsy, HR da Rocha, PB de Camargo, P Crill, BC Daube, HC de Freitas, L Hutyra, M Keller, V Kirchhoff, M Menton, JW Munger, EH Pyle, AH Rice, H Silva H. 2003. Carbon in amazon forests: Unexpected seasonal fluxes and disturbance-induced losses. Science 302:1554-1557
Related Publications
- Miller, S.D., M.L. Goulden, H.R. da Rocha, 2007: The effect of canopy gaps on subcanopy ventilation and scalar fluxes in a tropical forest, Agr. Forest Meteorol. 142:25-34. doi:10.1016/j.agrformet.2006.10.008