Get Data
Summary:
Tower flux measurements of carbon dioxide, water vapor, heat, and meteorological variables were obtained at the Tapajos National Forest, km 83 site, Santarem, Para, Brazil. For the period June 29, 2000 through March 11, 2004, 30-minute averaged and calculated quantities of fluxes of momentum, heat, water vapor, and carbon dioxide, storage of carbon dioxide in the air column, are reported.
Data are reported in three comma separated
files: (1) 30
minute-averages, (2) the daily (24 hour) averages,
and (3) the monthly
(calendar) averages.
The variables measured on the 67 m tower relate to meteorology, soil
moisture, respiration, fluxes
of momentum,
heat, water vapor, and carbon dioxide, and were used
to calculate storage of carbon dioxide, Net Ecosystem Exchange, and
Gross Primary Productivity. Most of the
variables have not been gap filled. However, CO2 flux and storage have been
filled to avoid biases in Net Ecosystem Exchange; a fill index flag is
included to indicate which data points were filled. Variables derived
from the filled variables (respiration, NEE, GPP) are essentially
filled also. Net ecosystem exchange has been filtered for calm
nighttime periods.
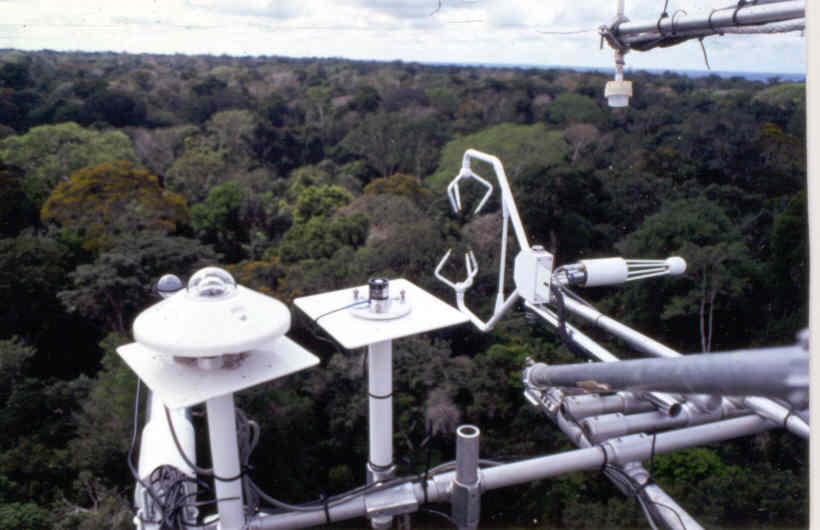
Instruments positioned at the top of the flux tower located at km 83, Tapajos National Forest
Data Citation:
Cite this data set as follows:
Miller, S., M. Goulden, and H.R. da Rocha, 2009. LBA-ECO CD-04 Meteorological and Flux Data, km 83 Tower Site, Tapajos National Forest. Data set. Available on-line [http://daac.ornl.gov] from Oak Ridge National Laboratory Distributed Active Archive Center, Oak Ridge, Tennessee, U.S.A. doi: 10.3334/ORNLDAAC/946
Implementation of the LBA Data and Publication Policy by Data Users:
The LBA Data and Publication Policy [http://daac.ornl.gov/LBA/lba_data_policy.html] is in effect for a period of five (5) years from the date of archiving and should be followed by data users who have obtained LBA data sets from the ORNL DAAC. Users who download LBA data in the five years after data have been archived must contact the investigators who collected the data, per provisions 6 and 7 in the Policy.
This data set was archived in October of 2009. Users who download the data between October 2009 and September 2014 must comply with the LBA Data and Publication Policy.
Data users should use the Investigator contact information in this document to communicate with the data provider. Alternatively, the LBA Web Site [http://lba.inpa.gov.br/lba/] in Brazil will have current contact information.
Data users should use the Data Set Citation and other applicable references provided in this document to acknowledge use of the data.
Table of Contents:
- 1 Data Set Overview
- 2 Data Characteristics
- 3 Applications and Derivation
- 4 Quality Assessment
- 5 Acquisition Materials and Methods
- 6 Data Access
- 7 References
1. Data Set Overview:
Project: LBA (Large-Scale Biosphere-Atmosphere Experiment in the Amazon)
Activity: LBA-ECO
LBA Science Component: Carbon Dynamics
Team ID: CD-04 (Goulden / Rocha)
The investigators were Goulden, Prof. Michael L.; Miller, Dr. Scott Dennis and Rocha, Prof. Humberto Ribeiro da . You may contact Miller, Dr. Scott D. (smiller@albany.edu)
LBA Data Set Inventory ID: CD04_Meteorology_Fluxes
Over 3.5 years of 30-minute averaged measured and calculated quantities were compiled at the km 83 tower site (June 29, 2000-March 11, 2004). The variables relate to meteorology, soil moisture, fluxes of momentum, heat, water vapor, and carbon dioxide, including the storage of carbon dioxide in the air column beneath the flux sensors. Data are presented as values measured or calculated at 30 minute intervals as well as calculated daily (24 hour) and monthly (calendar) means.
Related Data Sets:
- LBA-ECO CD-04 CO2 Profiles, km 83 Tower Site, Tapajos National Forest, Brazil: 2000-2004 (canopy atmospheric CO2 concentrations at the same site over the same period)
- LBA-ECO CD-04 Logged Forest Tower Site Soil Respiration Chamber Data, FLONA Tapajos km 83 (soil respiration data from the same site)
2. Data Characteristics:
Data are provided in three comma separated
ASCII files:
CD04_km83_tower_fluxes_dailyavg.csv
CD04_km83_tower_fluxes_monthly_avg.csv
File 1: CD04_km83_tower_fluxes_30_min.csv
There are 64992 records (rows), each corresponding to a 30 minute interval for a total 1354 days beginning June 29, 2000 and ending March 11, 2004. The timestamp corresponds to the beginning of the 30 minute interval. The first timestamp is experiment day 181, or June 29, 2000, where experiment day counts from 0 at 00:00 hours on January 1, 2000. The last timestamp is day 1535, or March 11, 2004, the day that a tree fell on the tower.
Data File Description:
| Column # | Heading | Units | Sensor | Description |
|---|---|---|---|---|
| 1 | exp_day | experiment day (0 = January 1, 2000, 00:00 hours) | ||
| 2 | year | yyyy | year | |
| 3 | month | mm | month | |
| 4 | day | dd | day | |
| 5 | hr | hh | hour at start of sampling period (GMT:24 hour clock) | |
| 6 | min | mm | minute at start of sampling period (GMT) | |
| 7 | solar_in | W/m2 | Kipp & Zonen CM6B | downward flux of solar radiation |
| 8 | solar out | W/m2 | Kipp & Zonen CM6B | upward flux of solar radiation |
| 9 | long_in | W/m2 | Kipp & Zonen CG2 | downward flux of long wave radiation |
| 10 | long_out | W/m2 | Kipp & Zonen CG2 | upward flux of long wave radiation |
| 11 | par_in | micromol/m2/s | Li-Cor LI190 | downward flux of photosynthetically active radiation |
| 12 | par_out | micromol/m2/s | Li-Cor LI190 | upward flux of photosynthetically active radiation |
| 13 | rnet | W/m2 | Rebs Q*7 | net radiation at 64 m height |
| 14 | T64 | degrees C | Campbell Scientific T107 | air temperature at 64 m height |
| 15 | T40 | degrees C | Campbell Scientific T107 | air temperature at 40 m height |
| 16 | T10 | degrees C | Campbell Scientific T107 | air temperature at 10 m height |
| 17 | T2 | degrees C | Campbell Scientific T107 | air temperature at 2 m height |
| 18 | press | kPa | Li-Cor LI7500 | air pressure measured at 64 m height |
| 19 | h2o_64 | mmol/mol | Li-Cor LI7500 | atmospheric water content measured at 64 m height |
| 20 | Usonic_64 | m/s | Campbell CSAT3 | wind speed measured on the sonic anemometer at 64 m height |
| 21 | WD_64 | degrees | Campbell CSAT3 | wind direction measured on the sonic anemometer at 64 m height |
| 22 | Ucup_64 | m/s | Met One 014 | wind speed measured on the cup anemometer at 64 m height |
| 23 | Ucup_50 | m/s | Met One 014 | wind speed measured on the cup anemometer at 50 m height |
| 24 | Ucup_40 | m/s | Met One 014 | wind speed measured on the cup anemometer at 40 m height |
| 25 | rain | mm | Texas Electronics TE525 | rainfall amount measured at 64 m height using a tipping bucket rain gauge during the 30 minute interval |
| 26 | Tsoil_10 | degrees C | Campbell Scientific T107 | soil temperature at 10 cm depth |
| 27 | Tsoil_20 | degrees C | Campbell Scientific T107 | soil temperature at 20 cm depth |
| 28 | Tsoil_50 | degrees C | Campbell Scientific T107 | soil temperature at 50 cm depth |
| 29 | h2o_soil_10 | m3/m3 | Campbell Scientific CS615 | soil moisture at 10 cm depth |
| 30 | h2o_soil_20 | m3/m3 | Campbell Scientific CS615 | soil moisture at 20 cm depth |
| 31 | h2o_soil_40 | m3/m3 | Campbell Scientific CS615 | soil moisture at 40 cm depth |
| 32 | hf_soil | W/m2 | REBS HFT 3.1 | soil heat flux 10 cm depth |
| 33 | ustar | m/s | Campbell CSAT3 | friction velocity 64 m height |
| 34 | hs | W/m2 | Campbell Scientific | sensible heat flux measured at 64 m height |
| 35 | hl | W/m2 | Li-Cor LI7500 | latent heat flux measured at 64 m height |
| 36 | co2_64 | ppm | Li-Cor LI7000 | atmospheric CO2 concentration at 64 m height |
| 37 | fco2 | umol/m2/s | Li-Cor LI7000/LI7500 | CO2 flux at 64 m height |
| 38 | ifco2 | CO2 flux fill index ( 0= measured, 1= filled) | ||
| 39 | fstor | umol/m2/s | Li-Cor LI7000 | CO2 storage below 64 m height |
| 40 | ifstor | CO2 storage fill index ( 0= measured, 1= filled) | ||
| 41 | nee_raw | umol/m2/s | Net ecosystem exchange not u* corrected | |
| 42 | inee_raw | NEE fill index ( 0= measured, 1= filled) | ||
| 43 | nee | umol/m2/s | Net ecosystem exchange calculated as the sum of turbuant CO2 flux at 64 m and the change in the amount of CO2 stored in the air column below 64 m | |
| 44 | ifilt | NEE u* filter index (1= u* filtered) | ||
| 45 | gpp | umol/m2/s | gross primary productivity | |
| 46 | igpp | GPP fill index ( 0= measured, 1= filled) | ||
| 47 | resp_meas | umol/m2/s | respiration measured | |
| 48 | resp_20_pts | umol/m2/s | respiration smoothed using the nearest 20 pts | |
| 49 | ndays_20_pts | umol/m2/s | ndays respiration smoothed using the 20 nearest points | |
| 50 | resp_par_40 | umol/m2/s | respiration from PAR model PAR >0 and U* > 0.22 | |
| missing data are represented by -999 | ||||
Example
Data Records: CD04_km83_tower_fluxes_30_min.csv
|
Header records omitted exp_day,year,month,day,hr,min,solar_in,solar_out,long_in,long_out,par_in,par_out,rnet,T64,T40,T10,T2,press,h2o_64m, Usonic_64,WD_64,Ucup_64,Ucup_50,Ucup_40, rain,Tsoil_10,Tsoil_20,Tsoil_50,h2o_soil_10,h2o_soil_20,h2o_soil_40, hf_soil,ustar,hs,hl,co2_64,fco2,ifco2,fstor,ifstor,nee_raw,inee_raw,nee,ifilt,gpp,igpp,resp_meas,resp_20_pts,ndays_20_pts,resp_par_40 181,2000,6,29,0,0,-999,-999,-999,-999,-999,-999,-999,24.71,23.02,23.49,22.83,98.71,27.66,3.03,61.04,1.97,1.18,0.45,0.00,-999,24.36,24.44,0.43,0.49,0.46,-5.99,0.55,-999,-999,389.84,3.78,0,7.06,0,10.84,0,10.84,0,-3.93,0,-999,6.910437,8.27,7.86, 181.020833,2000,6,29,0,30,-999,-999,-999,-999,-999,-999,-999,24.41,22.80,23.33,22.72,98.67,27.98,2.39,84.73,1.84,1.29,0.45,0.00,-999,24.37,24.44,0.43,0.49,0.46,-6.41,0.46,16.02,-999,389.07,5.92,0,1.45,0,7.37,0,7.37,0,-0.46,0,-999,6.910437,8.27,7.85, ... 1534.958333,2004,3,13,23,0,-0.21,-999,444.39,440.81,-0.44,-999,-999,-999,-999,-999,25.22,-999,19.06,-999,139.09,-999,-999,-999,0.00,24.95,24.98,24.94,0.44,-999,-999,-0.49,-999,-999,-999,402.39,-999,1,0.67,0,-999,1,-999,0,-999,1,-999,11.151,2.04,11.31, 1534.979167,2004,3,13,23,30,-0.24,-999,442.79,438.88,-0.50,-999,-999,-999,-999,-999,25.01,-999,18.62,2.07,137.23,-999,-999,-999,0.00,24.97,25.00,24.94,0.43,-999,-999,-1.27,-999,-999,-999,404.85,-999,1,5.92,0,-999,1,-999,0,-999,1,-999,11.151,2.04,11.32, |
File 2:
CD04_km83_tower_fluxes_dailyavg.csv
There are 1354 records (rows), each corresponding to a daily (24 hour) average of the 30 minute values.
Data File Description:
| Column # | Heading | Units | Sensor | Description |
|---|---|---|---|---|
| 1 | exp_day | experiment day (0 = January 1, 2000, 00:00 hours) | ||
| 2 | year | yyyy | year | |
| 3 | month | mm | month | |
| 4 | day | dd | day | |
| 5 | solar_in | W/m2 | Kipp & Zonen CM6B | mean daily downward flux of solar radiation |
| 6 | solar_out | W/m2 | Kipp & Zonen CM6B | mean daily upward flux of solar radiation |
| 7 | long_in | W/m2 | Kipp & Zonen CG2 | mean daily downward flux of long wave radiation |
| 8 | long_out | W/m2 | Kipp & Zonen CG2 | mean daily upward flux of long wave radiation |
| 9 | par_in | micromol/m2/s | Li-Cor LI190 | mean daily downward flux of photosynthetically active radiation |
| 10 | par_out | micromol/m2/s | Li-Cor LI190 | mean daily upward flux of photosynthetically active radiation |
| 11 | rnet | W/m2 | Rebs Q*7 | mean daily net radiation 64 m; |
| 12 | T64 | degrees C | Campbell Scientific T107 | mean daily air temperature at 64 m height |
| 13 | T40 | degrees C | Campbell Scientific T107 | mean daily air temperature at 40 m height |
| 14 | T10 | degrees C | Campbell Scientific T107 | mean daily air temperature at 10 m height |
| 15 | T2 | degrees C | Campbell Scientific T107 | mean daily air temperature at 2 m height |
| 16 | h2o_64 | mmol/mol | Li-Cor LI7500 | mean daily atmospheric water content measured at 64 m height |
| 17 | press | kPa | Li-Cor LI7500 | mean daily air pressure measured at 64m height |
| 18 | WS_64 | m/s | Campbell CSAT3 | mean daily wind speed measured on the sonic anemometer at 64 m height |
| 19 | WD_64 | degrees | Campbell CSAT3 | mean daily wind direction measured on the sonic anemometer at 64 m height |
| 20 | rain | mm | Texas Electronics TE525 | total daily rainfall measured at 64 m height using a tipping bucket rain gauge |
| 21 | Tsoil_10 | degrees C | Campbell Scientific T107 | mean daily soil temperature at 10 cm depth |
| 22 | Tsoil_20 | degrees C | Campbell Scientific T107 | mean daily soil temperature at 20 cm depth |
| 23 | Tsoil_50 | degrees C | Campbell Scientific T107 | mean daily soil temperature at 50 cm depth |
| 24 | h2o_soil_10 | m3/m3 | Campbell Scientific CS615 | mean daily soil moisture at 10 cm depth |
| 25 | h2o_soil_20 | m3/m3 | Campbell Scientific CS615 | mean daily soil moisture at 20 cm depth |
| 26 | h2o_soil_40 | m3/m3 | Campbell Scientific CS615 | mean daily soil moisture at 40 cm depth |
| 27 | hf_soil | W/m2 | REBS HFT 3.1 | mean daily soil heat flux 10 cm depth |
| 28 | ustar | m/s | Campbell CSAT3 | mean daily friction velocity 64 m height |
| 29 | hs | W/m2 | Campbell Scientific | mean daily sensible heat flux measured at 64 m height |
| 30 | hl | W/m2 | Li-Cor LI7500 | mean daily latent heat flux measured at 64 m height |
| 31 | co2_64 | ppm | Li-Cor LI7000 | mean daily atmospheric CO2 concentration at 64 m height |
| 32 | fco2 | umol/m2/s | Li-Cor LI7000/LI7500 | mean daily CO2 flux at 64 m height |
| 33 | fstor | umol/m2/s | Li-Cor LI7000 | mean daily CO2 storage below 64 m height |
| 34 | nee | umol/m2/s | mean daily Net ecosystem exchange calculated as the sum of turbulent CO2 flux at 64 m and the change in the amount of CO2 stored in the air column below 64 m | |
| 35 | resp | umol/m2/s | mean daily ecosystem respiration | |
| 36 | gpp | umol/m2/s | mean daily gross primary productivity | |
| missing data are represented by -999 | ||||
Example Data Records: CD04_km83_tower_fluxes_dailyavg.csv
| Header records omitted exp_day,year,month,day,solar_in,solar_out,long_in,long_out,par_in,par_out,rnet,T64,T40,T10,T2,h2o_64,press,WS_64,WD_64,rain, Tsoil_10,Tsoil_20,Tsoil_50,h2o_soil_10,h2o_soil_20,h2o_soil_40,hf_soil,ustar,hs, hl,co2_64,fco2,fstor,nee,resp,gpp 181,2000,6,29,-999,-999,-999,-999,-999,-999,-999,26.12,24.54,24.28,23.62,-999,-999,-999,-999,0,-999,24.28,24.44,0.42,0.49,0.46,-1.06,-999,-999,-999,396.9,-999,0.04,-999,6.91,-999 182,2000,6,30,159.74,-999,-999,-999,333.26,10.7,105.05,26.39,24.64,24.32,23.74,27.73,98.67,2.09,-999,2.54,-999,24.36,24.43,0.42,0.49,0.45,-1.06,0.27,-999,-999,-999,-2.37,-999,-999,6.91,-999 ... 1533,2004,3,12,-999,-999,-999,444.37,-999,-999,-999,-999,-999,-999,24.17,18.34,-999,1.72,147.13,1.27,24.72,24.75,24.9,0.45,-999,-999,-0.1,-999,-999,-999,392.92,-999,0.24,-999,11.15,-999 1534,2004,3,13,-999,-999,-999,445.18,-999,-999,-999,-999,-999,-999,24.48,18.49,-999,-999,141.5,0,24.84,24.88,24.92,0.44,-999,-999,-0.05,-999,-999,-999,411.82,-999,-0.33,-999,11.15,-999 |
File 3: CD04_km83_tower_fluxes_monthly_avg.csv
There are 44 records (rows), each corresponding to a monthly (calendar) average of the daily values. Months with some missing days were excluded. The experimental day for monthly average was set as a day near the end of the month. Fields are included that report the number of days used to calculate the various quantities.
Data
File Description:
| Column | Heading | Units | Description |
|---|---|---|---|
| 1 | exp_day | experiment day (0 = January 1,2000, 00:00 hours) | |
| 2 | year | yyyy | year |
| 3 | month | mm | month |
| 4 | solar_in | W/m2 | mean monthly downward flux of solar radiation |
| 5 | solar_out | W/m2 | mean monthly upward flux of solar radiation |
| 6 | long_in | W/m2 | mean monthly downward flux of long wave radiation |
| 7 | long_out | W/m2 | mean monthly upward flux of long wave radiation |
| 8 | par_in | umol/m2/s | mean monthly downward flux of photosynthetically active radiation |
| 9 | par_out | umol/m2/s | mean monthly upward flux of photosynthetically active radiation |
| 10 | rnet | W/m2 | mean monthly net radiation 64 m |
| 11 | T64 | degrees C | mean monthly air temperature at 64 m height |
| 12 | T40 | degrees C | mean monthly air temperature at 40 m height |
| 13 | T10 | degrees C | mean monthly air temperature at 10 m height |
| 14 | T2 | degrees C | mean monthly air temperature at 2 m height |
| 15 | h2o_64 | mmol/mol | mean monthly atmospheric water content measured at 64 m height |
| 16 | press | kPa | mean monthly air pressure measured at 64m height |
| 17 | WS_64 | m/s | mean monthly wind speed measured on the sonic anemometer at 64 m height |
| 18 | WD_64 | degrees | mean monthly wind direction measured on the sonic anemometer at 64 m height |
| 19 | rain | mm | total monthly rainfall measured at 64 m height using a tipping bucket rain gauge |
| 20 | Tsoil_10 | degrees C | mean monthly soil temperature at 10 cm depth |
| 21 | Tsoil_20 | degrees C | mean monthly soil temperature at 20 cm depth |
| 22 | Tsoil_50 | degrees C | mean monthly soil temperature at 50 cm depth |
| 23 | h2o_soil_10 | m3/m3 | mean monthly soil moisture at 10 cm depth |
| 24 | h2o_soil_20 | m3/m3 | mean monthly soil moisture at 20 cm depth |
| 25 | h2o_soil_40 | m3/m3 | mean monthly soil moisture at 40 cm depth |
| 26 | hf_soil | W/m2 | mean monthly soil heat flux 10 cm depth |
| 27 | ustar | m/s | mean monthly friction velocity 64 m height |
| 28 | hs | W/m2 | mean monthly sensible heat flux measured at 64 m height |
| 29 | hl | W/m2 | mean monthly latent heat flux measured at 64 m height |
| 30 | co2_64 | ppm | mean monthly atmospheric CO2 concentration at 64 m height |
| 31 | fco2 | umol/m2/s | mean monthly CO2 flux at 64 m height |
| 32 | fstor | umol/m2/s | mean monthly CO2 storage below 64 m height |
| 33 | nee | umol/m2/s | mean monthly Net ecosystem exchange calculated as the sum of turbulent CO2 flux at 64 m and the change in the amount of CO2 stored in the air column below 64 m |
| 34 | resp | umol/m2/s | mean monthly ecosystem respiration |
| 35 | resp_2 | umol/m2/s | mean monthly ecosystem respiration linear par model |
| 36 | resp_3 | umol/m2/s | mean monthly ecosystem respiration calculated using the par model |
| 37 | gpp | umol/m2/s | mean monthly gross primary productivity |
| 38 | CI_par_in | umol/m2/s | 95 percent confidence interval for par incoming 64 m |
| 39 | CI_par_out | umol/m2/s | 95 percent confidence interval for par outgoing 64 m |
| 40 | CI_rnet | W/m2 | 95 percent confidence interval for net radiation 64 m |
| 41 | CI_T64 | degrees C | 95 percent confidence interval for air temperature 64 m |
| 42 | CI_h2o | mmol/mol | 95 percent confidence interval for h2o concentration 64 m |
| 43 | CI_WS | m/s | 95 percent confidence interval for wind speed sonic anemometer 64 m |
| 44 | CI_WD | degrees | 95 percent confidence interval for wind direction sonic anemometer 64 m |
| 45 | CI_ustar | m/s | 95 percent confidence interval for friction velocity |
| 46 | CI_hs | W/m2 | 95 percent confidence interval for sensible heat flux 64 m |
| 47 | CI_hl | W/m2 | 95 percent confidence interval for latent heat flux 64 m |
| 48 | CI_fco2 | umol/m2/s | 95 percent confidence interval for co2 flux 64 m |
| 49 | CI_fstor | umol/m2/s | 95 percent confidence interval for co2 storage below 64 m |
| 50 | CI_nee | umol/m2/s | 95 percent confidence interval for NEE |
| 51 | CI_resp | umol/m2/s | 95 percent confidence interval for respiration |
| 52 | CI_gpp | umol/m2/s | 95 percent confidence interval for GPP |
| 53 | Ndays | number of days included in the calendar month | |
| 54 | Ndays_par_in | number of days included in the calculation of mean par_in | |
| 55 | Ndays_par_out | number of days included in the calculation of mean par_out | |
| 56 | Ndays_rnet | number of days included in the calculation of mean net radiation | |
| 57 | Ndays_T64 | number of days included in the calculation of mean air temperature at 64 m | |
| 58 | Ndays_h2o | number of days included in the calculation of mean water concentration at 64 m | |
| 59 | Ndays_co2 | number of days included in the calculation of mean CO2 concentration at 64 m | |
| 60 | Ndays_WS | number of days included in the calculation of mean wind speed | |
| 61 | Ndays_WD | number of days included in the calculation of mean wind direction | |
| 62 | Ndays_rain | number of days included in the calculation of total rainfall | |
| 63 | Ndays_ustar | number of days included in the calculation of mean friction velocity | |
| 64 | Ndays_hs | number of days included in the calculation of mean sensible heat flux | |
| 65 | Ndays_hl | number of days included in the calculation of mean latent heat flux | |
| 66 | Ndays_fco2 | number of days included in the calculation of mean CO2 flux | |
| 67 | Ndays_fstor | number of days included in the calculation of mean CO2 storage | |
| 68 | Ndays_nee | number of days included in the calculation of mean net ecosystem exchange | |
| 69 | Ndays_resp | number of days included in the calculation of mean respiration | |
| 70 | Ndays_gpp | number of days included in the calculation of mean gross primary productivity | |
| missing data are represented by -999 | |||
Example Data Records: CD04_km83_tower_fluxes_monthly_avg.csv
|
Header records omitted exp_day,year,month,solar_in,solar_out,long_in,long_out,par_in,par_out,rnet,T64,T40,T10,T2,h2o_64,press,WS_64,WD_64,rain, Tsoil_10,Tsoil_20,Tsoil_50,h2o_soil_10,h2o_soil_20,h2o_soil_40,hf_soil,ustar,hs,hl,co2_64,fco2,fstor,nee,resp,resp_2,resp_3,gpp, CI_par_in,CI_par_out,CI_rnet,CI_T64,CI_h2o,CI_WS,CI_WD,CI_ustar,CI_hs,CI_hl,CI_fco2,CI_fstor,CI_nee,CI_resp,CI_gpp, Ndays,Ndays_par_in,Ndays_par_out,Ndays_rnet,Ndays_T64,Ndays_h2o,Ndays_co2,Ndays_WS,Ndays_WD,Ndays_rain, Ndays_ustar,Ndays_hs,Ndays_hl,Ndays_fco2,Ndays_fstor,Ndays_nee,Ndays_resp,Ndays_gpp 211.5,2000,7,204,-999,-999,-999,426.1,13.24,140.39,26.75,24.83,24.3,23.56,25.98,98.73,2.01,-999,162.56, -999,24.21,24.32,0.43,0.49,0.45,-1.05,0.27,21.58,112.45,390.21,-1.46,-0.06,-0.12,7.66,5.55,6.52,8.26, 29.1,0.81,9.81,0.42,0.55,0.21,-999,0.02,3.71,8.23,0.49,0.19,0.57,1.58,0.52, 31,25,25,25,25,15,23,19,0,31, 25,17,14,23,23,21,86,21 242.5,2000,8,229,-999,-999,-999,478.21,14.01,154.76,26.43,25.86,25.15,24.45,26.55,98.54,2.24,95.79,62.48, -999,25.07,24.91,0.42,0.48,0.45,-0.81,0.3,26.82,121.11,394.41,-1.63,0.04,0.35,9.38,6.79,9.1,9.34, 26.19,0.63,9.05,0.31,0.18,0.11,9.99,0.02,2.96,6.25,0.44,0.14,0.7,1.43,0.78, 31,29,29,29,27,27,23,28,23,31, 29,18,15,29,23,23,114,23 ... 1490.5,2004,1,154,20.2,426.11,449.19,322.23,-999,108.27,24.69,24.91,24.48,24.26,16.62,98.53,2.12,126.1,154.18, 24.98,25.01,25.32,0.42,-999,-999,-1.19,0.28,23.93,108.94,406.97,-1.31,-0.01,-0.48,8.45,4.86,6.04,9.65, 43.48,-999,15.85,0.5,0.39,0.14,12.51,0.03,8.22,19.31,0.62,0.37,0.67,1.1,0.72, 31,21,0,21,24,20,20,20,20,31, 17,10,8,16,18,13,134,13 1520.5,2004,2,157,-999,431.35,444.36,327.67,-999,108.89,23.79,24.2,24.05,24.02,17.24,98.63,1.9,124.76,246.38, 24.59,24.66,24.87,0.44,-999,-999,-0.69,0.3,-999,-999,404.34,-0.95,-0.08,-1.11,8.2,7.02,8.97,9.61, 47.77,-999,17.07,0.35,0.25,0.17,15.7,0.03,-999,-999,0.82,0.14,0.98,0.95,0.72, 29,20,0,20,19,22,29,20,22,29, 17,0,0,16,28,16,190,16 |
Site boundaries: (All latitude and longitude given in degrees and fractions)
| Site (Region) | Westernmost Longitude | Easternmost Longitude | Northernmost Latitude | Southernmost Latitude | Geodetic Datum |
|---|---|---|---|---|---|
| Para Western (Santarem) - km 83 Logged Forest Tower (Para Western (Santarem)) | -54.96889 | -54.96889 | -3.01806 | -3.01806 | World Geodetic System, 1984 (WGS-84) |
Time period:
- The data set covers the period 2000/06/29 to 2004/03/11
- Temporal Resolution: 30-Minute Average
Platform/Sensor/Parameters measured include:
- TOWER / SONIC ANEMOMETER / SURFACE WINDS
- TOWER / TEMPERATURE SENSOR / AIR TEMPERATURE
- TOWER / NET RADIOMETER / NET RADIATION
- TOWER / PYRANOMETER / SOLAR RADIATION
- TOWER / QUANTUM SENSOR / PHOTOSYNTHETICALLY ACTIVE RADIATION
- TOWER / RAIN GAUGE / PRECIPITATION AMOUNT
- TOWER / IRGA (INFRARED GAS ANALYZERS) / CARBON DIOXIDE
- TOWER / IRGA (INFRARED GAS ANALYZER) / WATER VAPOR
- FIELD INVESTIGATION / SOIL MOISTURE PROBE / SOIL MOISTURE
- FIELD INVESTIGATION / THERMOCOUPLE / SOIL TEMPERATURE
- FIELD INVESTIGATION / ANALYSIS / HEAT FLUX
- FLUX TOWER / SONIC ANEMOMETER / CARBON DIOXIDE FLUX
- FLUX TOWER / SONIC ANEMOMETER / WATER FLUX
- FLUX TOWER / IRGA (INFRARED GAS ANALYZER) / WATER FLUX
- FLUX TOWER / IRGA (INFRARED GAS ANALYZER) / CARBON DIOXIDE FLUX
3. Data Application and Derivation:
Data Calculations
For the storage flux, molar densities of CO2 and H2O in the profile were determined using an IRGA. The amount of CO2 stored beneath the eddy flux sensors (64 m) was calculated by integrating the profile between 0 and 64 m. The storage flux was then calculated by differentiating this quantity with respect to time.
Net ecosystem exchange (NEE) was calculated for each half-hour interval as the sum of the turbulent CO2 flux at 64 m and the change in the amount of CO2 in the air column beneath 64 m (the storage flux). Ecosystem respiration was calculated from nighttime measurements of NEE during periods with sufficient vertical mixing; i.e., friction velocity ms-1 [Miller et al., 2004]. The necessary -threshold at this site was determined by comparing flux tower estimates of with several independent lines of evidence (scaled-up estimates of respiration components [Chambers et al., 2004b], and radon-based estimates of nocturnal mixing [Martens et al., 2004]. Uncertainties in the calculation of respiration and NEE at the Tapajos sites are discussed in detail in Saleska et al. [2003] and Miller et al. [2004].
Gross primary productivity was calculated by subtracting NEE from ecosystem respiration. Continuous 30-minute GPP were averaged to construct daily and monthly estimates of GPP. Uncertainty in monthly and annual GPP was calculated as the 95% confidence interval based on averaging daily GPP.
An additional estimate of respiration (R) was calculated as the intercept (PAR=0) of a non-linear least squares fit of a light curve model, NEE = R + (A*PAR)./(PAR+B), using measured PAR and NEE (when PAR>0 umol/m2/s and u*>0.22 m/s) , and A and B and R are the regression constants. For each day, the light model was applied to all available data within 20 days, thus a 40 day window.
Gap filling
Missing flux intervals in the yearly record were filled differently depending up on the length of the data gap and whether the gap was biased towards certain meteorological conditions. All gaps in NEE shorter than 2 hours were filled using linear interpolation. Longer gaps that were not considered biased to certain meteorological conditions were filled using mean diurnal variation (Falge et al. 2001). We used 20 days of reliable data nearest the missing interval to fill the gap. Missing intervals due to window obstruction of the open-path IRGA were distributed unevenly over the day. Daytime gaps were biased towards cloudy conditions and to account for that these gaps in NEE were filled using a light-curve model based on this data set.
Applications
Analysis of eddy covariance observations provides information useful for identifying which physiological and physical processes play dominant roles in controlling CO2 exchange. In turn, this information contributes to the development and improvement of models of ecosystem- atmosphere CO2 exchange and to understanding which processes are particularly sensitive to future change.
4. Quality Assessment:
Missing values or data that were flagged as
unreliable either by an objective algorithm or subjective inspection
have been given a value of -999. It
is up to the end-user to fill these values if necessary. Separate
columns are
included for CO2 flux, storage, NEE, and GPP that indicate that the
value was measured/calculated, or filled. These columns can be used by
the end-user to substitute
their own filling strategy.
5. Data Acquisition Materials and Methods:
Flux measurements were made from a 67 m tall tower, additional measurements were made on two 2 m tripods installed on the forest floor. The data acquisition computer and closed-path gas analyzers were located in an air-conditioned hut 8 m south of the tower base. Data acquisition and control systems were automated and data were downloaded weekly. Five data loggers connected by a coaxial network collected the instrument data in two types of files: slow files with 30 min statistics and fast files with 4- or 0.5 Hz observations which was then stored on the data acquisition computer. The turbulent fluxes of sensible heat, latent heat, CO2, and momentum at 64 m were determined with the eddy covariance technique. The signals directly required for flux calculation were digitized and stored at 4 Hz. Wind and temperature were measured with a 3-axis sonic anemometer pointed due east (Campbell Scientific, Logan UT). Winds from the east predominate at 64 m, accounting for about 85% of day and night intervals.
The molar densities of CO2 and H2O at 64 m were measured with two independent InfraRed Gas Analyzers (IRGAs).
- The first measurement was made by drawing 20 to 24 standard liter min-1 (slpm) of air through a closed-path IRGA (LI-COR LI7000 or, before Dec. 2000, a LI 6262, Lincoln NE) in the instrument hut. Air was drawn through a coarse polyethylene screen inlet 50 cm above the sonic anemometer, down a 9.5-mm-inner-diameter 75-m-long Teflon PFA tube, and through a 1 micron pore 142 mm diameter Teflon filter. The sample tube was encased in an insulated heating bundle that maintained its entire length at 65oC (Unitherm 2256, Cape Coral FL) to prevent condensation and reduce water vapor exchange with the wall. The pressure in the IRGA cell was actively controlled at 85 kPa (MKS Instruments, Andover MA). The IRGA reference cell was flushed with 1 slpm of CO2 and H2O free air from a purge air generator (Matheson GEN PGW 28 LC, Montgomeryville, PA). The IRGA was calibrated daily at 2300 local time by sequentially sampling purge air, CO2 standard in air (+-1% Scott Marin, Riverside CA), CO2 free air (Scott Marin, Riverside CA), and room air drawn through a thermoelectrically cooled condensing column at 16o C (LI-COR LI610, Lincoln NE). The LI-7000 absorbances were recorded and the gains, zeros, instrument non-linearity, temperature, pressure and effects of water vapor accounted for in subsequent processing.
- An independent measurement of CO2 and H2O at 64 m was made with an open path IRGA (LI-COR LI7500, Lincoln NE) positioned 40-cm south of the sonic anemometer. The open path was calibrated by comparison with the simultaneous measurements made with the closed-path eddy covariance IRGA. The open path IRGA CO2 and H2O signals were corrected for the simultaneous fluctuations in air density using two approaches: applying the ideal gas law to the individual 4 Hz observations using the humidity-corrected sonic temperature, and applying the corrections to the 30-minute statistics.
The CO2 fluxes for both the open and closed path IRGAs were calculated as the 30-minute covariance of the vertical wind velocity (w) and the CO2 mixing ratio after subtracting the 30-minute mean (c'). The time lag for the closed path IRGA (typically 11 s) was determined by maximizing the correlation between w and c'. The fluxes were rotated to the plane with no mean vertical or cross wind.
A third IRGA (LI-COR LI7000 or, before Dec. 2000, a LI800, Lincoln NE) sequentially measured the molar densities of CO2 and H2O at 12 altitudes (0.1, 0.35, 0.7, 1.4, 3, 6, 10.7, 20, 35, 40, 50, 64 m above the ground) every 48 minutes. Four slpm of air was drawn through a 2 micron filter at each altitude, down 5.5-mm inner-diameter polyethylene lined tubing (Furon Dekabon 1300), through a solenoid manifold in an enclosure at the base of the tower (Parker General Valve, Fairfield NJ), into the equipment hut, and through the IRGA cell. The pressure in the IRGA cell was actively controlled at 83 kPa (MKS Instruments, Andover MA). The IRGA was calibrated for CO2 and water vapor daily by sequentially sampling purge air, CO2 standard in air (+-1% Scott Marin, Riverside CA), CO2 free air (Scott Marin, Riverside CA), and 16o C dew point air (LI-COR LI610, Lincoln NE).
Observations about the physical environment
were archived at 0.5 Hz and
all measurements were done at 64 m height unless otherwise noted.
Precipitation was
measured with a tipping bucket gauge (TE525: Texas Electronics Dallas).
Atmospheric
pressure was measured by the L17500. Incoming and reflected
photosynthetically
active photon flux density (PPFD) was measured with silicon quantum
sensors (Li-Cor
LI190). Net radiation was measured with a thermopile net radiometer
(REBS Q*7.1: REBS).
Incoming solar radiation was measured with a thermopile pyranometer
(model CM6: Kipp
and Xonene,
Delft, The Netherlands). Air temperatures at 64, 40, 10 and 2 m heights
were measured with ventilated thermistors (model 076B, Met One).
Horizontal wind
speeds at 64, 50, and 40 m height were measured with cup anemometers
(model 014; Met
One). Soil temperatures at 19 locations at depths of 0.02 to 0.25 m were
measured
with copper constantan thermocouples (Omega Engineering) and soil heat
flux at 2 cm
depths was measured with 5 flux plates (REBS HFT3.1). Soil moisture at
depths
between 0.1 and 2.5 m across 20 locations was measured with water
content reflectometers
(Campbell Scientific CS615). Litter moisture was measured using 6 fuel
moisture
probes position immediately above the forest floor.
Soil respiration was measured beginning in
August 2001 with 15
automated chambers (Goulden and Crill 1997) located in intact forest
approximately 50 m
east of the tower and 50 m from the nearest logging-created gap. These
chambers
were sampled sequentially at 12 min intervals and soil respiration
calculated from
the increase in chamber CO2 concentrations over the sampling period.
6. Data Access:
This data is available through the Oak Ridge National Laboratory (ORNL) Distributed Active Archive Center (DAAC).
Data Archive Center:
Contact for Data Center Access Information:
E-mail: uso@daac.ornl.gov
Telephone: +1 (865) 241-3952
7. References:
Goulden M.L, and P.M. Crill. 1997. Automated measurements of CO2 exchange at the moss surface of a black spruce forest. Tree Physiology 17: 537-542.
Miller, S.D., M..L Goulden, M.C. Menton, H.R. da Rocha, H.C. de Freitas, A.M.
Figueira and C.A.D. de Sousa. 2004. Biometric and micrometeorological
measurements of tropical forest carbon balance. Ecological Applications
14: S114-S126. doi:10.1890/02-6005
Chambers, J.Q., E.S. Tribuzy, L.C. Toledo, B.F. Crispim, N. Higuchi, J. dos Santos, A.C. Araujo, B. Kruijt, A.D. Nobre, and S.E. Trumbore. 2004. Respiration from a tropical forest ecosystem: partitioning sources and low carbon use efficiency. Ecological Applications 14: S72-S88. doi:10.1890/01-6012
Falge, E., et al. 2001. Gap filling
strategies for defensible annual sums of net ecosystem exchange.
Agricultural and Forest Meteorology 107:43–69. doi:10.1016/S0168-1923(00)00225-2
Martens C.S., Shay T.J., H.P. Mendlovitz, D.M.
Matross, S.R. Saleska, S.C. Wofsy, W.S. Woodward, M.C. Menton, J.M.S. De Moura, P.M.
Crill, O.L.L. De Moraes, and R.L. Lima. 2004. Radon fluxes in tropical
forest ecosystems of Brazilian Amazonia: night-time CO2 net ecosystem
exchange derived from radon and eddy covariance methods. Global Change
Biology 10: 618-629. doi:10.1111/j.1365-2486.2004.00764.x
Miller, S. D., M. L. Goulden, M. C. Menton, H. R. da Rocha, H. C. de Freitas, A. M. e Silva Figueira, and C. A. Dias de Sousa. 2004. Biometric and micrometeorological measurements of tropical forest carbon balance. Ecological Applications 14:S114–S126. doi:10.1890/02-6005
Saleska S.R., S.D. Miller, D.M. Matross, M.L.
Goulden, S.C. Wofsy, .HR. da Rocha, P.B. de Camargo, P. Crill, B.C. Daube, H.C. de
Freitas, L. Hutyra, M. Keller, V. Kirchhoff, M.. Menton, J.W. Munger, E.H. Pyle,
A.H. Rice, H. Silva . 2003. Carbon in amazon forests: Unexpected seasonal
fluxes and disturbance-induced losses. Science 302:1554-1557.
Related Publications
- Miller, S.D., M.L. Goulden, M.C. Menton, H.R. da Rocha, H.C. de Freitas, A.M.E.S. Figueira, and C.A.D. de Sousa. 2004. Biometric and micrometeorological measurements of tropical forest carbon balance. Ecological Applications 14(4):S114.
- Goulden, M.L., S.D. Miller, H.R. da Rocha, M.C. Menton, H.C. de Freitas, A.M.E.S. Figueira, and C.A.D. de Sousa. 2004. Diel and seasonal patterns of tropical forest CO2 exchange. Ecological Applications 14(4):S42-55.
- da Rocha, H.R., M.L. Goulden, S.D. Miller, M.C. Menton, L.D.V.O. Pinto, H.C. de Freitas, and A.M.E.S. Figueira. 2004. Seasonality of water and heat fluxes over a tropical forest in eastern Amazonia. Ecological Applications 14(4):S22-32.
- Doughty, C.E., M.L. Goulden, S.D. Miller, and H.R. da Rocha. 2006. Circadian rhythms constrain leaf and canopy gas exchange in an Amazonian forest. Geophysical Research Letters 33(15): L15404, doi:10.1029/2006GG026750.
- Goulden, M.L., S.D. Miller, and H.R. da Rocha. 2006. Nocturnal cold air drainage and pooling in a tropical forest. Journal of Geophysical Research-Atmospheres 111(D8):D08S04, doi: 10.1029/2005JD006037.
- Bruno, R.D., H.R. da Rocha, H.C. de Freitas, M.L. Goulden, and S.D. Miller. 2006. Soil moisture dynamics in an eastern Amazonian tropical forest. Hydrological Processes 20(12):2477-2489.
- Miller, S.D., M.L. Goulden, and H.R. da Rocha. 2007. The effect of canopy gaps on subcanopy ventilation and scalar fluxes in a tropical forest. Agricultural and Forest Meteorology 142(1):25-34.