Get Data
Summary
This data set provides Synthetic Aperture Radar (SAR) images for 42 selected sites from various terrestrial ecology and meteorological monitoring networks including FLUXNET, Ameriflux, Long Term Ecological Research (LTER), and the Greenland Climate Network (GC-Net).
The data set contains at least one image for all 42 sites, and six sites have multiple images. See Table 1 for the sites and the temporal range of the available images. The scenes are in GeoTIFF format in Universal Transverse Mercator (UTM), WGS-84 projection, and 15-meter resolution.
The SAR images are subset scenes of approximately 60 km x 70 km that include an established site in one of the monitoring networks. The spatial resolution of all scenes is 15 meters. These scenes are distributed as GeoTIFF files with appropriate projection information defined within the file. The acquisition mode for all data is the Fine Beam Double Polarization or FBD with the HH/HV polarization. The HH and HV channels are distributed as 3 channels to allow for an intuitive image display. The HH band is displayed in the red and blue channels and the HV band is displayed in the green channel. For some images only single polarization is available; these images are distributed as grayscale images.
The source of the data is the PALSAR (Phased Array type L-band Synthetic Aperture Radar) sensor flying on the Advanced Land Observing Satellite (ALOS). The PALSAR data are in dual Polarization, HH+HV, mode. Bands HH (red and blue) and Band-HV (green) can be used to visualize land use patterns. The resulting images show vegetation in shades of green and barren land in shades of pink or purple.
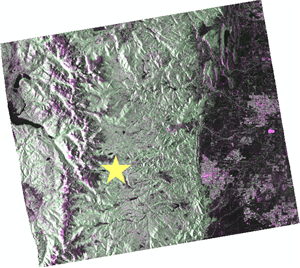
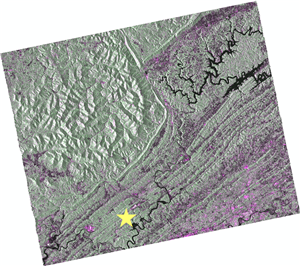
Figure 1. SAR images for (a) Niwot Ridge, Colorado and (b) Walker Branch Watershed, Tennessee sites. Visualizations for land use are generally set such that green is tree canopy, pink is crop or barren soil, black is water, and grays are low vegetation. The star icon indicates the location of the field site.
The data can be used for a number of purposes (1) to validate the SAR measurements using FLUX tower site characterization data; (2) to examine the impacts of vegetation dynamics on climate; (3) to understand human impacts on vegetation at a local scale; (3) to detect deforestation and forest degradation; (4) to map and differentiate growth stages and change; (5) to retrieve woody biomass and structural attributes; and (6) to characterize, map and monitor ecoregions such as mangroves and wetlands.
Support Acknowledgment
The National Aeronautics and Space Administration (NASA) funded this EOSDIS Tech Infusion project (2010) as a collaboration between the Alaska Satellite Facility (ASF), the National Snow and Ice Data Center (NSIDC), and the Oak Ridge National Laboratory Distributed Active Archive Center (ORNL DAAC) in 2010. The purpose of the project was to provide subsets of PALSAR data for selected field sites, such as flux tower locations, to increase terrestrial ecology users’ understanding of SAR, to make the community more aware of SAR data, and to promote its overall use.
This project produced many scenes of SAR satellite imagery for use by terrestrial ecologists in their geo-spatial investigations. The PALSAR subsets are provided in non-proprietary, unrestricted, and user friendly GeoTIFF file format and are now publicly available at the ORNL DAAC Web site.
Data and Documentation Access:
Description and Links to Companion Files and Supplemental Information:
SAR Documentation:
Alaska Satellite Facility, SAR Data Center (http://www.asf.alaska.edu/program/sdc)
Alaska Satellite Facility, SAR Data Center, PALSAR Summary (http://www.asf.alaska.edu/program/sdc/sensors#palsar)
Japan Aerospace Exploration Agency (JAXA), Advanced Land Observing Satellite "DAICHI" (ALOS) Site
(http://www.jaxa.jp/projects/sat/alos/index_e.html)
ORNL DAAC Spatial Data Access Tool (SDAT) link: http://webmap.ornl.gov/wcsdown/dataset.jsp?ds_id=993
Get Data: http://daac.ornl.gov/cgi-bin/dsviewer.pl?ds_id=993
Citation:
Cite this data set as follows:
Oak Ridge National Laboratory Distributed Active Archive Center, Alaska Satellite Facility Distributed Active Archive Center, and Japan Aerospace Exploration Agency. 2011. SAR Subsets for Selected Field Sites, 2007-2010. Data set. Available on-line [http://daac.ornl.gov] from ORNL DAAC, Oak Ridge, Tennessee, U.S.A. doi:10.3334/ORNLDAAC/993
Copyright 2010 Alaska Satellite Facility derived from data copyright JAXA/METI
Table of Contents
1 Data Set Overview
2 Data Description
3 Applications and Derivation
4 Quality Assessment
5 Acquisition Materials and Methods
6 Data Archive Access
7 References
1. Data Set Overview:
This data set provides Synthetic Aperture Radar (SAR) images for 42 selected sites from various terrestrial ecology and meteorological monitoring networks including FLUXNET, Ameriflux, Long Term Ecological Research (LTER), and the Greenland Climate Network (GC-Net).
The data set contains at least one image for all 42 sites, and six sites have multiple images. See Table 1 for the sites and the temporal range of the available images. The scenes are in GeoTIFF format in Universal Transverse Mercator (UTM), WGS-84 projection, and 15-meter resolution.
The SAR images are subset scenes of approximately 60 km x 70 km that include an established site in one of the monitoring networks. The spatial resolution of all scenes is 15 meters. These scenes are distributed as GeoTIFF files with appropriate projection information defined within the file. The acquisition mode for all data is the Fine Beam Double Polarization or FBD with the HH/HV polarization. The HH and HV channels are distributed as 3 channels to allow for an intuitive image display. The HH band is displayed in the red and blue channels and the HV band is displayed in the green channel. For some images only single polarization is available. These images are distributed as grayscale images.
The source of the data is the PALSAR (Phased Array type L-band Synthetic Aperture Radar) sensor flying on the Advanced Land Observing Satellite (ALOS). The PALSAR data are in dual Polarization, HH+HV, mode. Bands HH (red and blue) and Band-HV (green) can be used to visualize land use patterns. The resulting images show vegetation in shades of green and barren land in shades of pink or purple.
The data can be used for a number of purposes (1) to validate the SAR measurements using FLUX tower site characterization data; (2) to examine the impacts of vegetation dynamics on climate; (3) to understand human impacts on vegetation at a local scale; (3) to detect deforestation and forest degradation; (4) to map and differentiate growth stages and change; (5) to retrieve woody biomass and structural attributes; and (6) to characterize, map and monitor ecoregions such as mangroves and wetlands.
2. Data Description
This data set provides Synthetic Aperture Radar (SAR) images for 42 selected sites from various monitoring networks including FLUXNET, Ameriflux, LTER, and the Greenland Climate Network (GC-Net).
There is at least one image for all 42 sites, and six sites have multiple images. See Table 2 for the sites and the temporal range of the available images. The scenes are in GeoTIFF format in Universal Transverse Mercator (UTM) projection and 15-meter resolution.
Spatial Coverage
Sites: Selected field sites, such as carbon and heat flux tower locations, to increase terrestrial ecologist's understanding of SAR and to promote its use.
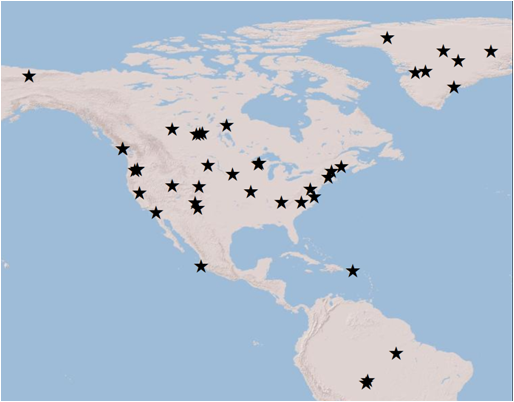
Figure 2. Locations of sites with SAR images.
Table 1. Selected environmental network sites and physical attributes.
| Site Name | Land_unit | Latitude | Longitude | Site Type | Vegtype_igbpclss |
|---|---|---|---|---|---|
| Arctic LTER (ARC1) | North America | 68.62833 | -149.593331 | LTER Site | Open shrublands |
| Baltimore Ecosystem Study (BES1) | North America | 39.400281 | -76.7702806 | LTER Site | Urban and built-up |
| Bartlett Experimental Forest | North America | 44.06464 | -71.2880769 | Flux Tower |
Deciduous broad-leaf forest |
| BOREAS NSA - Old Black Spruce | North America | 55.87962 | -98.48081 | Flux Tower |
Evergreen needle-leaf forest |
| BOREAS SSA Young Aspen | North America | 53.65601 | -105.32314 | Flux Tower | Mixed forest |
| British Columbia- Campbell River - Clearcut Site | North America | 49.87048 | -125.29087 | Flux Tower | Evergreen needle-leaf forest |
| British Columbia- Campbell River - Mature Forest Site | North America | 49.86725 | -125.3336 | Flux Tower | Evergreen needle-leaf forest |
| Buffalo13 ESE- SDSU Antelope Research Station (Calving Pasture Site) | North America | 45.516 | -103.3017 | Climate reference network station | Grasslands |
| Cascades/H.J. Andrews LTER- Oregon | North America | 44.24885 | -122.180347 | Evergreen needle-leaf forest | |
| Chamela Biological Station | North America | 19.509281 | -105.040175 | Flux Tower | Deciduous broad-leaf forest |
| CP1 | Europe | 69.8819 | -46.9736 | GC-Net** | |
| Duke Forest Hardwoods | North America | 35.973582 | -79.1004304 | Flux Tower | Mixed forest |
| Harvard Forest EMS Tower(HFR1) | North America | 42.537756 | -72.1714778 | Flux Tower | Mixed forest |
| HJ Andrews Aeronet Sunphotometer (AND1) | North America | 44.238889 | -122.223889 | LTER Site | Evergreen needle- leaf forest |
| Howland Forest (Main Tower) | North America | 45.20407 | -68.7402778 | Flux Tower | Mixed forest |
| Humboldt Gl. | Europe | 78.5266 | -56.8305 | GC-Net | |
| Juniper Woodland Site | North America | 40.259322 | -112.478125 | Flux Tower | Grassland |
| KULU | Europe | 65.7584 | -39.6018 | GC-Net | |
| Lost Creek | North America | 46.08268 | -89.97919 | Flux Tower | Deciduous broad-leaf forest |
| Luquillo LTER (LUQ1) | North America | 18.323889 | -65.8175 | LTER Site | Evergreen broadleaf forest |
| Metolius Eyerly Burn | North America | 44.579442 | -121.500076 | Flux Tower | Evergreen needle-leaf forest |
| Metolius Intermediate Pine | North America | 44.452432 | -121.557166 | Flux Tower | Evergreen needle-leaf forest |
| Missouri Ozark Site | North America | 38.74411 | -92.200009 | Flux Tower |
Deciduous broad-leaf forest |
| NASA-E | Europe | 75 | -29.9997 | GC-Net | |
| NGRIP | Europe | 75.0998 | -42.3326 | GC-Net | |
| Niwot Ridge (LTER NWT1) | North America | 40.032878 | -105.546403 | Flux Tower | Evergreen needle-leaf forest |
| Park Falls | North America | 45.945878 | -90.2723042 | Flux Tower | Deciduous broad-leaf forest |
| Phillips Creek Marsh (PHCK) | North America | 37.46069 | -75.8347115 | LTER Site | Woody Savannas |
| Rond.- Faz. Nossa Senhora-Ji Parana-pasture | South America | -10.76181 | -62.3572222 | Flux Tower | Savannas |
| Rond.- Rebio Jaru Ji Parana- Tower B | South America | -10.07806 | -61.9330972 | Flux Tower | Evergreen broad-leaf forest |
| Santarem-Km77-Pasture | South America | -3.011896 | -54.53652 | Flux Tower | Cropland/natural vegetation mosaic |
| Sask - SSA Old Aspen | North America | 53.62889 | -106.19779 | Flux Tower | Mixed forest |
| Sask- SSA Old Jack Pine | North America | 53.91634 | -104.69203 | Flux Tower | Evergreen needle-leaf forest |
| Sioux Falls Portable | North America | 43.2408 | -96.902 | Croplands | |
| Sky Oaks | North America | 33.384444 | -116.640261 | Flux Tower | Closed shrublands |
| Summit | Europe | 72.5794 | -38.5042 | GC-Net | |
| Swiss Camp | Europe | 69.5732 | -49.5952 | GC-Net | |
| Tablelands Juniper Savanna | North America | 34.425489 | -105.861545 | Open shrublands | |
| Tonzi Ranch | North America | 38.4316 | -120.965983 | Flux Tower | Woody savannas |
| Valles Caldera Mixed Conifer | North America | 35.888447 | -106.532114 | Woody savannas | |
| Walker Branch Watershed | North America | 35.958767 | -84.2874333 | Flux Tower | Deciduous broad-leaf forest |
| Western Peatland- LaBiche-Black Spruce/Larch Fen | North America | 54.95384 | -112.46698 | Flux Tower | Mixed forest |
** Greenland Climate Network (GC-Net) (http://cires.colorado.edu/science/groups/steffen/gcnet/)
Collection boundaries: (All latitude and longitude given in decimal degrees)
| Westernmost Longitude | Easternmost Longitude | Northernmost Latitude | Southernmost Latitude |
|---|---|---|---|
| -156.6650 | -29.9997 | 78.5266 | -10.7618 |
Site Information
The purpose of the project was to provide subsets of PALSAR data for selected field sites from established monitoring networks for carbon and heat flux (AmeriFlux Tower locations), long-term ecological monitoring sites (LTER), Greenland Climate Network (GC-Net), and EOS Land Validation Sites to increase terrestrial ecology users’ understanding of SAR data and promote its use. The PALSAR subsets are provided in non-proprietary, unrestricted, and user friendly GeoTIFF file format.
Spatial Resolution
The SAR images are subset scenes of approximately 60 km x 70 km that includes an established site in one of the monitoring networks. The spatial resolution of all scenes is 15 meters.
Temporal Coverage
Temporal Resolution
SAR subsets were extracted for the dates shown in Table 2. The exact time of the image is included in the documentation.
Table 2. The selected sites, the name of their respective compressed image files, the date(s), and projections of the SAR subset image(s) provided.
| Site Name | Image and Documentation Filename (compressed) | Image Date(s) | Image Projection |
|---|---|---|---|
| Arctic LTER (ARC1) | Arctic_LTER.zip | 2010/07/11 | WGS84, UTM, Zone 6N |
| Baltimore Ecosystem Study (BES1) | Baltimore_Ecosystem_Study.zip | 2009/07/28 | WGS84, UTM, Zone 18N |
| Bartlett Experimental Forest | Bartlett_Experimental_Forest.zip | 2007/07/20 2007/09/04 2007/10/20 2008/06/06 2009/07/25 2009/10/25 2010/07/28 2010/09/12 2010/10/28 |
WGS84, UTM, Zone 19N |
| BOREAS NSA - Old Black Spruce | BOREAS_NSA_Old_Black_Spruce.zip | 2010/09/24 | WGS84, UTM, Zone 14N |
| BOREAS SSA Young Aspen | BOREAS_SSA_Young_Aspen.zip | 2010/07/19 | WGS84, UTM, Zone 13N |
| British Columbia-Campbell River - Clearcut Site | British_Columbia_Campbell_River_Clearcut_Site.zip | 2010/06/05 | WGS84, UTM, Zone 10N |
| British Columbia- Campbell River - Mature Forest Site | British_Columbia_Campbell_River_Mature_Forest_Site.zip | 2010/06/05 | WGS84, UTM, Zone 10N |
| Buffalo 13 ESE- SDSU Antelope Research Station (Calving Pasture Site) | Buffalo_13_ESE_SDSU_Antelope_Research_Station.zip | 2010/10/02 | WGS84, UTM, Zone 13N |
| Cascades/H.J. Andrews LTER- Oregon | Cascades_H_J__Andrews_LTER_Oregon.zip | 2008/10/25 | WGS84, UTM, Zone 10N |
| Chamela Biological Station | Chamela_Biological_Station.zip | 2010/10/10 | WGS84, UTM, Zone 13N |
| CP1 | CP1.zip | 2009/11/10 | WGS84, UTM, Zone 23N |
| Duke Forest Hardwoods | Duke_Forest_Hardwoods.zip | 2010/09/25 | WGS84, UTM, Zone 17N |
| Harvard Forest EMS Tower(HFR1) | Harvard_Forest_EMS_Tower.zip | 2007/08/23 2010/08/31 2010/10/16 | WGS84, UTM, Zone 18N |
| HJ Andrews Aeronet Sunphotometer (AND1) | HJ_Andrews_Aeronet_Sunphotometer.zip | 2010/10/25 | WGS84, UTM, Zone 10N |
| Howland Forest (Main Tower) | Howland_Forest.zip | 2010/10/18 | WGS84, UTM, Zone 19N |
| Humboldt Gl. | Humboldt_Gl.zip | 2010/06/29 | WGS84, UTM, Zone 21N |
| Juniper Woodland Site | Juniper_Woodland_Site.zip | 2010/07/20 | WGS84, UTM, Zone 12N |
| KULU | KULU.zip | 2008/05/21 2008/07/06 2008/08/21 |
WGS84, UTM, Zone 24N |
| Lost Creek | Lost_Creek.zip | 2010/10/08 | WGS84, UTM, Zone 15N |
| Luquillo LTER (LUQ1) | Luquillo_LTER.zip | 2010/10/11 | WGS84, UTM, Zone 20N |
| Metolius Eyerly Burn | Metolius_Eyerly_Burn.zip | 2010/06/29 | WGS84, UTM, Zone 10N |
| Metolius Intermediate Pine | Metolius_Intermediate_Pine.zip | 2010/06/29 | WGS84, UTM, Zone 10N |
| Missouri Ozark Site | Missouri_Ozark_Site.zip | 2010/08/04 | WGS84, UTM, Zone 15N |
| NASA-E | NASA_E.zip | 2009/12/23 | WGS84, UTM, Zone 25N |
| NGRIP | NGRIP.zip | 2010/06/29 | WGS84, UTM, Zone 23N |
| Niwot Ridge (LTER NWT1) | Niwot_Ridge.zip | 2007/06/05 2007/07/21 2007/10/21 2008/06/07 2009/07/26 2010/06/13 2010/07/29 2010/10/29 2010/12/14 | WGS84, UTM, Zone 13N |
| Park Falls | Park_Falls.zip | 2010/10/08 | WGS84, UTM, Zone 15N |
| Phillips Creek Marsh (PHCK) | Phillips_Creek_Marsh.zip | 2010/10/31 | WGS84, UTM, Zone 18N |
| Rond.- Faz. Nossa Senhora-Ji Parana-pasture | Rond_Faz_Nossa_Senhora_Ji_Parana_pasture.zip | 2010/10/21 | WGS84, UTM, Zone 20S |
| Rond.- Rebio Jaru Ji Parana- TowerB | Rond_Rebio_Jaru_Ji_Parana_Tower .zip | 2010/07/17 | WGS84, UTM, Zone 20S |
| Santarem-Km77-Pasture | Santarem_Km77-Pasture.zip | 2007/06/12 2008/05/30 2009/06/18 2009/08/03 2010/06/21 2010/07/21 2010/08/06 2010/11/06 | WGS84, UTM, Zone 21S |
| Sask- SSA Old Aspen | Sask_SSA_Old_Aspen.zip | 2010/11/05 | WGS84, UTM, Zone 13N |
| Sask- SSA Old Jack Pine | Sask_SSA_Old_Jack_Pine.zip | 2010/10/31 | WGS84, UTM, Zone 13N |
| Sioux Falls Portable | Sioux_Falls_Portable.zip | 2010/03/20 2010/06/29 2010/07/16 2010/08/31 2010/10/16 2010/12/01 | WGS84, UTM, Zone 14N |
| Sky Oaks | Sky_Oaks.zip | 2009/11/18 | WGS84, UTM, Zone 11N |
| Summit | Summit.zip | 2010/01/23 | WGS84, UTM, Zone 24N |
| Swiss Camp | Swiss_Camp.zip | 2010/01/05 | WGS84, UTM, Zone 22N |
| Tablelands Juniper Savanna | Tablelands_Juniper_Savanna.zip | 2010/09/18 | WGS84, UTM, Zone 13N |
| Tonzi Ranch | Tonzi_Ranch.zip | 2010/09/17 | WGS84, UTM, Zone 10N |
| Valles Caldera Mixed Conifer | Valles_Caldera_Mixed_Conifer.zip | 2010/10/05 | WGS84, UTM, Zone 13N |
| Walker Branch Watershed | Walker_Branch_Watershed.zip | 2010/10/27 | WGS84, UTM, Zone 16N |
| Western Peatland- LaBiche-Black Spruce/Larch Fen | Western_Peatland_LaBiche_Black_Spruce.zip | 2010/09/23 | WGS84, UTM, Zone 12N |
Data File Information
As show in Table 2, each site has a single compressed data file. Within the *.zip file is the GeoTIFF image file(s) with the image date appended to the file name. A *.pdf documentation file is also included and contains image-specific metadata, image analysts notes about channel assignments and colors, and a thumbnail of the SAR image as show in Figure 1. For sites with multiple images, only one thumbnail is included as images are quite similar in appearance.
Example Documentation File:
|
Site Name:Baltimore Ecosystem Study (BES1) GeoTIFF: Baltimore_Ecosystem_Study_20090728.tif Imagery Date: 28-Jul-2009, 03:32:51 Location: Maryland The SAR image has greens, pinks, blacks and some gray colors. By assigning the HH to the red and blue channels and the HV polarization to the green, we get these slightly more intuitive colors. Green is tree canopy. Black is water. Polarization: FBD 34.3 HH+HV Bands: HH (red & blue) Bands: HV (green) |
3. Data Application and Derivation:
PALSAR Terrestrial Biophysical Applications
The data can be used for a number of purposes (1) to validate the SAR measurements using FLUX tower site characterization data; (2) to examine the impacts of vegetation dynamics on climate; (3) to understand human impacts on vegetation at a local scale; (3) to detect deforestation and forest degradation; (4) to map and differentiate growth stages and change; (5) to retrieve woody biomass and structural attributes; and (6) to characterize, map and monitor ecoregions such as mangroves and wetlands.
Satellite radar can be important to Earth system monitoring because the properties of the signal return are better suited for certain vegetative biophysical estimates and are more accurate or not otherwise obtainable by passive remote sensing systems. A number of studies have shown a significant relationship between L-Band SAR backscatter coefficients and forest structure parameters including above ground biomass and vegetative structural attributes. Other examples of terrestrial applications include wetland characterization, mapping, and monitoring and forest change analysis
The PALSAR subsets provided in this data set might be useful for visual interest and preliminary analysis of the field area. For in-depth analyses, such as biomass estimation, vegetation characterization, etc., users might have to download the lower level products from ASF.
Quantitatively Comparing Multi-Temporal Data
The data values in the image are Digital Numbers (DN) that can be used in the following equation to extract the Normalized Radar Cross Section (NRCS).
NRCS (dB) = 10*log10(<DN^2>) + CF
Where the Calibration Factor (CF) is a constant -83.
The cross section parameter is useful to quantitatively compare multi-temporal data.
4. Quality Assessment:
Because Radar emits its own signal, imaging can occur anytime of the day or night independent of sun angle. This is in contrast to passive imaging systems that require the Sun’s illumination. Due to its longer wavelength than visible light, the microwaves used in Radar also have the advantage of not being impeded by cloud cover or other atmospheric contamination.
5. Data Acquisition Materials and Methods:
Imagery from synthetic aperture radar (SAR) satellites is not a familiar data set for most users of geographic information systems (GIS). There are several reasons why radar imagery is not commonly used, primarily because of the nature of the technology and its specialized applications. Another is that radar imagery is not optical, requiring more technical processing and specialized image interpretation skills.
Overview
The SAR satellite used to create these images is the Advanced Land Observing Satellite (ALOS). ASF is a downlink and archive for ALOS in the Americas. The SAR sensor is an L-Band phased array radar capable of imaging in several resolutions and polarizations. Because radar data is ranging data that measures the strength and scatter of the radar pulse, it is not like optical imagery which is visually intuitive. To make the SAR scenes more user friendly, the polarization data was classified as reds, greens, and blues in the image. Another aspect of radar remote sensing is that the ranging data must be terrain-corrected by a process that assigns the ranging values to geographic coordinates by utilizing a digital surface model (DSM). High resolution DSM data are not available for the entire planet and existing data at high latitudes is problematic, especially in areas of very little terrain relief, such as sheet glaciers. To use a consistent DSM for this project and all of the sites being investigated, the DSM data from the ASTER satellite was used for the terrain correction.
ALOS PALSAR
Launched on January 24th, 2006 aboard the Advanced Land Observing Satellite (ALOS), the Phased Array Type L-band Synthetic Aperture Radar (PALSAR) instrument has promising applications for natural resource and land applications including parameters applicable to terrestrial nutrient cycle estimates. Research has shown that SAR data by itself, or combined with other optical or active systems, can enhance land characterization with information not otherwise available from passive remote systems. Because Radar emits its own signal, imaging can occur anytime of the day or night independent of sun angle. This is in contrast to passive imaging systems that require the Sun’s illumination. Due to its longer wavelength than visible light, the microwaves used in Radar also have the advantage of not being impeded by cloud cover or other atmospheric contamination. Some examples of PALSAR land applications include estimates and mapping of vegetation above ground biomass, deforestation mapping, wetland (including high latitude) characterization, and cropland monitoring.
Radar Imaging Basics
The PALSAR instrument is a type of Synthetic Aperture Radar (SAR) that emits energy in the long wavelength L-Band (1270 MHz) frequency. SAR radar systems are able to generate high-resolution imagery with a synthetic aperture (or virtual long antenna) by combining signals received by the physically short (real) antenna as it moves along its flight track.
As an imaging radar system moves along a flight path it emits and receives pulses in a single particular microwave wavelength and orientation (waves polarized in a single vertical (V) or horizontal (H) plane). The radar pulse interacts with the Earth’s surface and is scattered in all directions, with some energy reflected back toward the radar’s antenna. Known as backscatter, the returned signal is received by the antenna a fraction of a second later and in a specific polarization (H or V). The brightness, or amplitude, of the backscatter is measured and recorded and the data are used to derive an image. Radar waves interact differently with soil, vegetation, water, ice, and man-made objects such as buildings and roads because the backscatter is affected by the surface properties of objects. For a smooth surface such as water or a road, most of the incident energy is reflected away from the radar system resulting in a very low return signal. In contrast, rough surfaces will scatter the emitted energy in all directions and return a significant portion back to the antenna. In general, vegetation is usually moderately rough with most radar wavelengths.
6. Data Archive Access:
This data set is available through the Oak Ridge National Laboratory (ORNL) Distributed Active Archive Center (DAAC).
Data Archive:
Web Site: http://daac.ornl.gov
Contact for Data Center
E-mail: uso@daac.ornl.gov
Telephone: +1 (865) 241-3952
7. References:
Shimada, M.; Isoguchi, O.; Tadono, T.; Isono, K.; , "PALSAR Radiometric and Geometric Calibration," Geoscience and Remote Sensing, IEEE Transactions on , vol.47, no.12, pp.3915-3932, Dec. 2009 doi: 10.1109/TGRS.2009.2023909