Get Data
Summary:
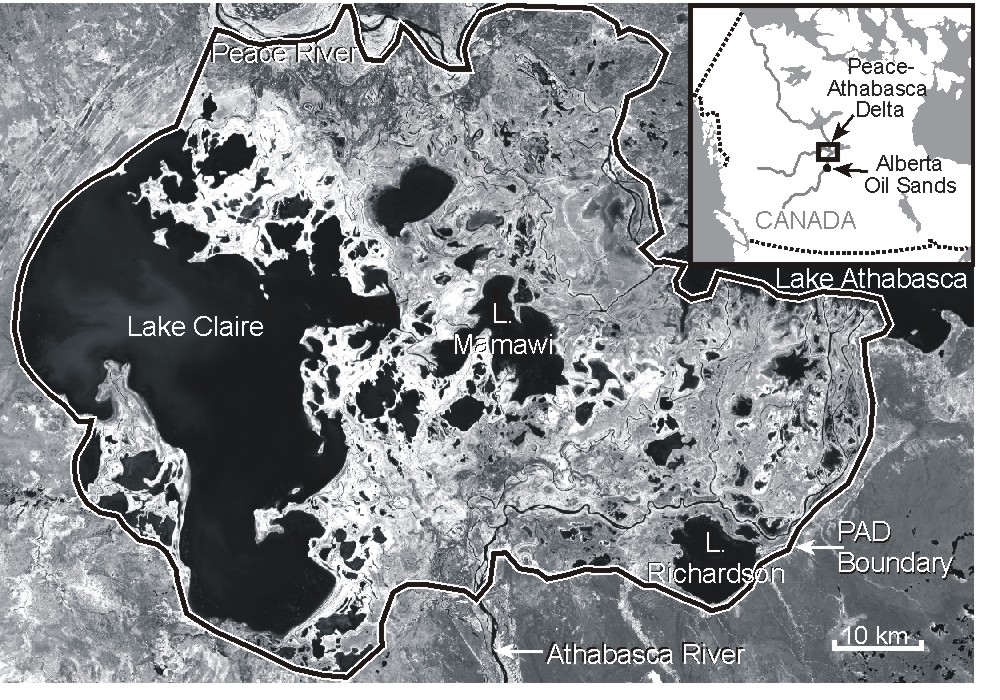
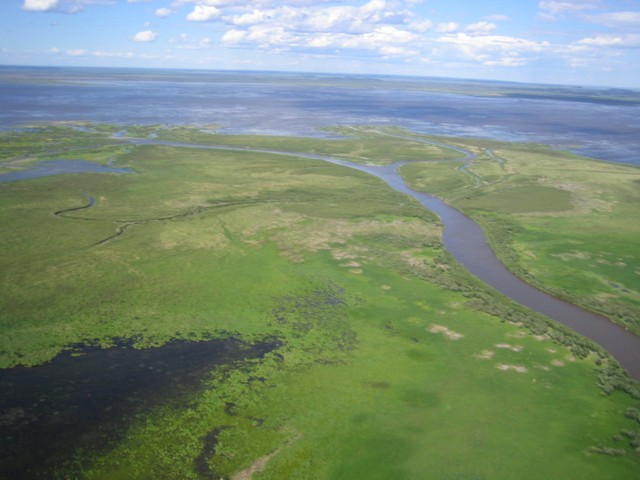
The Peace-Athabasca Delta (PAD) is a
large boreal wetland located in northeastern Alberta, Canada at the
confluence of the Peace and Athabasca Rivers with Lake Athabasca
(Figures 1 and 2). A Ramsar Convention wetland and UNESCO World
Heritage Site, it is among the world's most ecologically significant
wetlands. This data set contains four comma-delimited ASCII files,
two of which contain water surface elevation site and measurement information
and two contain water quality and ancillary parameter location and measurement
data for 120 sites within the PAD.
Data archived include water surface
elevation and water quality parameters measured at points throughout
the Delta during summers 2006 and 2007. These data sets were originally
collected to improve understanding of hydrologic recharge processes in
low-relief environments and to provide ground-based measurements to
validate satellite observations of inundation and sediment transport.
Figures 1 and 2. The Peace-Athabasca Delta
(PAD) is a large boreal wetland located in
northeastern Alberta, Canada at the confluence of the Peace and
Athabasca Rivers with Lake Athabasca.
Cite this data set as follows:
Pavelsky, T.M., and L.C. Smith. 2009.
Surface Water Elevation and Quality, Peace-Athabasca Delta, Canada,
2006-2007. Data set. Available on-line [http://daac.ornl.gov] from Oak
Ridge National Laboratory Distributed Active Archive Center, Oak Ridge,
Tennessee, U.S.A. doi:10.3334/ORNLDAAC/935 The investigators were Pavelsky, T.M. and
Smith, L.C. The Peace -Athabasca Delta (PAD) is a large
boreal wetland located in northeastern Alberta, Canada at the
confluence of the Peace and Athabasca Rivers with Lake Athabasca
(Figures 1 and 2). A Ramsar Convention wetland and UNESCO World
Heritage Site, it is among the world's most ecologically significant
wetlands. Data archived here include water surface elevation and water
quality parameters measured at points throughout the Delta during
summers 2006 and 2007. These data sets were originally collected to
improve understanding of hydrologic recharge processes in low-relief
environments and to provide ground-based measurements to validate
satellite observations of inundation and sediment transport. All work was supported by
the NASA Terrestrial Hydrology Program under grant
NNG06GE05G to the Department of Geography, University of California-Los
Angeles, Los Angeles, California.
More information about
the Peace-Athabasca Delta, Alberta, Canada - Ramsar Site is
included as a companion file
Environment_Canada_PAD_Ramsar_Site.pdf. Water Surface
Elevation Site and Measurement Data River
and lake water surface elevations were measured at 9 locations within
the PAD in 2006 and 12 in 2007.
Measurement sites and
frequencies are reported in pad_stage_locations_0607.csv,
described below.
Data File Description: Example
Data Records, pad_stage_locations_0607.csv Missing values, -999, denote that no measurements were
made at that location in 2006.
Data File Description,
pad_stage_0607.csv Please note that each data column contains
the water surface elevation measurements for a given location. Rows
show the date and time of the measurement across locations. Example Data Records,
pad_stage_0607.csv Please note the three (3) header records "Sites, Latitude, Longitude".
"Sites" gives the full name of a measurement location that corresponds
to an abbreviated form used as a column heading for the water surface
elevation for that location. "Latitude" and "Longitude"
contain the coordinates for the respective location. Water Quality Measurement Data River
and lake water were
sampled at 120 locations within the PAD
and analyzed for selected
water quality and ancillary
parameters. Locations are
identified in pad_water_quality_locations_0607.csv
Data File Description: Example Data Records,
pad_water_quality_locations_0607.csv Results of water quality analyses are reported in pad_water_quality_0607.csv Data File Description: Example Data Records,
pad_water_quality_0607.csv Site boundaries: (All latitude and longitude given in decimal degrees)
Data Citation:
Table of Contents:
1. Data Set Overview:
2. Data Characteristics:
Location
Measurements collected in 2006
Measurements collected in 2007
Logger Location
Athabasca R. at Pine Cr.
X
Logger located in mouth of small creek approximately 50m upstream of the Athabasca River.
Blanche L.
X
X
Logger located near W. edge of ~ 7 sq. km lake, approximately 200m from the lake outlet. Note that the lake outlet stream is sometimes impacted by beaver dams but is usually connected to the Richardson River.
Galoot Cr.
X
X
Logger located on small creek approximately 300m away from the Embarras River.
Garouche Cr.
X
X
Logger located on small channel connecting the Chenal des Quatre Fourches and Lake Athabasca.
Grey Wavy L.
X
Logger located near outlet stream of ~25 sq. km lake. Note that the outlet stream is sometimes impacted by beaver dams.
Grey Wavy Channel
X
X
Logger located on small channel downstream from Grey Wavy L.
Athabasca R. at Richardson R.
X
X
Logger located ~ 200m upstream of the Athabasca River on the Richardson River.
Limon L.
X
X
Logger located near outlet of ~6 sq. km lake permanently connected to the Athabasca River via the Richardson River.
Long Portage L.
X
X
Located near outlet of small (~3 sq. km) lake attached to Mamawi Cr. except during extreme low water.
Mamawi Cr
X
X
Located downstream of outlet from Long Portage L. on Mamawi Cr., a major distributary of the Athabasca R.
PAD 42 L.
X
Unnamed small lake (~2 sq. km) located near Grey Wavy Lake. Only connected to the open channel system during periods of high water.
L. Claire
X
X
Located near eastern edge of L. Claire, a very large (~1300 sq km) lake permanently connected to the open channel system.
Column Heading
Description
Location
Measurement location
Latitude
Decimal degrees, WGS 84
Longitude
Decimal degrees, WGS 84
2006_Start_day
Julian Day measurement began in 2006
2006_End_Day
Julian Day measurement ended in 2006
Observations_2006
Number of observations in 2006
2007_Start_Dat
Julian Day measurements began in 2007
2007_End_Day
Julian Day measurements ended in 2007
Observations_2007
Number of observations in 2007
Location,Latitude,Longitude,2006_Start_Day,2006_End_Day,Observations_2006,2007_Start_Day,2007_End_Day,Observations_2007
Measurement location,Decimal degrees,Decimal degrees,Julian Day
measurements began in 2006,Julian Day measurements ended in 2006,Number
of observations in 2006,Julian Day measurements began in 2007,Julian
Day measurements ended in 2007,Number of observations in 2007
Athabasca R. at Pine Cr.,58.3534,-111.5439,-999,-999,-999,153,251,9390
Blanche L.,58.39158,-111.2975,154,255,9687,153,251,9418
Galoot Cr.,58.60531667,-111.1061667,161,255,8988,150,253,9903
...
Mamawi Cr.,58.56815,-111.49885,161,255,9015,153,251,9399
PAD42 L.,58.55633,-111.17075,-999,-999,-999,160,253,8937
L. Claire,58.64536,-111.7078,159,255,9239,157,250,8930
All water surface
elevation data are reported in the data file, pad_stage_0607.csv,
described below.
Column Name Description
Year YYYY Day of Year
Julian Day of Year
Date YYYYMMDD
Time_local Local Time(GMT-7)
AR_PC_elev Water Surface Elevation (m)
BL_elev
Water Surface Elevation (m) GC_elev Water Surface Elevation (m)
Gar_C_elev Water Surface Elevation (m)
GWL_elev
Water Surface
Elevation (m)
GWC_elev
Water Surface
Elevation (m)
AR_RR_elev
Water Surface
Elevation (m)
LL_elev
Water Surface
Elevation (m)
LPL_elev
Water Surface
Elevation (m)
MC_elev
Water Surface
Elevation (m)
PAD42_L_elev
Water Surface
Elevation (m)
LC_elev
Water Surface
Elevation (m)
pad_stage_0607.csv,,,,,,,,,,,,,,,
"Measurements of River and Lake Water Surface Elevation at locations in
the Peace-Athabasca Delta (PAD), 2006-2007",,,,,,,,,,,,,,,
"Collected by Tamlin M. Pavelsky and Laurence C. Smith with assistance
from Richard Carlos, Birch Pavelsky, and Robert
Grandjambe",,,,,,,,,,,,,,,
"Data last modified January 22, 2009",,,,,,,,,,,,,,,
All elevations are in meters.,,,,,,,,,,,,,,,
Missing values are -999.99.,,,,,,,,,,,,,,,
Sites,NA,NA,NA,Athabasca R. at Pine Cr.,Blanche L.,Galoot Cr.,Garouche
Cr.,Grey Wavy L.,Grey Wavy Channel,
Athabasca R. at Richardson R.,Limon L.,Long Portage L.,Mamawi Cr.,PAD42
L.,L. Claire
Latitude,NA,NA,NA,58.353214,58.39158,58.605317,58.643683,58.51776,58.556183,
58.418417,58.41963,58.5413,58.56815,58.55633,58.64536
Longitude,NA,NA,NA,-111.544288,-111.2975,-111.106167,-111.223867,-111.14152,-111.1093,
-111.255333,-111.36768,-111.48143,-111.49885,-111.17075,-111.7078
Year,DOY,Date,Time_local,AR_PC_elev,BL_elev,GC_elev,Gar_C_elev,GWL_elev,GWC_elev,AR_RR_elev,LL_elev,LPL_elev,MC_elev,
PAD42_L_elev,LC_elev
YYYY,Julian Day of Year,YYYYMMDD,Local Time (GMT-7),Water Surface
Elevation (m),Water Surface Elevation (m),
Water Surface Elevation (m),Water Surface Elevation (m),Water Surface
Elevation (m),Water Surface Elevation (m),Water Surface Elevation (m),
Water Surface Elevation (m),Water Surface Elevation (m),Water Surface
Elevation (m),Water Surface Elevation (m),Water Surface Elevation (m)
2006,154,20060603,20:00,-999.99,212.04,-999.99,-999.99,-999.99,210.05,211.88,211.58,-999.99,-999.99,-999.99,-999.99
2006,154,20060603,20:15,-999.99,212.05,-999.99,-999.99,-999.99,210.04,211.87,211.58,-999.99,-999.99,-999.99,-999.99
2006,154,20060603,20:30,-999.99,212.05,-999.99,-999.99,-999.99,210.04,211.88,211.58,-999.99,-999.99,-999.99,-999.99
...
2007,253,20070910,12:45,-999.99,-999.99,209.62,-999.99,-999.99,-999.99,-999.99,-999.99,-999.99,-999.99,-999.99,-999.99
2007,253,20070910,13:00,-999.99,-999.99,209.62,-999.99,-999.99,-999.99,-999.99,-999.99,-999.99,-999.99,-999.99,-999.99
2007,253,20070910,13:15,-999.99,-999.99,209.63,-999.99,-999.99,-999.99,-999.99,-999.99,-999.99,-999.99,-999.99,-999.99
Column Heading Units
Description
Location
Local name for the location sampled
Latitude Decimal degrees
Coordinates, WGS 84
Longitude Decimal degrees
Coordinates, WGS 84
Record_Count Number of sampling events
Number of sampling events and the number of data rows in pad_water_quality_0607.csv for a given location.
pad_water_quality_locations_0607.csv,,,
"Measurements of Water Quality and Ancillary Parameters at locations in
the Peace-Athabasca Delta (PAD), 2006-2007",,,
"Collected by Tamlin M. Pavelsky and Laurence C. Smith with assistance
from Richard Carlos, Birch Pavelsky, and Robert Grandjambe",,,
"File last modified January 22, 2009",,,
Location,Latitude,Longitude,Record_Count
Units,Decimal degrees,Decimal degrees,Number of sampling events
Athabasca R.,58.3297,-111.515,1
Athabasca R. at Cecs,58.4292,-111.271,6
Athabasca R. at cutoff,58.423,-111.505,9
...
Rochers Top,58.7107,-111.216,9
Upper Embarras R. 1,58.441,-111.539,2
Upper Embarras R. 2,58.39783,-111.55013,2
Column Heading Units
Description
Location
Local name for the location sampled
Date YYYYMMDD
Date of acquisition (YYYYMMDD)
Time hhmm
Time of acquisition in local time (GMT-7)
Latitude Decimal degrees
Coordinates in decimal degrees obtained using a hand held Garmin Geko 201 GPS, WGS84 Datum.
Longitude Decimal degrees
Coordinates in decimal degrees
obtained using a hand held Garmin Geko 201 GPS, WGS84 Datum. Secchi_Depth cm
Mean of two secchi disc optical
depth measurements in cm, one with the disc descending in the water column, the other with the disc ascending.
Wind_Speed m/s
Average wind speed in m/s over a 10
-second period obtained using a hand held anemometer. Wind_Direction None
Mean wind direction estimated using
a compass and a small length of surveyor’s tape. Water_Depth m
River or lake depth in m at the sampling location measured using one of two method s: (1) a boat
-mounted sonar -based depth sensor attached to a GPS or (2) direct
measurement of the length of anchor rope submerged when the anchor was
located directly below the boat. All depth measurements should be
viewed as approximations.
Water_Temperature deg C
Mean water temperature in degrees C at 1 m depth (in areas where depth > 1 m) over at least a
1-minute period. Measurements were obtained using a Eureka Manta®
multiprobe.
Turbidity
NTU Mean Optical Turbidity in
Nephelometric Turbidity Units (NTU) at 1 m (in areas where depth
> 1 m) over at least a 1 -minute period. Measurements were
obtained using a Eureka Manta® multiproble.
Specific_Conductivity
uS Mean specific conductivity in
microSiemens (uS) at 1 m (in areas where depth >1 m) over at
least a 1 -minute period. Measurements were obtained using a Eureka
Manta® multiprobe.
Total_Suspended_Solids mg/1
Water grab samples were collected at approximately 0.3 m depth in 250 or 500 mL Nalgene® plastic sample
bottles. Sediment from each water sample was filtered using a vacuum
filtration system (Image 4) onto a 0.1 micron cellulose filter that had
been dried for 1 hour in a 110 deg F oven and then weight to 0.00 1g.
After filtration, filters were dried for an additional hour at the same
temperature and weighed to determine the mass of raw sediment in mg.
This mass was then divided by the volume of the original water sample
to produce values for Total Suspended Solids in mg/L.
Inorganic_Sediment_Concentration
mg/1
Filter papers with sediment were
baked in ceramic crucibles at 550 C for 1 hour in a muffle furnace to
remove filter and organic portion of sediments. Difference in mass
between crucible without sediment and crucible with sediment after
baking is recorded as the inorganic sediment mass in mg. This mass was
then divided by the volume of water originally filtered to produce
inorganic sediment concentration in mg/L. Surface_Flow_Velocity
m/s Flow velocity was measured using a
plastic drogue (Image 4), a stopwatch, and a hand held GPS. The drogue
was constructed using two 22 by 28 cm rectangles of “stiff” plastic
intersecting along their centerlines, with a float attached to the top.
The drogue was dropped from a stationary boat into the water and the
time and a GPS waypoint were recorded. The drogue was allowed to drift
with the current for at least 5 minutes in most cases. On retrieval,
the time in water was recorded along with a second GPS point. Velocity
vectors were then constructed and flow velocity in m/s calculated by
dividing distance between the GPS points by the time the drogue was in
the water. Negative velocities imply flow direction contrary to the
usual direction of flow for a location.
PAD_Water_Quality_0607.csv,,,,,,,,,,,,,,
"Measurements of Water Quality and Ancillary Parameters at locations in
the Peace-Athabasca Delta (PAD), 2006-2007",,,,,,,,,,,,,,
"Collected by Tamlin M. Pavelsky and Laurence C. Smith with help from
Richard Carlos, Birch Pavelsky, and Robert Grandjambe",,,,,,,,,,,,,,
"Data last modified January 22, 2009",,,,,,,,,,,,,,
"Missing values are -99.99 for numeric parameters and ""NoData"" for
Wind_Direction.",,,,,,,,,,,,,,
Location,Date,Time,Latitude,Longitude,Secchi_Depth,Wind_speed,Wind_Direction,Water_Depth,Water_Temperature,Turbidity,
Specific_Conductivity,Total_Suspended_Solids,Inorganic_Sediment_Concentration,Surface_Flow_Velocity
Units,YYYYMMDD,hh:mm,Decimal Degrees,Decimal Degrees,cm,m/s,None,m,deg
C,NTU,uS,mg/l,mg/l,m/s
Athabasca
R.,20060722,11:35,58.32968,-111.51507,-99.99,-99.99,NoData,-99.99,-99.99,-99.99,-99.99,36,32.4,-99.99
Athabasca R. at
Cecs,20070628,13:35,58.42925,-111.27117,32.5,4.7,E,2.8,18.59,83.4,0.266,88.1,71.2,0.87
Athabasca R. at
Cecs,20070702,13:47,58.42925,-111.27117,29,4.4,SSW,2.3,18.53,83.6,0.259,94.9,82.7,0.72
...
Upper Embarras R.
1,20070908,12:49,58.44104,-111.53914,62.5,3.7,NW,2.1,13.89,25.4,0.268,33.9,22.4,0.85
Upper Embarras R.
2,20070710,16:47,58.39783,-111.55013,22,2.6,NNE,3.1,21.34,133,0.258,137.8,122.2,0.93
Upper Embarras R.
2,20070908,12:32,58.39783,-111.55013,62.5,4.2,NNW,2.1,13.88,27,0.268,37.3,27.5,0.7
Site (Region)
Westernmost
Longitude Easternmost Longitude
Northernmost Latitude
Southernmost Latitude
Geodetic Datum Peace-Athabasca
Delta, Canada
-111.7078
-111.1061667
58.64536
58.3534
WGS 84
Time period:
- The data set covers the period 2006/06/03 to 2007/09/10.
3. Data Application and Derivation:
These data sets were originally collected to improve understanding of hydrologic recharge processes in low -relief environments and to provide ground -based measurements to validate satellite observations of inundation and sediment transport (Pavelsky and Smith, 2008).
4. Quality Assessment:
This data set can be considered final and have been checked for consistency within and across individual variables. A quantitative assessment of the data's uncertainty has not been conducted.
These data are subject to ongoing error-correction and quality-assurance testing, and are subject to change.
5. Data Acquisition Materials and Methods:
River and lake water surface elevations were measured at 9 locations within the Peace Athabasca Delta (PAD) in 2006 and 12 locations in 2007 (Fig. 3). Variations in depth were measured using Solinst Levelogger pressure transducer water level loggers (Fig. 4) and were corrected for variations in atmospheric pressure using Solinst Barologgers. In order to ensure stability, loggers were attached to concrete cinder blocks and lowered to the river or lake bottom. Cinder blocks were attached either to a small float (lakes) via rope or to a tree on the bank (rivers) via steel cable. Water levels were recorded on a 15-minute time step with an accuracy of +/- 1 cm. All times recorded are in local time (GMT-07:00), and days are recorded in day of year counting from January 1. Latitude and Longitude were measured using a Garmin Geko 201 hand held GPS and are in the WGS 84 datum. Raw water levels were converted to water surface elevations via differential GPS surveys. At each logger location, a flat -topped metal stake was sunk into the ground and the elevation of the stake was surveyed relative to a known Water Survey of Canada marker. Elevation difference between the water surface and stake was surveyed on at least three separate occasions at each location during each field season. Water surface elevation accuracies range from +/- 1 to +/- 5 cm. All elevation values are leveled to the Canadian Gravimetric Geoid Model 2000. A copy of the report describing this model is included as a companion file CGGM2000_20090311.pdf
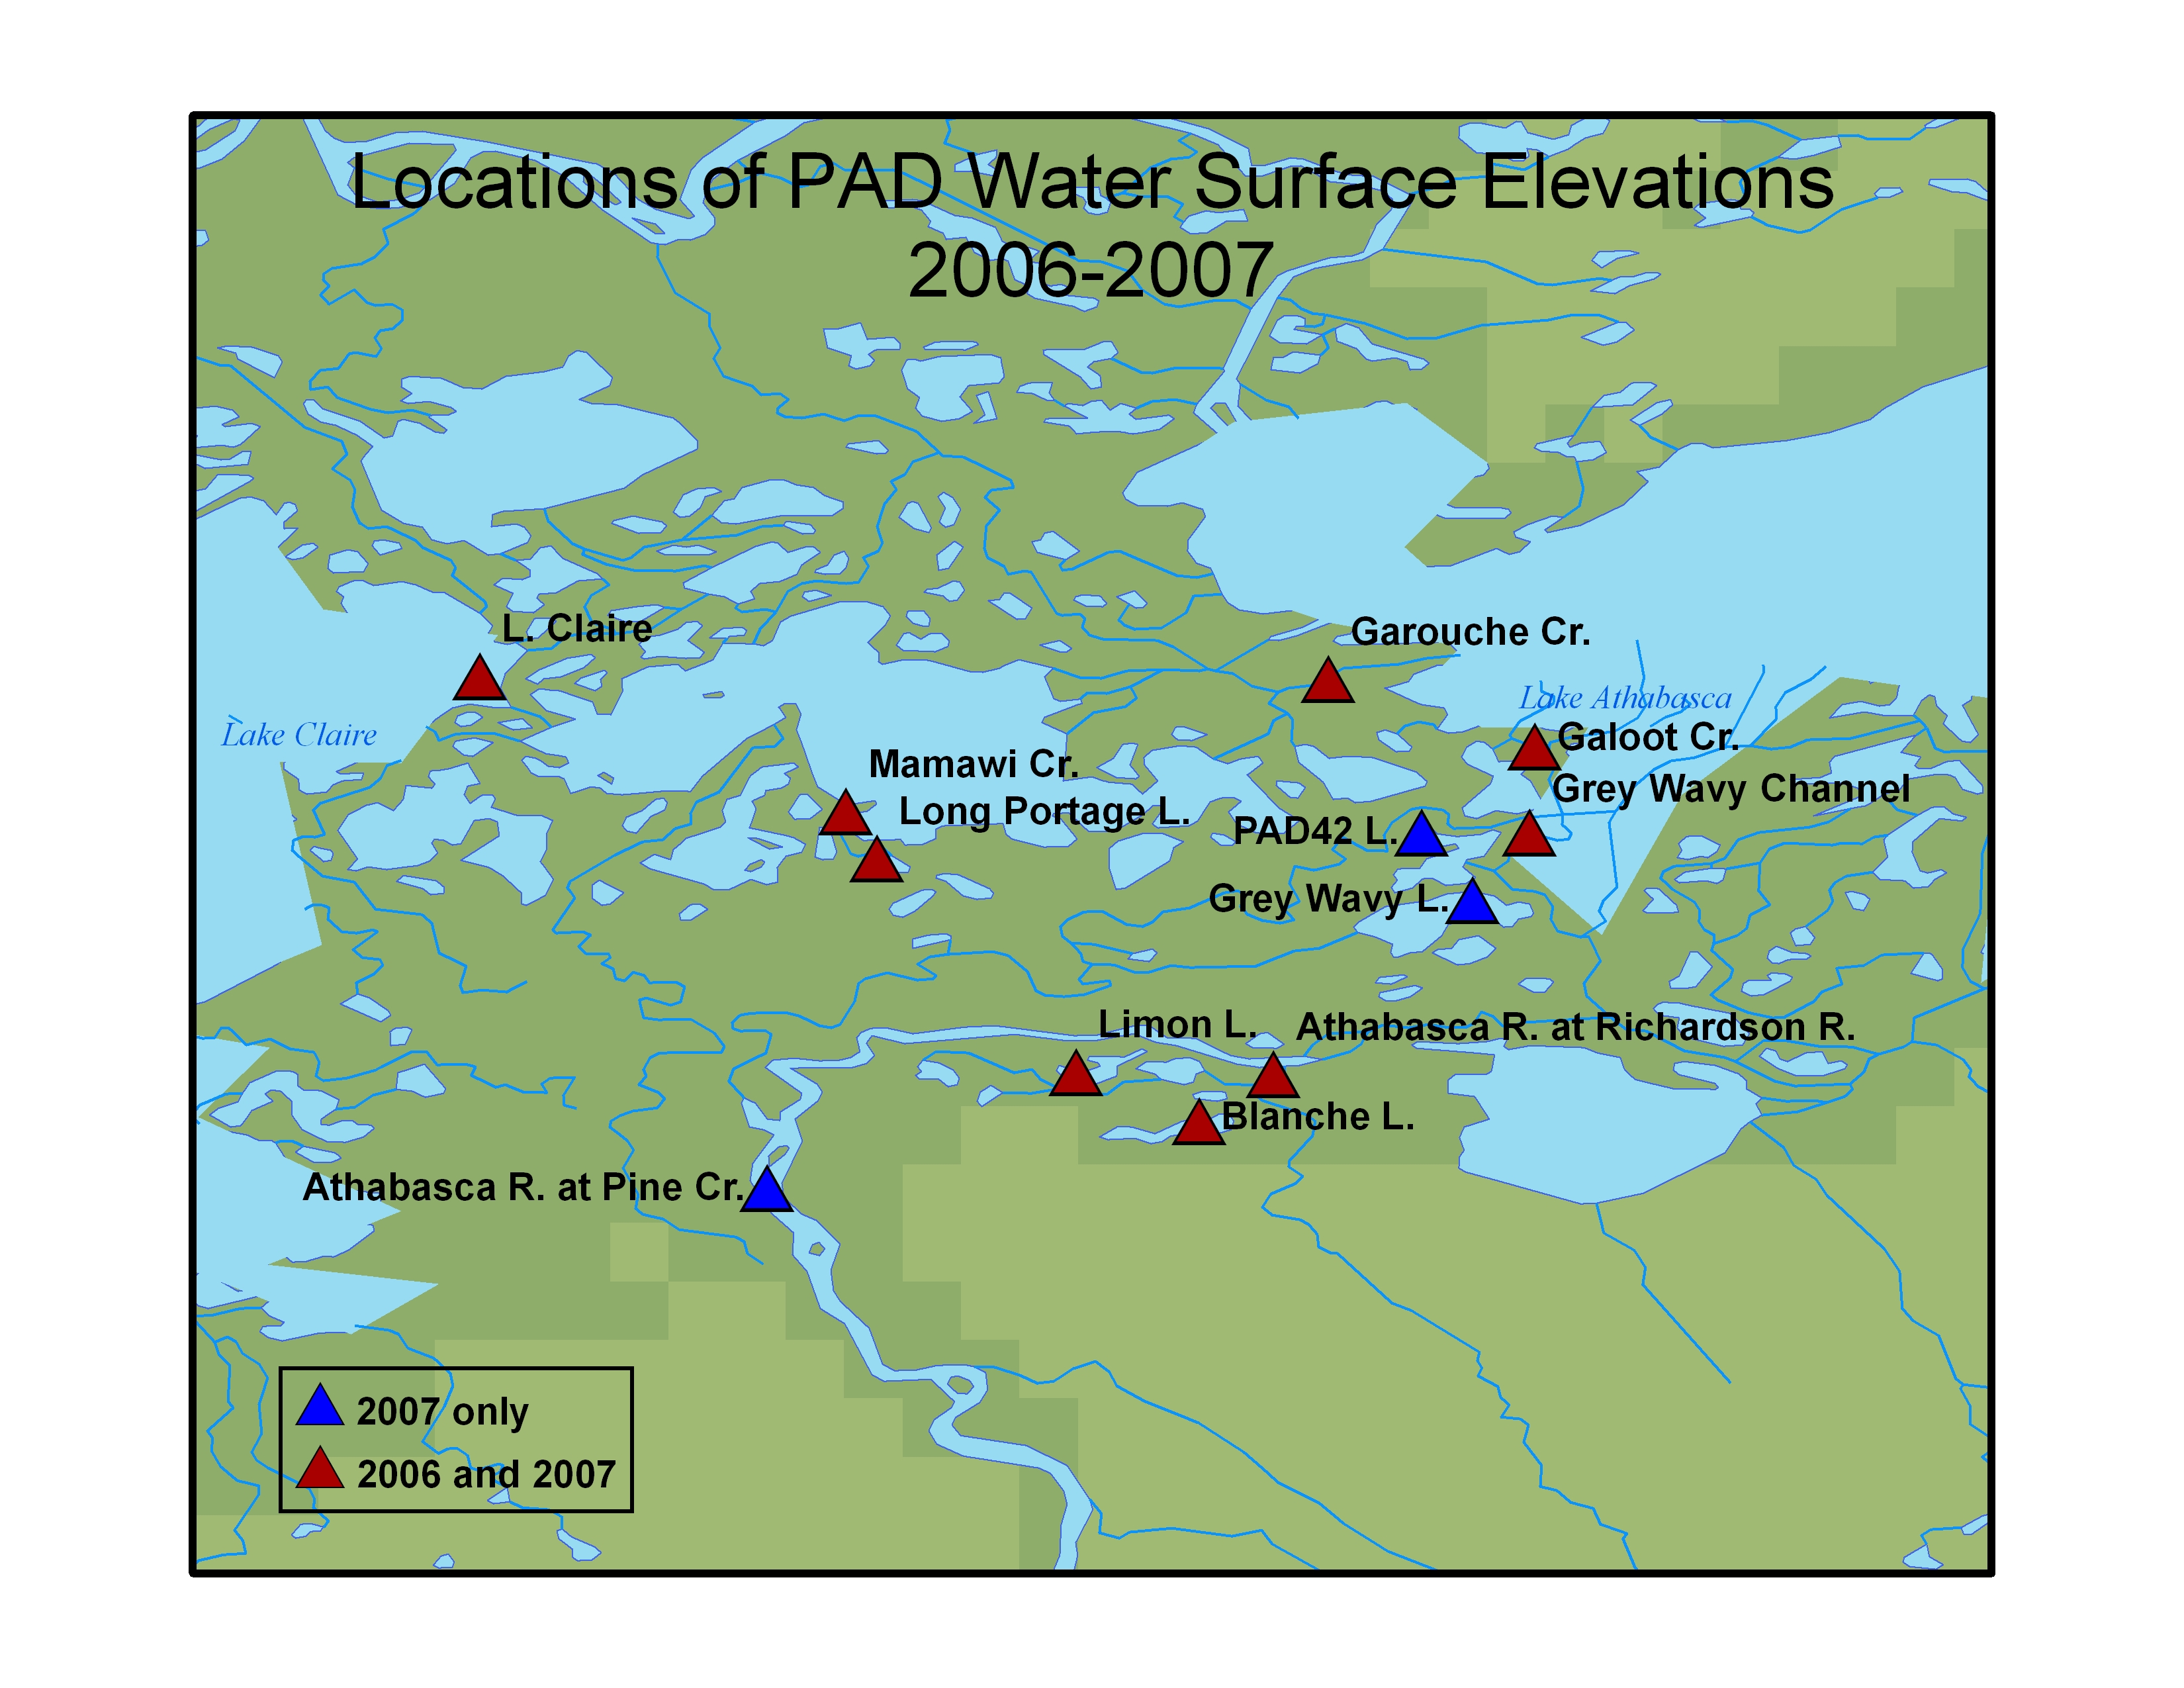
Figure 3. Water surface elevations were measured at 9 locations within the Peace Athabasca Delta (PAD) in 2006 and 12 locations in 2007.
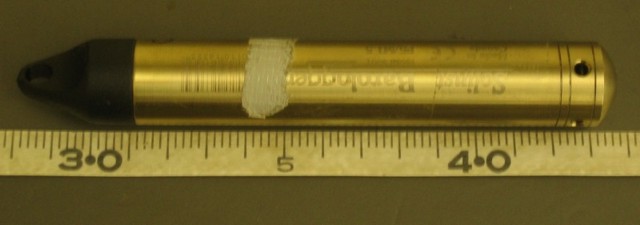
Figure 4. Solinst Levelogger used to measure water levels.
Water quality and ancillary parameters, inclulding Secchi disc depth,
turbidity, specific conductivity, water temperature, water depth,
wind speed, total suspended solids (TSS), inorganic sediment concentration
(Fig. 6), and surface flow velocity (Fig 7.) were measured at 120 locations
within the Peace-Athabasca Delta during the summers of 2006 and 2007 (Figure 5).
Data were collected multiple times at many locations, with the total number
of observations ranging from 1 to 25 for a given location. Not all variables
were measured for all locations. The locations where data were collected and
the number of data revisits for each site are included in
pad_water_quality_locations_0607.csv, and the actual water quality data
are archived in the file
pad_water_quality_0607.csv . A complete description of all variables,
including units and collection methods, is provided in Section 2 of this
document in the table for the Data
File Description,
pad_water_quality_0607.csv.
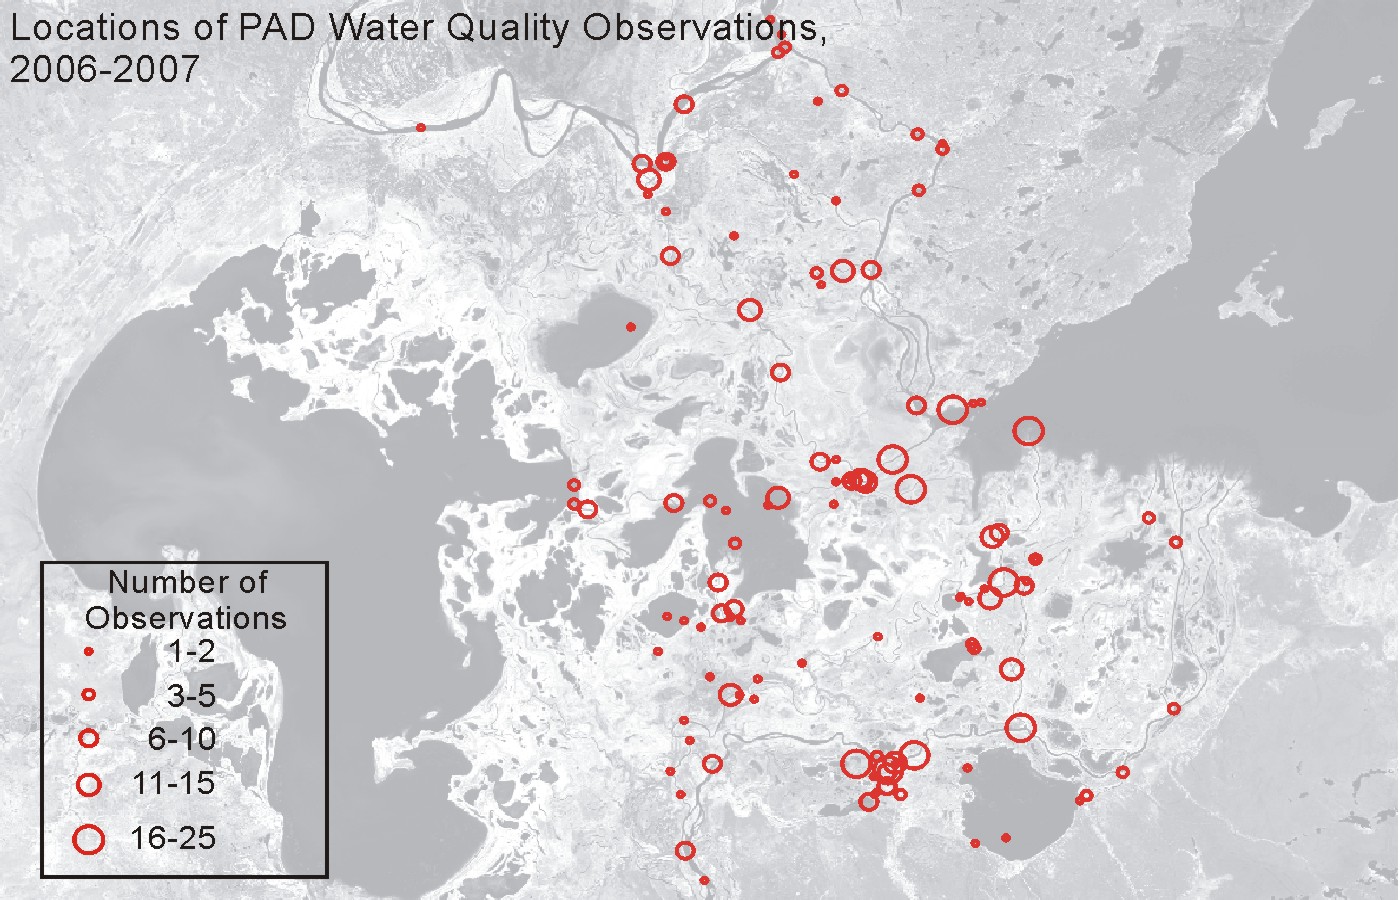
Figure 5. Water quality and ancillary parameters were measured at 120 locations within the Peace-Athabasca Delta during summers 2006 and 2007.
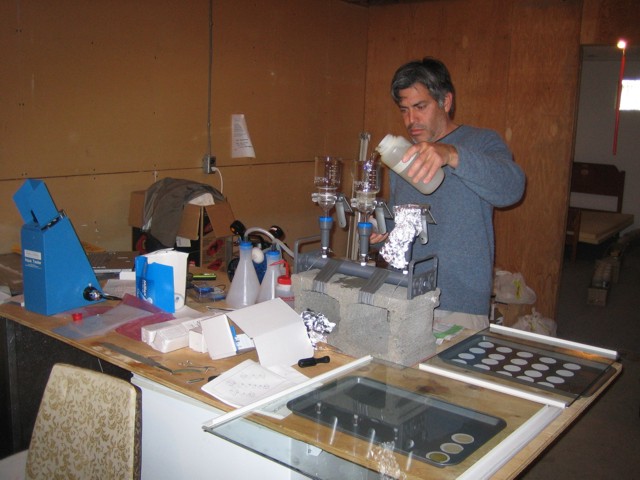
Figure 6. Suspended soilids filtration equipment.
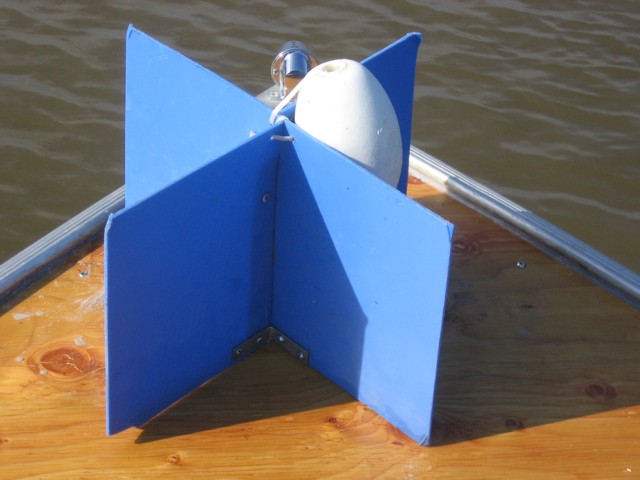
Figure 7. Drogue used to measure surface flow velocity.
6. Data Access:
This data is available through the Oak Ridge National Laboratory (ORNL) Distributed Active Archive Center (DAAC).
Data Archive Center:
Contact for Data Center Access Information:
E-mail: uso@daac.ornl.gov
Telephone: +1 (865) 241-3952
7. References:
Pavelsky, T.M. and L.C. Smith. 2008. Remote Sensing of Hydrologic Recharge in the Peace-Athabasca Delta, Canada. Geophysical Research Letters, 35(8), L08403. doi:10.1029/2008GL033268
Smith, L.C. and T.M. Pavelsky. (accepted, 2009). Remote sensing of volumetric storage change in lakes. Earth Surface Processes and Landforms.
Pavelsky, T.M. and L.C. Smith. (in review, 2009). Remote sensing of suspended sediment concentration, flow velocity, and lake recharge in the Peace-Athabasca Delta, Canada. Water Resources Research.