Documentation Revision Date: 2016-12-06
Data Set Version: V1
Summary
This data set contains the contents of the Fluxnet-Canada/Canadian Carbon Program Data Information System (DIS) which was previously distributed as an internet based warehouse for all FLUXNET Canada and the CCP until the website was closed in 2014.
The eddy covariance method was used at individual network tower sites to measure mass and energy exchange across a horizontal plane between vegetation and the free atmosphere. The spatial scales of observations at each tower extended through the flux footprint around the tower (ranging between 100 and 1000 m). Ground plots were studied to gain an overview of the state of ecological and site variables and were established and surveyed according to Canada's National Forest Inventory ground plot protocols (NFI 2004 A-F).
There are 35 files with this data set. This includes 33 compressed files (*.zip), one for each tower site (when opened these directories contain a total of 21,494 files in various formats). There is also one compressed shapefile (.zip) which contains spatial information about these sites, and one comma-separated file (.csv) which provides the site locations, FLUXNET identifiers, and investigator contact information from the shapefile.
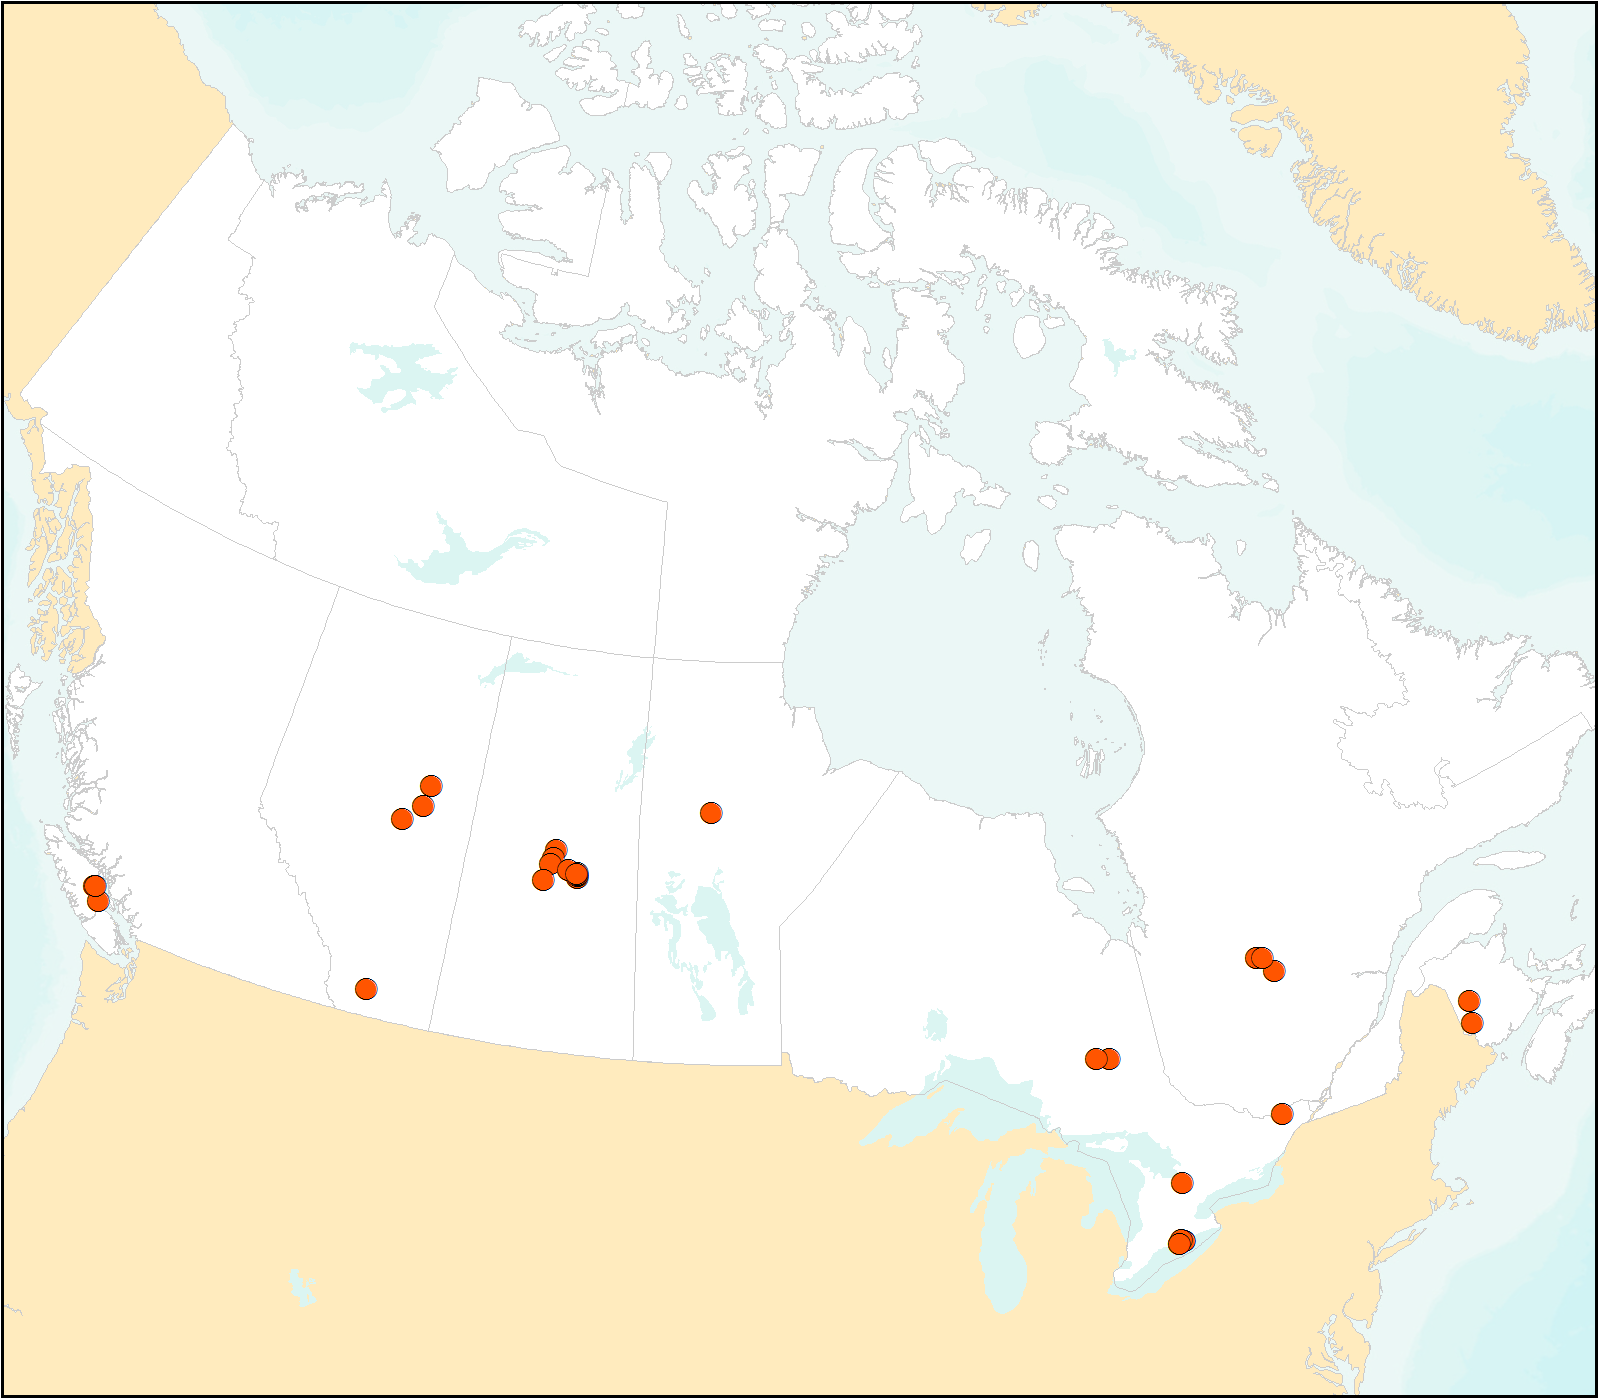
Figure 1. Locations of the 32 Eddy-Covariance towers of FLUXNET Canada included in this data set.
Citation
FLUXNET CANADA TEAM. 2016. FLUXNET Canada Research Network - Canadian Carbon Program Data Collection, 1993-2014. ORNL DAAC, Oak Ridge, Tennessee, USA. http://dx.doi.org/10.3334/ORNLDAAC/1335
Table of Contents
- Data Set Overview
- Data Characteristics
- Application and Derivation
- Quality Assessment
- Data Acquisition, Materials, and Methods
- Data Access
- References
Data Set Overview
FLUXNET Canada is comprised of the Fluxnet-Canada Research Network (FCRN) and the Canadian Carbon Program (CCP). It was a national research network of university and government scientists studying the influence of climate and disturbance on carbon cycling along an east-west transect of Canadian forest and peat land ecosystems.
The data provided are measured and modeled results as obtained from the site investigators. They were not standardized and quality-controlled. Data include: atmospheric carbon dioxide (CO2) and water vapor fluxes, and many ancillary meteorological variables; soil CO2 efflux and soil moisture; stable carbon isotopes; site soil and vegetation characteristics surface water, plus documentation and descriptions for the 32 tower sites across 12 flux research stations. The time period is from 1993 - 2014; most reported data for a site does not cover the entire period.
The eddy covariance method was used at individual network sites to measure mass and energy exchange across a horizontal plane between vegetation and the free atmosphere. Information collected at a site encompassed sensor measurements, field observations, laboratory analysis of field samples, as well as anecdotal descriptions. Ground Plots were studied to gain an overview of the state of ecological and site variables and included measurements of trees, understory, woody debris, forest floor, vegetation dominant species, leaf characteristics, carbon, biomass, and soil measurements within each plot (Baldocchi, 2008).
This data set contains the contents of the Fluxnet-Canada/Canadian Carbon Program Data Information System (DIS) which was previously distributed as an internet based warehouse for all FLUXNET Canada and the CCP until the website was closed in 2014. The data are presented in a structure that mirrors that of the FLUXNET Canada Web Site and are provided in their original distribution format. They have been repackaged as zip files for distribution purposes.
Related Data:
Updated standardized and quality-controlled data from many of the Fluxnet-Canada sites is available from the Ameriflux group at http://ameriflux.lbl.gov/
User Note:
Please acknowledge the appropriate Site Contact when using these data; this information is provided in the shapefile (FLUXNET-Canada_file_site_investigators.zip), as well as in the text and Word files associated with site-specific data.
Table 1. Fluxnet Canada Tower Site Contacts for Acknowledgement
|
Tower Sites |
Site Contact |
| AB-Grassland | Larry Flanagan |
| AB-WPeatland-TreedFen | Larry Flanagan |
| AB-WPeatland-MayPoorFen | Larry Flanagan |
| AB-WPeatland-TonysRichFen | Larry Flanagan |
| BC-DFir1949 | Andy Black |
| BC-HarvestDFir1988 | Andy Black |
| BC-HarvestDFir2000 | Andy Black |
| MB-NOldBlackSpruce | Allison Dunn (1994-2006), Brian Amiro (2007-2008) |
| NB-BFir1967-NashwL01 | Charles Bourque |
| NB-BFir1975-CharlieL01 | Charles Bourque |
| ON-BordenMixedWood | Ralf Staebler |
| ON-Deciduous-TP | M. Altaf Arain |
| ON-EPeatland-MerBleue | Peter Lafleur |
| On-HarvestMixedWood1989 | Harry McCaughey |
| ON-OldMixedWood-GhogR | Harry McCaughey |
| ON-PlantnWPine1939-TP | Altaf Arain |
| ON-PlantnWPine1974-TP | Altaf Arain |
| ON-PlantnWPine1989-TP | Altaf Arain |
| ON-PlantnWPine2002-TP | Altaf Arain |
| QC-BSpruceJPineCut | Hank Margolis |
| QC-MatureBSpruce | Hank Margolis |
| QC-HarvestBS1975 | Hank Margolis |
| SK-Fen | Andy Black and Alan Barr |
| SK-Fire1977 | Brian Amiro |
| SK-Fire1989 | Brian Amiro |
| SK-Fire1998 | Brian Amiro |
| SK-HarvestJP1975 | Alan Barr |
| SK-HarvestJP1994 | Shohei Murayama (2001-2003, Alan Barr (2004-2012) |
| SK-HarvestJP2002 | Andy Black and Alan Barr |
| SK-OldAspen | Andy Black and Alan Barr |
| SK-OldBlackSpruce | Andy Black and Alan Barr |
| SK-OldJackPine | Harry McCaughey, Andy Black, and Alan Barr |
Data Characteristics
Spatial Coverage: Fluxnet Canada tower sites on an east-west transect of Canadian forest and peat land ecosystems.
Spatial Resolution: Point data
Temporal Coverage: Data covers 1993 to 2014
Temporal Resolution: Varies from 30-minute meteorological and flux measurements to one-time synoptic soil and biological site characterization data.
Study Area (All latitudes and longitudes are given in decimal degrees)
| Site | Westernmost Longitude | Easternmost Longitude | Northernmost Latitude | Southernmost Latitude |
|---|---|---|---|---|
| Fluxnet Canada - various sites | -125.3336 | -67.0993 | 55.8800 | 42.6609 |
Table 2. Fluxnet Canada Tower Site Locations
| Tower Site | Description | Lat | Long |
|---|---|---|---|
| AB-Grassland | Alberta - Mixed Grass Prairie | 49.70919 | -112.9403 |
| AB-WPeatland-TreedFen | Alberta - Western Peatland - LaBiche River, Black Spruce/Larch Fen | 55.5375 | -112.4470 |
| AB-WPeatland-MayPoorFen | Alberta - Western Peatland - Poor Fen (Sphagnum moss) | 55.5375 | -112.3343 |
| AB-WPeatland-TonysRichFen | Alberta - Western Peatland - Rich Fen (Carex) | 54.4700 | -113.3200 |
| BC-DFir1949 | British Columbia - 1948 Douglas-fir Stand | 49.8673 | -125.3336 |
| BC-HarvestDFir1988 | British Columbia - Pole sapling Douglas-fir Stand | 49.5346 | -124.9004 |
| BC-HarvestDFir2000 | British Columbia - Clearcut Douglas-fir Stand (harvested winter 1999/2000) | 49.8705 | -125.2909 |
| MB-NOldBlackSpruce | Manitoba - Northern Old Black Spruce (former BOREAS Northern Study Area) | 55.8800 | -98.4810 |
| NB-BFir1967-NashwL01 | New Brunswick - 1967 Balsam Fir - Nashwaak Lake Site 01 (Mature Balsam fir forest) | 46.4738 | -67.0993 |
| NB-BFir1975-CharlieL01 | New Brunswick - Charlie Lake site 01 (immature balsam fir forest to be thinned in year 3) | 45.8850 | -67.3570 |
| ON-BordenMixedWood | Ontario - Mixed Deciduous, Borden Forest Site | 44.3185 | -79.9342 |
| ON-Deciduous-TP | Ontario - Turkey Point Deciduous Forest Site | 42.6353 | -80.55757 |
| ON-EPeatland-MerBleue | Ontario - Eastern Peatland, Mer Bleue | 45.4094 | -75.5187 |
| On-HarvestMixedWood1989 | Ontario - Childerhose Juvenile Boreal Mixedwood Forest harvested in 1989 | 48.1330 | -81.6280 |
| ON-OldMixedWood-GhogR | Ontario - Groundhog River, Boreal Mixedwood Forest | 48.2173 | -82.1555 |
| ON-PlantnWPine1939-TP | Ontairo - Turkey Point 1939 Plantation White Pine | 42.7098 | -80.3574 |
| ON-PlantnWPine1974-TP | Ontario - Turkey Point 1974 Plantation White Pine | 42.7068 | -80.3483 |
| ON-PlantnWPine1989-TP | Ontario - Turkey Point 1989 Plantation White Pine | 42.7744 | -80.4588 |
| ON-PlantnWPine2002-TP | Ontario - Turkey Point 2002 Plantation White Pine | 42.6609 | -80.5595 |
| QC-BSpruceJPineCut | Quebec - Eastern Boreal, Black Spruce / Jack Pine Cutover | 49.2671 | -74.0365 |
| QC-MatureBSpruce | Quebec - Eastern Boreal, Mature Black Spruce | 49.6925 | -74.3420 |
| QC-HarvestBS1975 | Quebec - Eastern Boreal, Black Spruce forest harvested in 1975 | 49.7598 | -74.5711 |
| SK-Fen | Saskatchewan - Western Boreal, wetland | 53.8021 | -104.6180 |
| SK-Fire1977 | Saskatchewan - Western Boreal, forest burned in 1977 | 54.4850 | -105.8176 |
| SK-Fire1989 | Saskatchewan - Western Boreal, forest burned in 1989 | 54.2539 | -105.8775 |
| SK-Fire1998 | Saskatchewan - Western Boreal, forest burned in 1998 | 54.0916 | -106.0053 |
| SK-HarvestJP1975 | Saskatchewan - Western Boreal, Jack Pine forest harvested in 1975 (BOREAS Young Jack Pine) | 53.8758 | -104.6453 |
| SK-HarvestJP1994 | Saskatchewan - Western Boreal, Jack Pine forest harvested in 1994 | 53.9084 | -104.6559 |
| SK-HarvestJP2002 | Saskatchewan - Western Boreal, Jack Pine forest harvested in 2002 | 53.9447 | -104.6493 |
| SK-OldAspen | Saskatchewan - Western Boreal, Mature Aspen | 53.6289 | -106.1978 |
| SK-OldBlackSpruce | Saskatchewan - Western Boreal, Mature Black Spruce | 53.9872 | -105.1178 |
| SK-OldJackPine | Saskatchewan - Western Boreal, mature Jack Pine forest | 53.9163 | -104.692 |
Data file information
There are 35 total data files provided with this data set, 34 (*.zip) files and one comma-separated (.csv) file.
- There are 32 files (*.zip) with site-specific data and documentation which when uncompressed contain the original data as distributed by the FLUXNET Canada web site.
- The 0-Fluxnet-Canada.zip file contains a complete description of the Fluxnet Canada data management plan, standard measurements, metadata documentation guidelines, plus multi-site data compilations, plant nutrients, and stable isotope data for plants and air samples.
- There is one compressed shapefile (provided in FLUXNET-Canada_file_site_investigators.zip) that contains spatial information about each of the 32 research sites, including FLUXNET nework identifiers.
- One comma-separated (FLUXNET-Canada_file_site_investigators.csv) file which provides site and investigator information for each of the compressed directories.
The total file count is 21,494 data and documentation files when all directories are uncompressed.
The data are presented in a structure that mirrors that of the FLUXNET Canada Web Site and are provided in their original distribution format. They have been repackaged as zip files for distribution purposes.
Note that this section does not describe the contents of each specific file, but the descriptions below provide a good overview of all zip file contents. Data dictionaries and site descriptions are provided in text and/or MS Word files with each compressed directory.
Data files (*.zip)
Each zip file, when opened, contains one or more text or Word document files and data file folders. Many of the data files are in comma-separated (.csv) format; the first row in the files have the variable names and the second row provides the units under the variable name. There are also files in xls, .txt, .doc, .html, .pdf, and .rar formats.
Measured and modeled data are included. The data provided include carbon dioxide and water vapor fluxes, ancillary meteorological, soil, groundwater, surface water, vegetation, file documentation, and site descriptions. Most data are monthly or annual and the time periods vary from 1993 - 2014.
Coded values
Missing and no data values: -999 and NaN represent missing and no data values--there are files where all values are -999 or NaN except for the site information There are not a large number of these files and they are generally at the beginning of a time series, for example, the first month or year.
Quality assurance: The last two columns in the data files are for Certification and Revision information. Certification Code will either be "CPI" or "PRE". "CPI" means that data have been checked by the principal investigator and "PRE" means that the data are preliminary. "RevisionDate" is the date when the data were last revised by the principal investigator.
Data file names and descriptions.
Note: The time periods listed are for general reference; within each year listed, there may or may not be data provided for the entire year. The periods do not reflect the year of any revisions made to the data. Consult the associated metadata documents (.txt and/or .doc) files for additional information on data revisions and known errors.
Table 3. Fluxnet Canada Tower Site Data Files
| *.ZIP file name | Number of files | Time period |
|---|---|---|
| 0-Fluxnet-Canada | 147 | 1994-2014 |
| AB-Grassland | 129 | 1998-2008 |
| AB-WPeatland-TreedFen | 259 | 2003-2009 |
| AB-WPeatland-MayPoorFen | 54 | 2004-2006 |
| AB-WPeatland-TonysRichFen | 52 | 2004-2006 |
| BC-DFir1949 | 1,452 | 1997-2010 |
| BC-HarvestDFir1988 | 1,033 | 1995-2010 |
| BC-HarvestDFir2000 | 1,078 | 2000-2010 |
| MB-NOldBlackSpruce | 18 | 1994-2008 |
| NB-BFir1967-NashwL01 | 109 | 2002-2005 |
| NB-BFir1975-CharlieL01 | 41 | 2004-2005 |
| ON-BordenMixedWood | 91 | 1995-2012 |
| ON-Deciduous-TP | 253 | 2012-2014 |
| ON-EPeatland-MerBleue | 1,533 | 1998-2010 |
| On-HarvestMixedWood1989 | 248 | 2006-2010 |
| ON-OldMixedWood-GhogR | 1,337 | 2002-2010 |
| ON-PlantnWPine1939-TP | 1,305 | 2002-2014 |
| ON-PlantnWPine1974-TP | 1,106 | 2002-2014 |
| ON-PlantnWPine1989-TP | 602 | 2002-2008 |
| ON-PlantnWPine2002-TP | 1,106 | 2002-2014 |
| QC-BSpruceJPineCut | 1,032 | 2001-2010 |
| QC-MatureBSpruce | 866 | 2003-2010 |
| QC-HarvestBS1975 | 392 | 2007-2010 |
| SK-Fen | 373 | 2002-2010 |
| SK-Fire1977 | 22 | 2002-2006 |
| SK-Fire1989 | 23 | 2001-2006 |
| SK-Fire1998 | 22 | 1993-2006 |
| SK-HarvestJP1975 | 598 | 1993-2010 |
| SK-HarvestJP1994 | 804 | 2001-2010 |
| SK-HarvestJP2002 | 795 | 2002-2010 |
| SK-OldAspen | 1,629 | 1993-2010 |
| SK-OldBlackSpruce | 1,553 | 1993-2010 |
| SK-OldJackPine | 1,432 | 1993-2010 |
Data file naming conventions for individual files in the site-level *.zip files.
There are text and Word files which describe the data file naming conventions for the files within the *.zip files. The following are general data file naming conventions.
Flux data files
Most files are named by site_FlxTwr_Flx_YYYY_MM_DD
Example file name: AB-WPL_FlxTwr_Flx3_2005-06-00.csv
Where:
- AB-WPL: is the Alberta Western Peatland Treed Fen Flux Tower site.
- FlxTwr: is subsite where data was collected, in this case the main fluxtower.
- Flx3: files include NEE, R and GPP.
- 2005-06-00: year, month, day.
Soil moisture and soil CO2 efflux data files
Soil moisture and soil CO2 efflux data are included for many sites. These file names contain additional abbreviations such as _SMx (soil moisture files) or SR2 (soil CO2 efflux files) .
Example file name: ON-WPP39_FlxTwr_SM2_2002-01-00.csv
Site Characteristics data file
Folders named X__Site_Characteristics contain a file named NACP_X__Ameriflux_Biological_Data_X.xls. These are excel files that provide site characteristics, vegetation data, biomass, carbon, data, etc. The files include the site name (represented as X).
Readme files and Word doc files provide data dictionaries, vegetation information, and additional information on file naming structure as well as related publications.
Data file aggregation and quality assessment
There are three levels of data aggregation and quality assessment for the flux and meteorological data.
Flux data:
- Ancillary: contains raw data used to derive Carbon, Water and Energy fluxes and ultimately Net Ecosystem Productivity information. Includes profile, tree bole and soil heat flux data.
- Computed Fluxes: contains Carbon, Water and Energy flux data.
- NEP: contains Net Ecosystem Productivity, Gross Ecosystem Productivity and Respiration information.
Meteorology data:
- Ancillary: contains a subset of Meteorological variables that were used to derive and quality assure some variables in the Main directory. These are "extra" variables that may be useful to only a few people.
- Main: contains the most complete sub set of meteorological variables where most have been corrected and some have been derived, but none have been gap-filled.
- Summarized: contains data that have been summarized from the Main subset. Variables have been aggregated (eg., 4 tower top temperature measurements have become one) and gaps have been filled. This summarized subset is to be standard for all sites.
Shapefile and comma-separated file
The shapefile (.shp) is provided in FLUXNET-Canada_file_site_investigators.zip. The following information is provided in the file. Site-specific information was obtained from the FLUXNET database at https://fluxnetweb.ornl.gov/.
Table 4. Shapefile contents
| Field Name | Description |
|---|---|
| file_name | File name-corresponds to each of the zip files listed in Table 1. |
| num_files | Number of zip files |
| siteid | FLUXNET site id |
| fluxnetid | FLUXNET id |
| sitename | FLUXNET site name |
| Desc | Description of the site |
| Lat | Latitude |
| Lon | Longitude |
| Start_Year | First year of data |
| End_Year | Last year of data |
| PI | Lead investigator |
| PI_Email | Lead investigator email |
Table 5. File contents of FLUXNET-Canada_file_site_investigators.csv.
| Field Name | Description |
|---|---|
| file_name | File name-corresponds to each of the zip files listed in Table 1. |
| num_files | Total number of files provided in the zip file when unzipped. |
| siteid | FLUXNET site id (https://fluxnetweb.ornl.gov/) |
| fluxnetid | FLUXNET id (https://fluxnetweb.ornl.gov/) |
| sitename | FLUXNET site name (https://fluxnetweb.ornl.gov/) |
| site_desc | Description of the site |
| lat | Latitude |
| lon | Longitude |
| start_Year | First year of data |
| end_Year | Last year of data |
| pi | Lead investigator |
| pi_email | Lead investigator email |
Application and Derivation
FLUXNET data could be used in climate models.
Quality Assessment
The data from the FLUXNET sites are quality assessed and gap-filled using techniques described in (Papale et al., 2006, Reichstein et al., 2005, Moffat et al., 2007, and Papale and Valentini 2003).
The equipment and methodology were standardized among sites by using common software and instrumentation.
Data Acquisition, Materials, and Methods
These are examples of the sampling and analysis methods employed by the investigators. The numerous Readme files and Word documentation files provided with the data contain detailed method and data descriptions and reference related publications.
Flux and Meteorology Data
Information collected at a site encompassed sensor measurements, field observations, laboratory analysis of field samples, as well as anecdotal descriptions. Each network site deploys a number of sensors measuring micro-meteorology such as precipitation or wind speed and carbon flux. The field data were processed to generate 1/2 hourly flux-met data files. The other, ancillary data include relatively infrequent measurements. An important aspect of the ancillary data is that each measurement is often annotated. For more information about ancillary data and related reporting protocol see (Law et al., 2008).
The eddy covariance method was used at individual network sites to measure mass and energy exchange across a horizontal plane between vegetation and the free atmosphere. Fluxes of carbon dioxide, water vapor and heat were determined by measuring the covariance between fluctuations in vertical velocity (w) and the mixing ratio of trace gases of interest (c) (Aubinet et al., 2000; Baldocchi, 2003); negative covariance values of net ecosystem CO2 exchange (FN) represent a loss of CO2 from the atmosphere and a gain by the surface. The temporal information produced at each network site varied. The spatial scales of observations at each tower extends through the flux footprint around the tower (ranging between 100 and 1000 m) (Gockede et al., 2004).
The 1/2 hourly flux-met data was passed from the sites to their regional networks and then on to FLUXNET. It was then quality assessed and gap-filled using techniques described in (Papale et al., 2006, Reichstein et al., 2005, Moffat et al., 2007, and Papale and Valentini 2003). The goal of gap filling is the reproduction of the NEE time series.
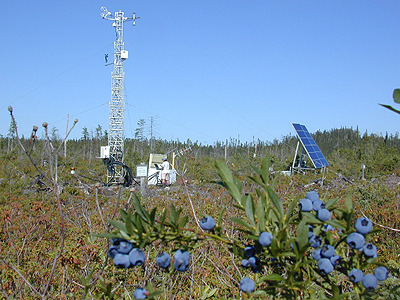
Figure 2. The QC-2000 harvested Black Spruce/Jack Pine site, Quebec, Canada. Image is from the https://fluxnet.ornl.gov/ site gallery.
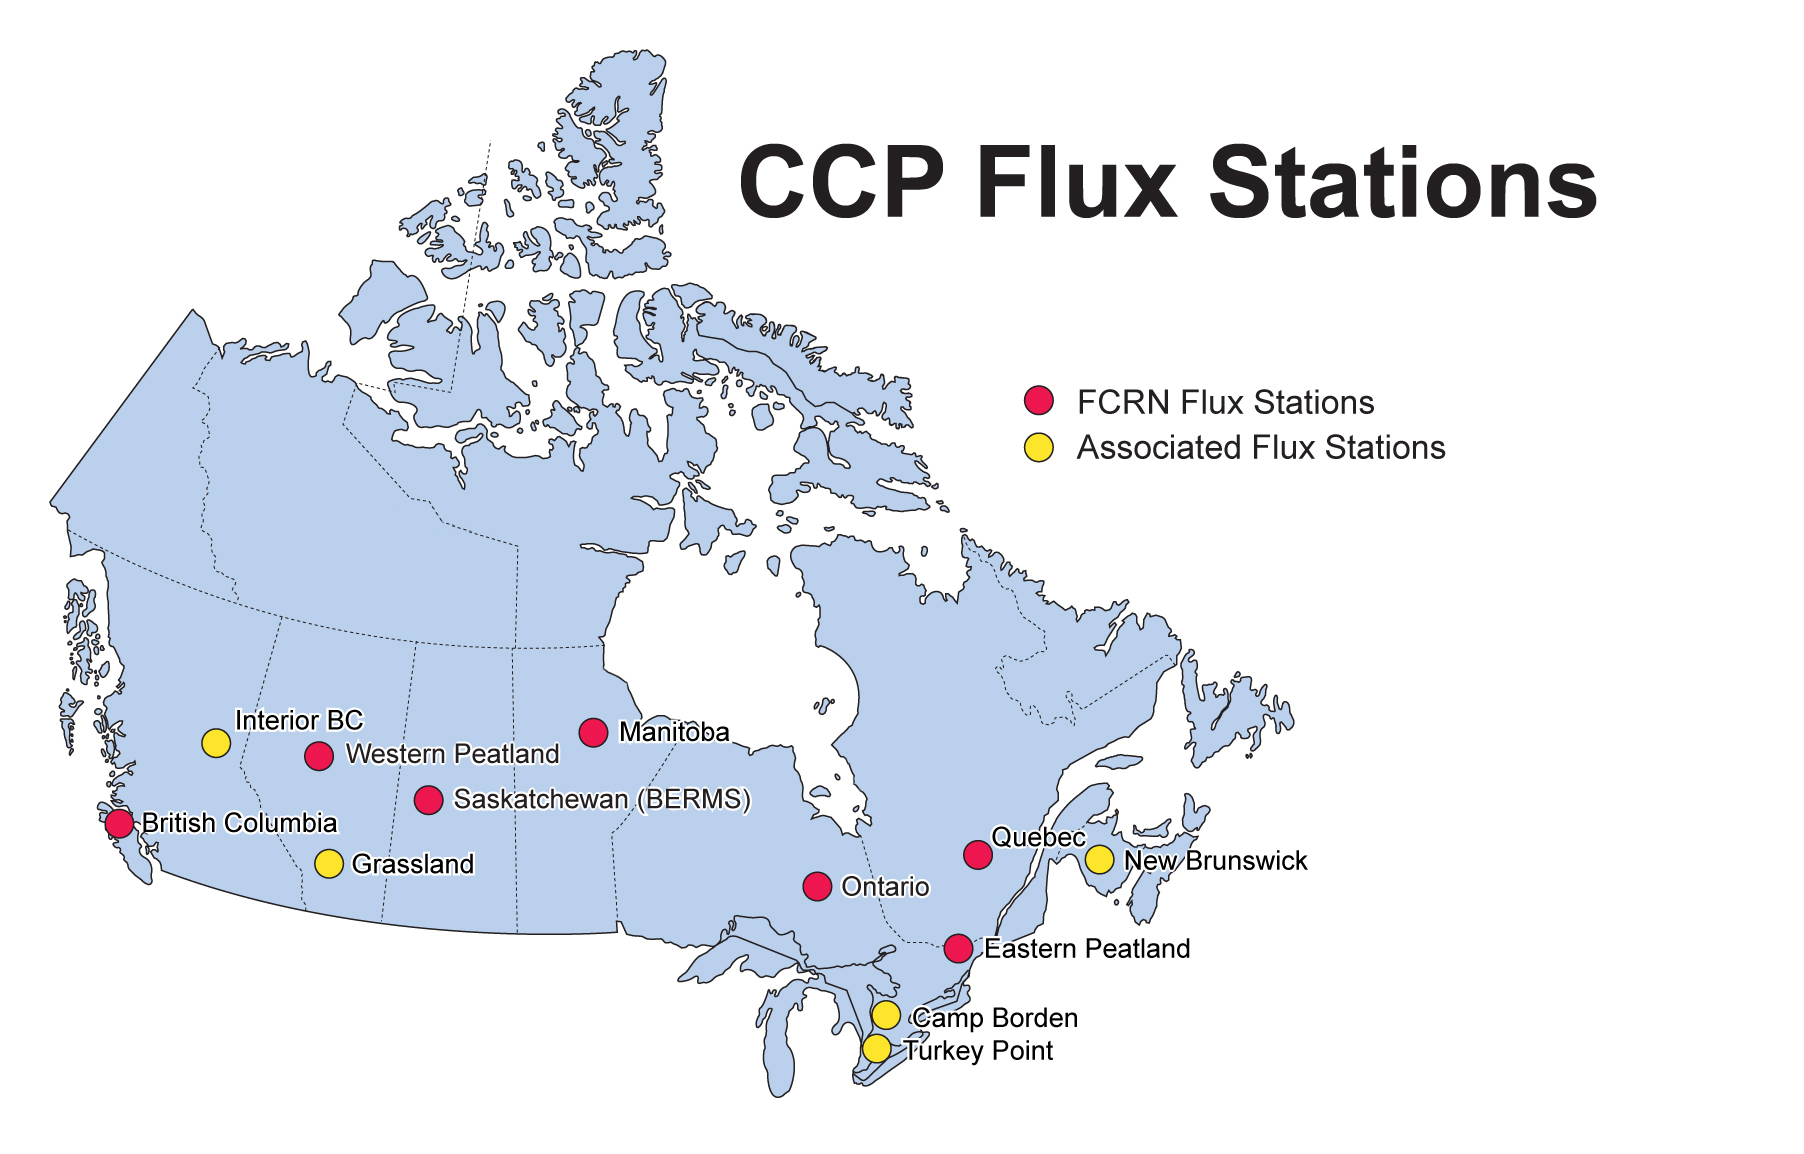
Figure 3. Canadian Carbon Program (CCP) FLUXNET Stations in 2008.
Ground Data
Ground Plots were studied to gain an overview of the state of ecological and site variables. Plots were established and surveyed according to Canada's National Forest Inventory ground plot protocols (NFI 2004), which were adopted by FRCN for these measurements. These protocols call for the establishment of 400-m2 circular plots and measurement of trees, understory, woody debris, forest floor, vegetation dominant species, leaf characteristics, carbon, biomass, and soil measurements within each plot. The individual files contain the documentation for site measurements (Baldocchi 2008).
Leaf Sample Nutrient Content and Carbon Isotope Composition
Leaves from each dominant tree species were sampled for nutrient content and carbon isotope composition. The leaf samples were collected in late August or early September 2005, from live, green leaves that were near the top of the trees and exposed to full sunlight. For conifer trees only current year’s needles were collected. Leaf samples were collected from 6 individuals of each tree species. After collection the leaves were placed in paper bags, dried at 60°C, and then ground to a fine powder in a coffee grinder and/or in a mortar and pestle. The total nitrogen and total carbon contents were analyzed on N2 and CO2 gases, respectively, that were generated from combustion/reduction of the dried leaf tissue in an elemental analyzer and quantified using a gas isotope ratio mass spectrometer. The other nutrient analysis (Ca, P, K, Mg, S) was conducted on tissue that was dry-ashed and then digested using a dilute HNO3 and HCl mixture and then quantified using an Inductively Coupled Plasma (ICP) spectroscopic analysis technique at Norwest Labs, Lethbridge.
d13C Measurements
The dried and ground leaf samples were prepared for measurements of carbon isotopic composition by combustion. A 3-4 mg subsample of ground organic material was sealed in a tin capsule and loaded into an elemental analyzer for combustion (Carla Erba). The carbon dioxide generated from the combustion was purified in a gas chromatographic column and passed directly to the inlet of a gas isotope ratio mass spectrometer (Delta Plus, Finnigan Mat, San Jose, CA, USA).
Atmospheric CO2 – Flask Samples
The data files contain information on the concentration of CO2 and the stable carbon (13C/12C) isotope composition of CO2 in flask samples of air collected at different Fluxnet-Canada Carbon Cycle Stations during 2003-2005. Most atmospheric CO2 samples were collected during nighttime sample periods. Air samples were collected in order to use a modified Keeling plot technique to calculate the isotope composition of CO2 respired by the ecosystem.
Data Access
These data are available through the Oak Ridge National Laboratory (ORNL) Distributed Active Archive Center (DAAC).
FLUXNET Canada Research Network - Canadian Carbon Program Data Collection, 1993-2014
Contact for Data Center Access Information:
- E-mail: uso@daac.ornl.gov
- Telephone: +1 (865) 241-3952
References
Aubinet, M., A. Grelle, A. Ibrom, Ü. Rannik, J. Moncrieff, T. Foken, A.S. Kowalski, P.H. Martin, P. Berbigier, Ch. Bernhofer, R. Clement, J. Elbers, A. Granier, T. Grünwald, K. Morgenstern, K. Pilegaard, C. Rebmann, W. Snijders, R. Valentini, T. Vesala. Advances in Ecological Research 30, 113-175.
Baldocchi, D.D . 2008. ‘Breathing’ of the Terrestrial Biosphere: Lessons Learned from a Global Network of Carbon Dioxide Flux Measurement Systems. Australian Journal of Botany. 56, 1-26.
Baldocchi, D.D . 2003. Assessing the eddy covariance technique for evaluating carbon dioxide exchange rates of ecosystems: past, present and future. Global Change Biology (2003) 9, 479-492.
Gockede M., C. Rebmann, and T. Foken. (2004). A combination of quality assessment tools for eddy covariance measurements with footprint modelling for the characterisation of complex sites. Agricultural and Forest Meteorology 127, 175-188.
Law, B. E., T. Arkebauer, J.L. Campbell, J. Chen, O. Sun, M. Schwartz ,C. van Ingen, and S. Verma. (2008). Terrestrial Carbon Observing Protocols for Vegetation Sampling and Data Submission. http://www.fao.org/gtos/doc/pub55.pdf
Moffat, A., D. Papale, M. Reichstein, D.Y. Hollinger, A.D. Richardson, A.G. Barr, C. Beckstein, B.H. Braswell, G. Churkina, A.R. Desai, E. Falge, J.H. Gove, M. Heimann, D. Hui, A.J. Jarvis, J. Kattge, A. Noormets, and V.J. Stauch. (2007). Comprehensive comparison of gap-filling techniques for eddy covariance net carbon fluxes. Agricultural and Forest Meteorology (147) 209-232.
NFI 2004A. v4.1.1. Canada's National Forest Inventory National Standard for Ground Plots: Data Dictionary.
NFI 2004B. v1.0. Canada's National Forest Inventory National Standard for Ground Plots: Ground Plot Appendices.
NFI 2004C. v3.2. Canada's National Forest Inventory: Design Overview.
NFI 2004D. v1.4. (Draft) Canada's National Forest Inventory National Standard for Ground Plots: Compilation Procedures.
NFI 2004E. v4.1. Canada's National Forest Inventory: Ground Sampling Guidelines.
NFI 2004F. v3.0. Canada's National Forest Inventory: Ground plot data upload and metadata specifications.
Papale, D., M. Reichstein, M. Aubinet, E. Canfora, C. Bernhofer, W. Kutsch, B. Longdoz, S. Rambal, R. Valentini, T. Vesala, and D. Yakir. (2006). Towards a standardized processing of Net Ecosystem Exchange measured with eddy covariance technique: algorithms and uncertainty estimation, Biogeosciences, (3), 571-583.
Papale D., Valentini R. (2003) A new assessment of European forests carbon exchanges by eddy fluxes and artificial neural network spatialization. Global Change Biology (9) 525-535.
Reichstein, M., E. Falge, D. Baldocchi, D. Papale, M. Aubinet, P. Berbigier, C. Bernhofer, N. uchmann, T. Gilmanov, A. Granier, T. Grunwald, K. Havrankova, H. Ilvesniemi, D. Janous, A. Knohl, T. Laurila, A. Lohila, D. Loustau, G. Matteucci, T. Meyers, F. Miglietta, J.M. Ourcival, J. Pumpanen, S. Rambal, E. Rotenberg, M. Sanz, J. Tenhunen, G. Seufert, F. Vaccari, T. Vesala, D. Yakir, and R. Valentini. 2005. On the separation of net ecosystem exchange into assimilation and ecosystem respiration: review and improved algorithm, Glob. Change Biol., 11, 1424–1439..