Get Data
Revision Date: April 25, 2014
Summary:
The data provided are annual land cover projections for years 2005 through 2095 generated by the Global Change Assessment Model (GCAM) Version 3.1. For the conterminous USA, the GCAM global gridded results were downscaled to ~5.6 km (0.05 degree) resolution. For each 5.6 x 5.6 km area, the annual land cover percentage comprised by each of the nineteen different land cover classes/plant functional types (PFTs) of the Community Land Model (CLM) (Table 1) are provided.
Results are reported for GCAM runs of three scenarios of future human efforts towards climate mitigation as related to global carbon emissions, radiative forcing, and land cover change. Specific scenario conditions were 1) a reference scenario with no explicit climate mitigation efforts that reaches a radiative forcing level of over 7 W/m2 in 2100, 2) the 2.6 mitigation pathway (MP) scenario which is a very low emission scenario with a mid-century peak in radiative forcing at ~3 W/m2, declining to 2.6 W/m2 in 2100, and 3) the 4.5 MP scenario which stabilizes radiative forcing at 4.5 W/m2 (~ 650 ppm CO2-equivalent) before 2100.
These downscaled land cover projections can be used to derive spatially explicit estimates of potential shifts in croplands, grasslands, shrub lands, and forest lands in each future climate scenario.
Data are presented as three NetCDF v4 files (.nc4), one for each future climate scenario -- 2.6 MP, 4.5 MP, and GCAM reference).
Data Citation:
Cite this data set as follows:
West, T.O. and Le Page, Y. 2014. CMS: Land Cover Projections (5.6-km) from GCAM v3.1 for Conterminous USA, 2005-2095. ORNL DAAC, Oak Ridge, Tennessee, USA. http://dx.doi.org/10.3334/ORNLDAAC/1216
Table of Contents:
- 1 Data Set Overview
- 2 Data Characteristics
- 3 Applications and Derivation
- 4 Quality Assessment
- 5 Acquisition Materials and Methods
- 6 Data Access
- 7 References
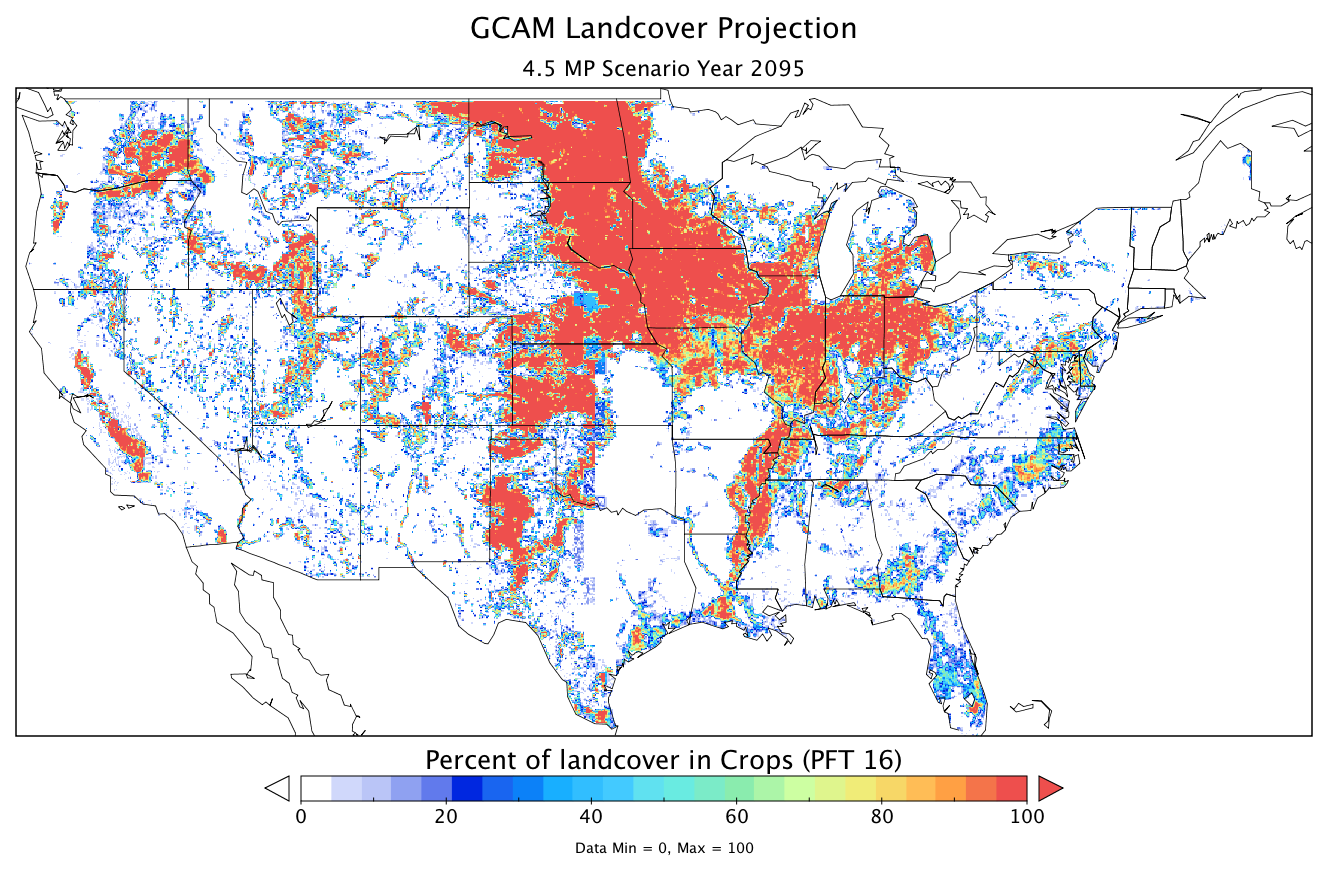
Figure 1. GCAM landcover projection for crops (PFT 16) in year 2095 under the 4.5 MP scenario.
1. Data Set Overview:
Project: Carbon Monitoring System (CMS)
Investigators: West, T.O. and Le Page, Y.
The Carbon Monitoring System (CMS) is a forward-looking initiative designed to make significant contributions in characterizing, quantifying, understanding, and predicting the evolution of global carbon sources and sinks through improved monitoring of carbon stocks and fluxes.
The data provided are annual land cover projections for years 2005 through 2095 generated by the Global Change Assessment Model (GCAM) Version 3.1. For the conterminous USA, the GCAM global gridded results were downscaled to ~5.6 km (0.05-degree) resolution. For each 5.6 x 5.6-km area, the annual land cover percentage comprised by each of the nineteen different land cover classes/plant functional types (PFTs) of the Community Land Model (CLM) (Table 1) are provided.
Results are reported for GCAM runs of three scenarios of future human efforts towards climate mitigation as related to global carbon emissions, radiative forcing, and land cover change. Specific scenario conditions were 1) a reference scenario with no explicit climate mitigation efforts that reaches a radiative forcing level of over 7 W/m2 in 2100, 2) the 2.6 mitigation pathway (MP) scenario which is a very low emission scenario with a mid-century peak in radiative forcing at ~3 W/m2, declining to 2.6 W/m2 in 2100, and 3) the 4.5 MP scenario which stabilizes radiative forcing at 4.5 W/m2 (~ 650 ppm CO2-equivalent) before 2100.
2. Data Characteristics:
Data are presented as three NetCDF v4 files (.nc4), one for each future climate scenario (2.6 MP, 4.5 MP, & GCAM reference).
- Each file contains land cover information for 91 years (2005 - 2095), in 0.05 x 0.05-degree grid cells over the continental USA.
- Data for each grid cell and year include the land cover percentage comprised of each of nineteen different land cover classes or plant functional types (PFTs), corresponding to the Community Land Model (CLM) PFT land cover classes (Table 1).
- Grid cells with no data (fill value or missing values) are represented by -1.
- Land cover percentages have a scale factor of 100; such that dividing the raw data values by 100 provides the actual percentage value for each land cover class ranging from 0 to 100%. Note that some grid cells do not total to 100% because they are on US or ocean borders.
Table 1. PFTs and land cover classes used in this data set.
| Code | Community Land Model PFT and Land Cover Classes |
|---|---|
| 1 | Water |
| 2 | Needleleaf Evergreen Trees - Temperate |
| 3 | Needleleaf Evergreen Trees - Boreal |
| 4 | Broadleaf Evergreen Trees - Tropical |
| 5 | Broadleaf Evergreen Trees - Temperate |
| 6 | Needleleaf Deciduous Trees - All |
| 7 | Broadleaf Deciduous Trees - Tropical |
| 8 | Broadleaf Deciduous Trees - Temperate |
| 9 | Broadleaf Deciduous Trees - Boreal |
| 10 | Broadleaf Evergreen Shrub - Temperate |
| 11 | Broadleaf Deciduous Shrub - Temperate |
| 12 | Broadleaf Deciduous Shrub - Boreal |
| 13 | C3 Grass - Arctic |
| 14 | C3 Grass - Non Arctic |
| 15 | C4 Grass |
| 16 | Crops |
| 17 | Urban |
| 18 | Snow and Ice |
| 19 | Barren or Sparse |
Spatial Coverage
Site boundaries: (All latitude and longitude given in decimal degrees)
| Site (Region) | Westernmost Longitude | Easternmost Longitude | Northernmost Latitude | Southernmost Latitude |
|---|---|---|---|---|
| Conterminous USA | -124.69 | 67.09 | 49.35 | 25.25 |
Spatial resolution
Grid cells at 0.05 x 0.05-degree (~5.6-km) resolution.
Time period
The data set covers the period 2005/01/01 to 2095/12/31.
Temporal resolution
Annual (assumed to represent the midpoint of each year).
Table 2. Data File Information
| File Name | Temporal Coverage | File Contents |
|---|---|---|
| GCAM_2p6_2005_2095.nc4 | 2005–2095 | Annual, gridded land cover percentages for the conterminous US projected for the 2.6 MP scenario |
| GCAM_4p5_2005_2095.nc4 | 2005–2095 | Annual, gridded land cover percentages for the conterminous US projected for the 4.5 MP scenario |
| GCAM_ref_2005_2095.nc4 | 2005–2095 | Annual, gridded land cover percentages for the conterminous US projected for the GCAM reference scenario |
3. Data Application and Derivation:
These downscaled data can be applied to analyses of environmental impacts at sub-regional and landscape scales and may provide relevant insights into the potential impacts of socio-economic and environmental drivers on future changes in land cover.
4. Quality Assessment:
Uncertainty in the model downscaling procedure was evaluated by comparing model projections for years 2005 - 2010 against historical land cover change in the US using MODIS PFT data and national inventory statistics. An evaluation of the downscaling method indicates that it is able to reproduce recent changes in cropland and grassland distributions (West et al. 2014). No formal statistical uncertainty is associated with the data set.
5. Data Acquisition Materials and Methods:
GCAM is a global integrated assessment model of human activities that contribute to greenhouse gas emissions (Kim et al., 2006 and Clarke et al., 2007). Downscaling GCAM land projections to a gridded land realization requires baseline land cover data, reconciliation of land classes among datasets, reconciliation of land areas among datasets, and final spatial distribution of projected land cover. Data inputs for downscaling and methods of reconciling and distributing land class areas are described below.
Baseline land cover data and future scenarios
The MODIS (MCD12Q1) version 5.1 land cover product using the Plant Functional Type (PFT) Type 5 classification at 500m resolution for year 2005 was gridded to 0.05 degree resolution for use as baseline land cover data. Three scenarios of future human activities, including land cover change, were generated with the GCAM model version 3.1, and used here: 4.5 MP, 2.6 MP and a reference scenario. The two mitigation pathways (MP) are defined by their radiative forcing in the year 2100 (i.e., 4.5 and 2.6 W/m2) and are based on the Representative Concentration Pathways (Moss et al 2010) used in CMIP5 (Taylor et al 2012).
Reconciling land classes and land areas
Recategorization of land classes from GCAM to MODIS requires reconciling of land categories (see West et al. 2014, Table 1). Reconciling land areas is also necessary and is completed for the initial base year and then for each subsequent year. The GCAM first begins with total land area per Agroecological Zone (AEZ) region (Kyle et al 2011) and then simulates changes in land areas per AEZ over time. In order to maintain consistency with the GCAM modeling framework, downscaling of GCAM land areas must be consistent with land areas used in GCAM over the simulation period. The method used here first compares GCAM land area with MODIS land area, based on reconciled land classes, and then adjusts MODIS PFT land areas to represent areas of respective GCAM land classes in the base year and in future years. MODIS land area is adjusted per land class within each AEZ, based on spatial distribution rules.
Spatial distribution of land cover change
The spatial location of land change per land class and per AEZ is determined by the density and distance of each land class relative to each grid cell. For example, if croplands are expanding or contracting, they will do so according to the density of existing agricultural lands over the landscape. A density-weighted distance index, or kernel density, was generated for all PFT classes and for each grid cell independent of AEZ boundaries (see West et al. 2014, Figure 3). When multiple land classes are changing simultaneously, a predetermined hierarchy of land cover change determines the order of land cover change. For example, agriculture will displace grass, shrub, and forests in that order. The reverse is true for an increase in forest land. This hierarchy represents the relative cost of land cover change associated with each PFT. While GCAM runs on a 5-year time step, here land cover change is interpolated linearly and annually for non-simulated years, thereby enabling annual gridded land realizations.
Integration of land classes and climate regimes
Following the spatial distribution of land areas into MODIS PFT land classes, a climate dataset consisting of monthly mean precipitation, temperature, and annual growing degree days (New et al 2002) was spatially superimposed on the land to further disaggregate land classes into temperate, tropical, and boreal climate regions. The climate classes are assigned following the method applied by Bonan et al (2002) and subsequently result in a combination of land classes and climate regimes that coincide with those used by the CLM (Oleson et al 2010).
6. Data Access:
This data is available through the Oak Ridge National Laboratory (ORNL) Distributed Active Archive Center (DAAC).
Data Archive Center:
Contact for Data Center Access Information:
E-mail: uso@daac.ornl.gov
Telephone: +1 (865) 241-3952
7. References:
Bonan, G.B., S. Levis, L. Kergoat, and K.W. Oleson. 2002. Landscapes as patches of plant functional types: an integrating concept for climate and ecosystem models. Glob Biogeochem Cycl 16: 5-1 - 5-25 doi: 10.1029/2000GB001360.
Clarke, L., J.Edmonds, H. Jacoby, H. Pitcher, J. reilly, and R. Richels. 2007. CCSP Synthesis and Assessment Product 2.1, Part A: Scenarios of Greenhouse Gas Emissions and Atmospheric Concentrations. U.S. Government Printing Office, Washington, DC.
Kim, S.H., J. Edmonds, J. Lurz, S. Smith, and M. Wise. 2006. The ObjECTS framework for integrated assessment: hybrid modeling of transportation. Energy Journal 27: 63–91.
Kyle, G.P., P. Luckow P, K.V.Calvin, W.R. Emanuel, M. Nathan, and Y. Zhou. 2011. GCAM 3.0 Agriculture and land Use: Data sources and methods. PNNL-21025 (Richland, Washington: Pacific Northwest National Laboratory).
Moss, R. H., J.A. Edmonds, K.A. Hibbard, K A, M.R. Manning, S.K. Rose, D.P. van Vuuren, T.R. Carter, S. Emori, M. Kainuma, T. Kram, G.A. Meehl, J.F.B. Mitchell, N. Nakicenovic, K. Riahi, S.J. Smith, R.J. Stouffer, A.M. Thomson, J.P. Weyant, and T.J. Wilbanks. 2010. The next generation of scenarios for climate change research and assessment. Nature 463: 747-756.
New, M., D. Lister, M. Hulme, and I. Makin. 2002. A high-resolution data set of surface climate over global land areas. Clim Res 21: 1-25.
Oleson, K.W., D.M. Lawrence, G.B. Bonan, G. Flanner, E. Kluzek, P.J. Lawrence, S. Levis, S. C. Swenson, P.E. Thornton, 2010. Technical description of version 4.0 of the Community Land Model (CLM) NCAR/TN-478+STR (Boulder, Colorado: National Center for Atmospheric Research).
Taylor, K.E., R.J. Stouffer, and G.A. Meehl. 2012. An overview of CMIP5 and the experiment design B Am Meteorol Soc 93: 485-498, doi:10.1175/BAMS-D-11-00094.1
Thomson, A.M., G.P. Kyle, X. Zhang, V. Bandaru, T.O. West, M.A. Wise, R.C. Izaurralde, and K.V.Calvin. 2013. The contribution of future agricultural trends in the US Midwest to global climate change mitigation. Glob Environ Change 24: 143-154. doi: 10.1016/j.gloenvcha.2013.11.019
West, T.O., Y. Le Page, M. Huang, J. Wolf, and A. Thomson. 2014. Downscaling Global Land Cover Projections from an Integrated Assessment Model for Use in Regional Analyses: Results and Evaluation for the US from 2005 to 2095.Earth Interactions. In press.