Documentation Revision Date: 2018-01-11
Summary
Estimates were derived using field-based measurements and a RandomForest model which correlated Geoscience Laser Altimeter System (GLAS) LiDAR data, Landsat 7 Enhanced Thematic Plus (ETM+) satellite imagery, reflectance, elevation, and biophysical variables. A separate RandomForest model was trained for each continent using a stratified sampling design of roughly 13,000 GLAS-based biomass estimates for each model.
There are three data files in GeoTIFF (.tif) format with this data set.
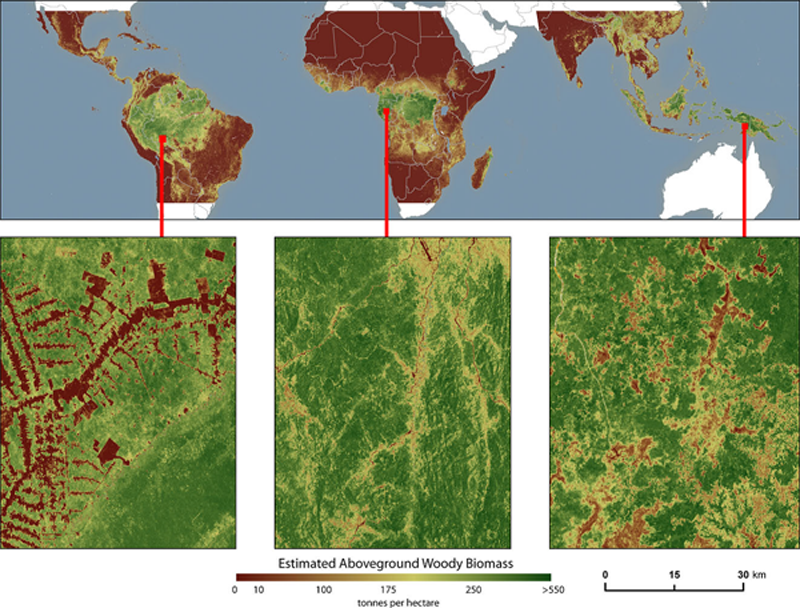
Figure 1. AGLB across tropical America, Africa, and Asia. Pre-deforestation biomass (year 2000) provided for deforested areas (insets). (Zarin et al., 2016)
Citation
Baccini, M., W. Walker, M. Farina, and R.A. Houghton. 2018. CMS: Estimated Deforested Area Biomass, Tropical America, Africa, and Asia, 2000. ORNL DAAC, Oak Ridge, Tennessee, USA. https://doi.org/10.3334/ORNLDAAC/1337
Table of Contents
- Data Set Overview
- Data Characteristics
- Application and Derivation
- Quality Assessment
- Data Acquisition, Materials, and Methods
- Data Access
- References
Data Set Overview
This data set provides estimates of pre-deforestation aboveground live woody biomass (AGLB) at 30-m resolution for deforested areas of tropical America, tropical Africa, and tropical Asia for the year 2000. The biomass estimates are only for areas where deforestation occurred during the period 2000 through 2012. These estimates represent biomass loss over this time period and can be used to derive average annual carbon emissions from tropical deforestation.
Estimates were derived from ground-based measurements of forest biomass density and co-located Geoscience Laser Altimeter System (GLAS) LiDAR waveform metrics to estimate the biomass density of more than 40,000 GLAS footprints throughout the tropics. Then, using RandomForest models, the GLAS-derived estimates of biomass density were correlated to spatially continuous data sets including Landsat 7 ETM+ satellite imagery and products (e.g.reflectance), elevation, and biophysical variables. A separate RandomForest model was trained for each continent using a stratified sampling design of roughly 13,000 GLAS-based biomass estimates for each model (Zarin et al., 2016).
Project: Carbon Monitoring System (CMS)
The NASA Carbon Monitoring System (CMS) is designed to make significant contributions in characterizing, quantifying, understanding, and predicting the evolution of global carbon sources and sinks through improved monitoring of carbon stocks and fluxes. The System will use the full range of NASA satellite observations and modeling/analysis capabilities to establish the accuracy, quantitative uncertainties, and utility of products for supporting national and international policy, regulatory, and management activities. CMS will maintain a global emphasis while providing finer scale regional information, utilizing space-based and surface-based data and will rapidly initiate generation and distribution of products both for user evaluation and to inform near-term policy development and planning.
Related Publication:
Zarin, D. J., et al. (2016), Can carbon emissions from tropical deforestation drop by 50% in 5 years?. Glob Change Biol, 22: 1336–1347. http://dx.doi.org/10.1111/gcb.13153
Data Characteristics
Spatial Coverage: Tropical regions of America, Africa, and Asia
Spatial Resolution: 30 meter
Temporal Resolution: One-time estimate for the year 2000
Temporal Coverage: Data are based on deforestation between 20000101 to 20121231
Spatial Extent: (All latitude and longitude given in decimal degrees)
| Sites | Westernmost Longitude | Easternmost Longitude | Northernmost Latitude | Southernmost Latitude |
|---|---|---|---|---|
| Tropical regions of America, Africa, and Asia | -119 | 180 | 30 | -29.99 |
Data File Information
There are three files in GeoTIFF (.tif) format with this data set. The pixel values are estimates of aboveground live biomass in the year 2000, in units of Mg biomass per hectare.
Data file names:
AGLB_Deforested_Tropical_Africa_2000.tif
AGLB_Deforested_Tropical_America_2000.tif
AGLB_Deforested_Tropical_Asia_2000.tif
The following spatial properties are common to all three files.
Spatial Data Properties
Spatial Representation Type: Raster
Pixel Depth: 16 bit
Pixel Type: Integer
Compression Type: LZW
Number of Bands: 1
Raster Format: TIFF
Source Type: area
No Data Value: -32768
Scale Factor: 1
Column Resolution: 0.000278 degrees (~30 meters)
Row Resolution: 0.000278 degrees (~30 meters)
Spatial Reference Properties
Type: Geographic
Geographic Coordinate Reference: WGS 84
Projection: none
Open Geospatial Consortium (OGC) Well Known Text (WKT)
GEOGCS["WGS 84",
DATUM["WGS_1984",
SPHEROID["WGS 84",6378137,298.257223563,
AUTHORITY["EPSG","7030"]],
AUTHORITY["EPSG","6326"]],
PRIMEM["Greenwich",0],
UNIT["degree",0.0174532925199433],
AUTHORITY["EPSG","4326"]]
The following spatial properties are unique to each file.
| File name | min_x | min_y | max_x | max_y | n_cols | n_rows |
| AGLB_Deforested_Tropical_Africa_2000.tif | -25.9999 | -29.9999 | 59.99986 | 30.00014 | 309,599 | 216,000 |
| AGLB_Deforested_Tropical_Asia_2000.tif | 67.99986 | -19.9999 | 179.9999 | 30.00014 | 403,200 | 180,000 |
| AGLB_Deforested_Tropical_America_2000.tif | -119 | -29.9999 | -32.0001 | 30.00014 | 313,199 |
216,000 |
Application and Derivation
From these estimates, average annual carbon emissions from tropical deforestation can be derived as discussed in Zarin et al. (2016).
Quality Assessment
Uncertainty was analyzed for the underlying data products used in this analysis (Zarin et al., 2016).
Data Acquisition, Materials, and Methods
RandomForest models were used to estimate aboveground live biomass in areas where deforestation had occurred within the period 2000 through 2012. The input data included ground-based data, Landsat 7, deforestation data sets, GLAS LiDAR, Normalized Difference Vegetation Index (NDVI), and the Normalized Difference Infrared Index (NDII), and biophysical predictor variables (Zarin et al., 2016).
Deforestation Areas
The deforested areas for the period 2000 through 2012 were determined from the Hansen et al. (2013) data set which provides annual deforestation data derived from satellite imagery. Additional national-level deforestation data were obtained for countries where gross deforestation had occurred, including: Brazil, Indonesia, Democratic Republic of the Congo (DRC), Malaysia, Colombia, Ecuador, Guyana, and Mexico (Zarin et al., 2016).
Biomass Modeling Steps
The ground-based measurements of tree stem diameter at breast height (DBH of all living trees greater than or equal to 5 cm (Baccini et al., 2012) ) were collected as part of a large-scale field campaign throughout the tropics. The measurements were collected within 40-m by 40-m square plots centered within GLAS LiDAR footprints (circular footprints with 70-m diameter) and converted to biomass estimates using allometric equations from Chave et al. (2005). By linking estimates of ground-based biomass density estimates with co-located GLAS LiDAR data, a multiple regression equation was developed that predicted biomass density based on GLAS LiDAR waveform metrics. This multiple regression equation was then applied to roughly 40,000 GLAS LiDAR footprints across the tropics, yielding an estimate of biomass for each LiDAR footprint (Zarin et al., 2016).
Statistical models were developed that related the GLAS-based biomass estimates to Landsat imagery reflectance in the red band, near-infrared band, and two shortwave-infrared bands (corresponding to bands 3, 4, 5, and 7), the Normalized Difference Vegetation Index (NDVI), and the Normalized Difference Infrared Index (NDII), and also to the percent of tree canopy cover from the Global Forest Change data set (Hansen et al., 2013).
Additional data sets used as predictors in the RandomForest models included 3-arc second SRTM elevation data and gridded biophysical data at 1-km resolution resampled at 30 meters to match with the reflectance data (Hijmans et al. 2005). Among the biophysical predictor variables, continental models used precipitation, maximum temperature, temperature seasonality, the minimum temperature of the coldest month, the temperature annual range, annual precipitation, precipitation of the driest quarter, and precipitation of the coldest quarter (Zarin et al., 2016).
A separate RandomForest model was trained for each continent - tropical America, Africa, and Asia - using a stratified sampling design of roughly 13,000 GLAS-based biomass estimates for each model (Zarin et al., 2016). This work yielded a wall-to-wall 30-m resolution map of aboveground woody biomass density across the tropics. See Baccini et al., (2015) for access to this map.
Estimates of Pre-deforestation Aboveground Live Woody Biomass
These continent-wide 30-m resolution maps allow for the co-location of biomass estimates with Hansen et al. (2013, v1.0) and the additional national tree cover loss/deforestation data. The areas of deforestation for the period 2000 through 2012 were subset from the continental maps. The results are estimates of pre-deforestation aboveground live woody biomass for the year 2000, in units of Mg biomass per hectare, for these areas.
Data Access
These data are available through the Oak Ridge National Laboratory (ORNL) Distributed Active Archive Center (DAAC).
CMS: Estimated Deforested Area Biomass, Tropical America, Africa, and Asia, 2000
Contact for Data Center Access Information:
- E-mail: uso@daac.ornl.gov
- Telephone: +1 (865) 241-3952
References
Baccini, A., S. J. Goetz, W.S. Walker, N.T. Laporte, M. Sun, D. Sulla-Menashe, J. Hackler, P.S.A. Beck, R. Dubayah, M.A. Friedl, S. Samanta and R.A. Houghton. Estimated carbon dioxide emissions from tropical deforestation improved by carbon-density maps. Nature Clim. Change 2, 182–185 (2012). URL http://dx.doi.org/10.1038/nclimate1354.
Baccini A., W. Walker, L. Carvahlo, M. Farina, D. Sulla-Menashe, R. Houghton (2015). Tropical forests are a net carbon source based on new measurements of gain and loss. Science. Vol. 358. Issue 6360, pp. 230-234. https://doi.org/10.1126/science.aam5962
Chave, J., C. Andalo, S. Brown, M.A. Cairns, J.Q. Chambers, D. Eamus, H. Folster, F. Fromard, N. Higuchi, T. Kira, J. P. Lescure, B.W. Nelson, H. Ogawa, H. Puig, B. Riera, and T. Yamakura. 2005. Tree allometry and improved estimation of carbon stocks and balance in tropical forests. Oecologia 145, 87–99 (2005). http://dx.doi.org/10.1007/s00442-005-0100-x
Hansen, M.C., P.V. Potapov, R. Moore, M. Hancher, S. A. Turubanova, A. Tyukavina, D. Thau, S.V. Stehman, S. J. Goetz, T.R. Loveland, A. Kommareddy, A. Egorov, L. Chhini, C.O. Justice, and J.R.G. Townshend.(2013) High-resolution global maps of 21st century forest change. Science, 342, 850–853. http://dx.doi.org/10.1126/science.1244693
Hijmans, R.J., S.E. Cameron, J.L. Parra, P.G. Jones, and A. Jarvis. Very high resolution interpolated climate surfaces for global land areas. International Journal of Climatology 25, 1965–1978 (2005). http://dx.doi.org/10.1002/joc.1276 Data available at: http://www.worldclim.org/version1
Zarin, D. J., Harris, N. L., Baccini, A., Aksenov, D., Hansen, M. C., Azevedo-Ramos, C., Azevedo, T., Margono, B. A., Alencar, A. C., Gabris, C., Allegretti, A., Potapov, P., Farina, M., Walker, W. S., Shevade, V. S., Loboda, T. V., Turubanova, S. and Tyukavina, A. (2016), Can carbon emissions from tropical deforestation drop by 50% in 5 years?. Glob Change Biol, 22: 1336–1347. http://dx.doi.org/10.1111/gcb.13153