Documentation Revision Date: 2016-11-15
Data Set Version: V1
Summary
Each Canopy Height Model (CHM) was resampled to 1m x 1m to match the spatial sampling of the airborne Lidar data set. All data sets were clipped to the extent of the Lidar coverage and subsequently masked to the regions of mangrove tree cover identified by Giri et al. 2014. Each CHM covered an approximate mangrove area of 6118 ha.
There are three GeoTIFF files (.tif) with this data set.

Figure 1. Canopy Height Models (CHMs) for a region of the Zambezi Delta: Airborne Lidar, VHR Stereo, and TanDEM-X (TDX) (after Lagomasino et al., 2016).
Citation
Lagomasino, D., T. Fatoyinbo, S. Lee, E. Feliciano, M. Simard, and C. Trettin. 2016. CMS: Mangrove Canopy Height Estimates from Remote Imagery, Zambezi Delta, Mozambique. ORNL DAAC, Oak Ridge, Tennessee, USA. http://dx.doi.org/10.3334/ORNLDAAC/1357
Table of Contents
- Data Set Overview
- Data Characteristics
- Application and Derivation
- Quality Assessment
- Data Acquisition, Materials, and Methods
- Data Access
- References
Data Set Overview
This data set provides canopy height estimates for mangrove forests in the Zambezi Delta, Mozambique, Africa. The estimates were derived from three separate canopy height models (CHM) using airborne lidar, stereophotogrammetry with WorldView 1 imagery, and Interferometric-Synthetic Aperture Radar (In-SAR) techniques with TanDEM-X imagery. The data cover the period 2011-10-14 to 2014-05-06. Each CHM was resampled to 1m x 1m to match the spatial sampling of the airborne Lidar data set. All data sets were clipped to the extent of the Lidar coverage and subsequently masked to the regions of mangrove tree cover identified by Giri et al. 2014. Each CHM covered an approximate mangrove area of 6,118 ha.
Project: Carbon Monitoring System (CMS)
The NASA Carbon Monitoring System (CMS) is designed to make significant contributions in characterizing, quantifying, understanding, and predicting the evolution of global carbon sources and sinks through improved monitoring of carbon stocks and fluxes. The System will use the full range of NASA satellite observations and modeling/analysis capabilities to establish the accuracy, quantitative uncertainties, and utility of products for supporting national and international policy, regulatory, and management activities. CMS will maintain a global emphasis while providing finer scale regional information, utilizing space-based and surface-based data and will rapidly initiate generation and distribution of products both for user evaluation and to inform near-term policy development and planning.
Related Publication:
Lagomasino, D., Fatoyinbo, T., Lee, S., Feliciano, L., Trettin, C., and Simard, M. A Comparison of Mangrove Canopy Height Using Multiple Independent Measurements from Land, Air, and Space. Remote Sens. 2016, 8(4), 327; http://dx.doi.org/10.3390/rs8040327
Related Data Set:
Lagomasino, D., and T. Fatoyinbo. 2016. CMS: Mangrove Canopy Height from High-resolution Stereo Image Pairs, Mozambique, 2012. ORNL DAAC, Oak Ridge, Tennessee, USA. http://dx.doi.org/10.3334/ORNLDAAC/1327
Data Characteristics
Spatial Coverage: Zambezi River Delta, Mozambique
Spatial Resolution: 1m x 1m and 12m x 12m
Temporal Coverage: Data covers the period 2011-10-14 to 2014-05-06
Temporal Resolution: One time estimate
Study Area (All latitudes and longitudes are given in decimal degrees)
| Site | Westernmost Longitude | Easternmost Longitude | Northernmost Latitude | Southernmost Latitude |
|---|---|---|---|---|
| Zambezi Delta, Mozambique, Africa | 36.11861 | 36.33889 | -18.6269 | -18.915 |
Data Description
Data Files
There are three GeoTIFF data files with this data set. The files provides estimated top canopy height for mangrove forests in the Zambezi Delta, Mozambique.
Data file names and descriptions
| File name | Description |
|---|---|
| Zambezi_Lidar_CHM.tif | Canopy height derived from airborne laser/Lidar scanning (ALS). ALS and multispectral data (NIR, Red, Green bands) were acquired 5-6 May 2014. |
| Zambezi_VHR_CHM.tif | Canopy height derived from one pair of VHR stereoimages from WorldView1 collected over the Zambezi Delta on 7 January 2013 |
| Zambezi_TDX_CHM.tif | Canopy height derived from TanDEM-X (TerraSAR-X add-on for Digital Elevation Measurements). The TDX data were acquired on 14 October 2011 |
GEoTIFF File Properties
Properties common to all files:
| Datum | File type | Data type | Fill value | # Bands |
|---|---|---|---|---|
| WGS84 | raster | Float32 | -99 | 1 |
Properties of individual files
| Data File | min_lon | min_lat | max_lon | max_lat | # Columns | # Rows | Min value – Max value | Map units |
|---|---|---|---|---|---|---|---|---|
| Zambezi_Lidar_CHM.tif | 36.13556 | -18.8981 | 36.28806 | -18.7964 | 14,928 | 12,221 | 1 - 29.9 | meter |
| Zambezi_VHR_CHM.tif | 36.11861 | -18.915 | 36.32194 | -18.7794 | 31,752 | 20,057 | 3.5 – 79.3 | degree |
| Zambezi_TDX_CHM.tif | 36.13556 | -18.915 | 36.33889 | -18.6269 | 11,318 | 15,634 | 0.7 – 45.4 | degree |
Application and Derivation
Mangroves may only represent 3% of the global forest cover, but it has been estimated that at the current rates of degradation, these forests can release up to 10% of the total carbon emissions from deforestation worldwide (Donato et al., 2011). The large carbon stocks along with the many economical ecosystem services, high rates of degradation, and threats from rising seas, make mangrove environments important regions of interest for climate mitigation and adaptation plans (Alongi et al., 2002). Remote sensing can provide multiple independent techniques to monitor and verify forest parameters such as canopy height.
Quality Assessment
General statistics including the mean, median, and standard deviations were determined for each of the CHMs. A comparative analysis was performed using root-mean-square-error (RMSE).
The airborne CHM was used as a reference to assess the spaceborne CHMs. Canopies over 10-m were accurately predicted by all CHMs while the distributions of canopy height were best predicted by the VHR CHM (Lagomasino et al., 2016).
Data Acquisition, Materials, and Methods
Site Description
Top of canopy height estimates are provided for mangrove forests in the Zambezi Delta, Mozambique, Africa. The Zambezi River sheds water from a 1,570,000 km2 area encompassing eight African countries and eventually discharges into the Indian Ocean via the Zambezi Delta. The wet season occurs from April to October with approximately 1,000 to 1,400 mm annual rainfall.
Methods
Canopy height models were derived using airborne lidar, stereophotogrammetry with WorldView 1 imagery, and Interferometric-Synthetic Aperture Radar (In-SAR) techniques with TanDEM-X imagery. The CHMs were compared to the Lidar data and data collected from a field survey conducted in 2012 and 2013.
Airborne Laser/LiDAR Scanning
To compare, enhance, and validate spaceborne-based assessments, ALS and multispectral data (NIR, Red, Green bands) were acquired 5–6 May 2014 by Land Resources International (Pietermaritzburg, South Africa). The airborne survey comprised an approximate area of 115 km2 in the Zambezi Delta with a point density that ranged between 5 and 7 points per m2 (Lagomasino et al., 2016).
- First ALS returns (canopy returns), which mark the location of tree canopies, were used to generate a 1m × 1m resolution mangrove Digital Surface Models (DSM). The DSM was generated using ENVI/IDL software by selecting and gridding the highest elevation value falling into each grid.
- Mangrove canopy heights were calculated relative to the Earth Gravitational Model 2008 (EGM2008) geoid
- The mangrove DSM was georeferenced into a WGS84 datum and UTM Zone 36 South projection.
TanDEM-X
The TanDEM-X (TerraSAR-X add-on for Digital Elevation Measurements) mission forms a pair of satellite instruments that enable single-pass interferometry to generate a consistent global digital elevation model (DEM) (Krieger et al., 2007). The TDX data were acquired on 14 October 2011 with a height of the ambiguity of -80.91 m. The swath of the TDX was about 32 km (Lagomasino et al., 2016).
Very High-Resolution Stereophotogrammetry- stereoimages from WorldView1
One pair of orthorectified pairs of VHR stereo images from WV-1 (DigitalGlobe, Longmont, CO) were collected over the Zambezi Delta on 7 January 2013. (Lagomasino et al., 2016). The panchromatic image pairs were acquired via an agreement with Digital Globe and the National Geospatial Intelligence Agency (NGA). The image pairs were acquired in along-track setting to reduce confounding issues related to date and time collection, and sensor angles. In other words, the two images were collected in the same orbit using an optimized satellite viewing and sun angle geometry to improve accuracy and corrections. The images were processed using the NASA Ames Stereo Pipeline (ASP) digital surface model (DSM) tool (Lagomasino et al., 2016).
A digital surface model (DSM) of the Zambezi Delta was derived using the ASP program (for more information, see Lagomasino et al., 2015):
- Digital image matching (identification of ground control points (GCP’s) appearing within the overlap portion of the left and right images associated with a DSM): An image correlation routine within the the ASP was used to match similar pixels on each stereo pair and calculate the distance between the image focal plane and the Earth’s surface using epipolar geometry (Ni et al., 2014). The affine adaptive window mode option (subpixel mode = 2) was used to estimate the most accurate surface elevation relative to the WGS84 ellipsoid.
- Non-mangrove areas were masked from the DSM analyses using a combination of an unsupervised classification and manual interpretations from the VHR data. The unsupervised classification was performed using ENVI 5.1 using 10 classes (Exelis Visual Information Solutions; Boulder, CO) and applied to a Landsat 8 OLI image that was acquired on August 23, 2014 (row 78 path 167). A quality control comparison was made between the unsupervised classification, a recent global mangrove cover map by Giri et al. (2011) and from visual interpretations of high-resolution imagery.
- After the comparison, the bare ground surfaces (e.g., lighting gaps, mud flats) within the mangrove zone were identified manually in order to correct the DSM.
- Individual layers were created from each of the bare ground surfaces (ground) and overlaid on the DSM.
- The minimum, maximum, mean and standard deviation were calculated from the extracted elevation data for each layer. The product of the ground layer area and mean elevation was summed for all delineated ground surfaces and then divided by the total area of all ground surfaces.
- Forest canopy height estimates were then produced from the subtraction of the mean-weighted ground elevation from the original DSM, resulting in mangrove canopy height surface. Canopy height estimates are based on the assumption that the ground surface within the mangrove zone is relatively flat and thereby, the ground creates a spatially extensive, flat surface to easily subtract from the DSM.
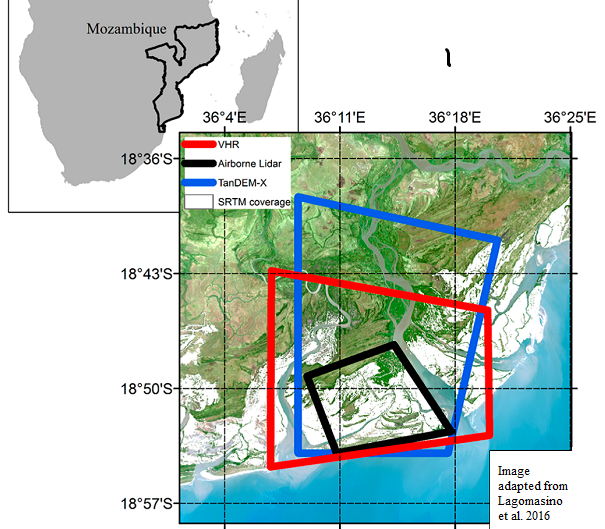
Figure 2. Location of the Zambezi Delta along the coast of Mozambique. Canopy Height Models were generated over parts of the delta; airborne Lidar (black outline; very-high resolution satellite imagery (red outline); TanDEM-X (blue outline); and SRTM (white area)- refer to Lagomasino et al. 2016 for additional information.
Data Access
These data are available through the Oak Ridge National Laboratory (ORNL) Distributed Active Archive Center (DAAC).
CMS: Mangrove Canopy Height Estimates from Remote Imagery, Zambezi Delta, Mozambique
Contact for Data Center Access Information:
- E-mail: uso@daac.ornl.gov
- Telephone: +1 (865) 241-3952
References
Alongi, D.M. Present state and future of the world’s mangrove forests. Environ. Conserv. 2002, 29, 331-349.
Donato, D.C., Kauffman, J.B., Murdiyarso, D., Kurnianto, S., Stidham, M., and Kanninen, M. Mangroves among the most carbon-rich forests in the tropics. Nat. Geosci. 2011, 4, 293-297.
Fatoyinbo, T.E., and Simard, M. Height and biomass of mangroves in Africa from ICESat/GLAS and SRTM. Int. J. Remote Sens. 2013, 34, 668–681.
Giri, C., Ochieng, E., Tieszen, L.L., Zhu, Z., Singh, A., Loveland, T., Masek, J., Duke, N. Status and distribution of mangrove forests of the world using earth observation satellite data. Glob. Ecol. Biogeogr. 2011, 20, 154-159.
Hajnsek, I., Kugler, F., Lee, S.-K., Papathanassiou, K.P. Tropical-forest-parameter estimation by means of Pol-InSAR: The INDREX-II campaign. IEEE Trans. Geosci. Remote Sens. 2009, 47, 481-493.
Krieger, G., Moreira, A., Fiedler, H., Hajnsek, I., Werner, M., Younis, M., Zink, M. TanDEM-X: A satellite formation for high-resolution SAR interferometry. IEEE Trans. Geosci. Remote Sens. 2007, 45, 3317-3341.
Lagomasino, D., Fatoyinbo, T., Lee, S., Feliciano, L., Trettin, C., and Simard, M. A Comparison of Mangrove Canopy Height Using Multiple Independent Measurements from Land, Air, and Space. Remote Sens. 2016, 8(4), 327; doi:10.3390/rs8040327
Lagomasino, D., Fatoyinbo, T. Lee, S., and Simard, M. High-resolution forest canopy height estimation in an African blue carbon ecosystem. Remote Sens. Ecol. Conserv. 2015, 1, 51–60. http://dx.doi.org/10.1002/rse2.3
Ni, W., Ranson, K.J., Zhang, Z., and Sun, G. Features of point clouds synthesized from multi-view ALOS/PRISM data and comparisons with lidar data in forested areas. Remote Sens. Environ. 2014, 149, 47–57.
Stringer, C.E., Trettin, C.C., Zarnoch, S.J., and Tang, W. Carbon stocks of mangroves within the Zambezi River Delta, Mozambique. For. Ecol. Manag. 2015, 354, 139–148.