Documentation Revision Date: 2016-06-29
Summary
The WV-1 very high resolution panchromatic imagery has spatial resolution of 0.6 x 0.6 m with a spectral range of 400-900 nm.
There is one file in GeoTIFF (.tif) format with this data set.
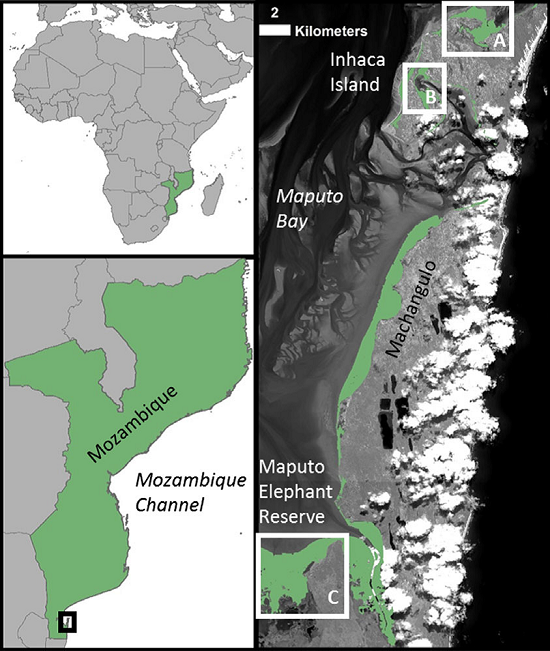
Figure 1. Location of study sites on Inhaca Island (A and B) and Maputo Elephant Reserve (C) in southern Mozambique. From Lagomasino et al. (2015).
Citation
Lagomasino, D., and T. Fatoyinbo. 2016. CMS: Mangrove Canopy Height from High-resolution Stereo Image Pairs, Mozambique, 2012. ORNL DAAC, Oak Ridge, Tennessee, USA. http://dx.doi.org/10.3334/ORNLDAAC/1327
Table of Contents
- Data Set Overview
- Data Characteristics
- Application and Derivation
- Quality Assessment
- Data Acquisition, Materials, and Methods
- Data Access
- References
Data Set Overview
Project: Carbon Monitoring System (CMS)
This data set provides canopy height estimates for mangrove forests in three study sites located in southeastern Mozambique, Africa: two sites on Inhaca Island and one in the Maputo Elephant Reserve, located in the southern province of Maputo for September, 2012. Measurements were estimated from VHR stereo images from WV-1 using the Ames Stereo Pipeline (ASP) digital surface model (DSM) tool. The methodology for deriving the canopy height using the ASP DSM tool consisted of:
- Digital image matching (identification of ground control points (GCP’s) appearing within the overlap portion of the left and right images associated with a DSM.
- Masking of non-mangrove areas from the DSM using a combination of an unsupervised classification and manual interpretations from the VHR data.
- Correcting the DSM -identification of the bare ground surfaces (e.g., lighting gaps, mud flats) within the mangrove zone.
- Creation of individual layers from each of the bare ground surfaces (ground) and then overlaying onto the DSM.
- Calculation of the minimum, maximum, mean and standard deviation from the extracted elevation data for each layer.
- Subtracting the mean-weighted ground elevation from the original DSM, resulting in mangrove canopy height surface. Canopy height estimates are based on the assumption that the ground surface within the mangrove zone is relatively flat.
The NASA Carbon Monitoring System (CMS) is designed to make significant contributions in characterizing, quantifying, understanding, and predicting the evolution of global carbon sources and sinks through improved monitoring of carbon stocks and fluxes. The System will use the full range of NASA satellite observations and modeling/analysis capabilities to establish the accuracy, quantitative uncertainties, and utility of products for supporting national and international policy, regulatory, and management activities. CMS will maintain a global emphasis while providing finer scale regional information, utilizing space-based and surface-based data and will rapidly initiate generation and distribution of products both for user evaluation and to inform near-term policy development and planning.
Related Publication:
Lagomasino, D., Fatoyinbo, T. Lee, S., and Simard, M. 2015. High-resolution forest canopy height estimation in an African blue carbon ecosystem. Remote Sens. Ecol. Conserv. 1, 51–60. http://dx.doi.org/10.1002/rse2.3
Acknowledgements:
This work was conducted at the NASA Goddard Space Flight Center and supported by the NASA Land Use/Land Cover Change Program and Carbon Monitoring System Program.
Data Characteristics
Spatial Coverage: Three sites in southern province of Maputo, Mozambique.
Spatial Resolution: 0.6 m x 0.6 m
Temporal Coverage: Data covers the period 2012-09-01 to 2012-09-30
Temporal Resolution: One time estimate
Study Area (All latitudes and longitudes are given in decimal degrees)
|
Site |
Westernmost Longitude |
Easternmost Longitude |
Northernmost Latitude |
Southernmost Latitude |
|
Southeastern Mozambique, Africa |
32.813333 |
32.999722 |
-25.982778 |
-26.38888 |
Data Description
Data Files
There is one GeoTIFF data file with this data set. The file provides estimated canopy height for mangrove forests on Inhaca Island and southeastern Mozambique. Pixel values are in centimeters.
Data file: Mangrove_CanopyHeight_Mozambique_VHR.tif
Spatial Properties
Spatial Representation Type: Raster
Pixel Depth: 32 bit
Pixel Type: Integer
Compression Type: LZW
Number of Bands: 1
Raster Format: TIFF
No Data Value: -2147483648
Scale Factor: 1
Value Range: 2,150
Cell Geometry: area
Number Columns: 29,278
Column Resolution: 0.6 meter
Number Rows: 67,337
Row Resolution: 0.6 meter
Extent in the data file's coordinate system:
North: 25d58’12.70”S
South: 26d20'17.72"S
West: 32d48'51.81"E
East: 32d59'31.27"E
Spatial Reference Properties
Type: Projected
Projection: Albers_Conic_Equal_Area
Geographic Coordinate Reference: WGS 1984
Open Geospatial Consortium (OGC) Well Known Text (WKT):
PROJCS["UTM_Zone_36S",
GEOGCS["WGS 84",
DATUM["WGS_1984",
SPHEROID["WGS 84",6378137,298.257223563,
AUTHORITY["EPSG","7030"]],
AUTHORITY["EPSG","6326"]],
PRIMEM["Greenwich",0],
UNIT["degree",0.0174532925199433],
AUTHORITY["EPSG","4326"]],
PROJECTION["Transverse_Mercator"],
PARAMETER["latitude_of_origin",0],
PARAMETER["central_meridian",33],
PARAMETER["scale_factor",0.9996],
PARAMETER["false_easting",500000],
PARAMETER["false_northing",10000000],
UNIT["metre",1,
AUTHORITY["EPSG","9001"]],
AUTHORITY["EPSG","32736"]]
Application and Derivation
Forest canopy height is an important measure for modeling carbon and biomass dynamics, as well as land cover change (Lagomasino et al., 2015) . Mangrove forests have been of great interest to the carbon and biomass communities because of their large carbon storage pools (Donato et al. 2011), and the high rates of carbon sequestration that are two to four times higher than in mature tropical forests (Mcleod et al. 2011). The large carbon stocks along with the many economical ecosystem services, high rates of degradation, and threats from rising seas, make mangrove environments important regions of interest for climate mitigation and adaptation plans (Alongi et al., 2002).
Quality Assessment
Canopy height estimated from VHR were compared to local field surveys and shuttle radar topography mission (SRTM) data collected in 2000 and 2014 to identify bias and errors.
Field surveys were conducted in 2005 on Inhaca Island and in 2008 on the Maputo Elephant Reserve. A total of 61 plots were surveyed with 51 plots on Inhaca Island and 10 in the Elephant Reserve. All trees with a diameter greater than 2.5-cm were measured within a 15-m diameter circular plot at each of the 51 plots on Inhaca Island. In the Maputo Elephant Reserve, a variable plot method was used for each of the 10 locations to estimate forest structure. All the surveyed trees were measured for diameter at breast height (DBH) and tree height.
The VHR estimates were also compared to canopy height derived from coarse radar altimetry data collected from the shuttle radar topography mission (SRTM) in 2000, and SRTM 30-m data released in 2014.
The mean VHR approach overestimated the canopy heights for canopies between 10 and 30-m and conversely, underestimated or provided better estimates of canopy heights in areas less than 10-m. In shorter canopy forests, the field top-of-canopy heights were underestimated (Lagomasino et al., 2015).
Data Acquisition, Materials, and Methods
Site Description
Canopy height was estimated for three study sites located in southeastern Mozambique, Africa: two sites on Inhaca Island and one in the Maputo Elephant Reserve, located in the southern province of Maputo. Mozambique has one of the 15 largest mangrove areas globally and the second largest within Africa. The mangrove forest communities were comprised of five species: Avicennia marina, Rhizophora mucronata, Ceriops tagal, Bruguiera gymnorrhiza, and Lumnitzera racemose.
Methods
Three sets of orthorectified pairs of VHR stereo images from WV-1 (DigitalGlobe, Longmont, CO) were collected over approximately 9-km of shoreline along the western end of Inhaca Island and the Machangulo Peninsula, and the northern end of the Maputo Elephant Reserve in September of 2012 (Lagomasino et al., 2015). The panchromatic image pairs (spectral range 400-900 nm) were acquired via an agreement with Digital Globe and the National Geospatial Intelligence Agency (NGA). The image pairs were acquired in along-track setting to reduce confounding issues related to date and time collection, and roll and incident angles. In other words, the two images (from each set) were collected in the same orbit using an optimized satellite viewing and sun angle geometry to improve accuracy and corrections. Each stereo pair set was comprised of a left and right panchromatic image with an overlapped portion of geographic area. The images were processed using the NASA Ames Stereo Pipeline (ASP) digital surface model (DSM) tool.
Methodology for deriving canopy height estimates (for more information, see Lagomasino et al., 2015):
- Digital image matching (identification of ground control points (GCP’s) appearing within the overlap portion of the left and right images associated with a DSM): An image correlation routine within the the ASP was used to match similar pixels on each stereo pair and calculate the distance between the image focal plane and the Earth’s surface using epipolar geometry (Ni et al., 2014). The affine adaptive window mode option (subpixel mode = 2) was used to estimate the most accurate surface elevation relative to the WGS84 ellipsoid.
- Non-mangrove areas were masked from the DSM analyses using a combination of an unsupervised classification and manual interpretations from the VHR data. The unsupervised classification was performed using ENVI 5.1 using 10 classes (Exelis Visual Information Solutions; Boulder, CO) and applied to a Landsat 8 OLI image that was acquired on August 23, 2014 (row 78 path 167). A quality control comparison was made between the unsupervised classification, a recent global mangrove cover map by Giri et al. (2011) and from visual interpretations of high-resolution imagery.
- After the comparison, the bare ground surfaces (e.g., lighting gaps, mud flats) within the mangrove zone were identified manually in order to correct the DSM.
- Individual layers were created from each of the bare ground surfaces (ground) and overlaid on the DSM.
- The minimum, maximum, mean and standard deviation were calculated from the extracted elevation data for each layer. The product of the ground layer area and mean elevation was summed for all delineated ground surfaces and then divided by the total area of all ground surfaces.
- Forest canopy height estimates were then produced from the subtraction of the mean-weighted ground elevation from the original DSM, resulting in mangrove canopy height surface. Canopy height estimates are based on the assumption that the ground surface within the mangrove zone is relatively flat and thereby, the ground creates a spatially extensive, flat surface to easily subtract from the DSM.
Validation/Comparison of Estimated Canopy Height
Canopy height estimates from VHR and the methodology described above were compared to local field surveys conducted in 2005 and 2008, and to shuttle radar topography mission (SRTM) data collected in 2000 and 2014 to identify bias and errors.
Data Access
This data is available through the Oak Ridge National Laboratory (ORNL) Distributed Active Archive Center (DAAC).
CMS: Mangrove Canopy Height from High-resolution Stereo Image Pairs, Mozambique, 2012
Contact for Data Center Access Information:
- E-mail: uso@daac.ornl.gov
- Telephone: +1 (865) 241-3952
References
Alongi, D.M. Present state and future of the world’s mangrove forests. Environ. Conserv. 2002, 29, 331–349.
Donato, D.C., Kauffman, J.B., Murdiyarso, D., Kurnianto, S., Stidham, M., and Kanninen, M. Mangroves among the most carbon-rich forests in the tropics. Nat. Geosci. 2011, 4, 293–297.
Giri, C.; Ochieng, E.; Tieszen, L.L.; Zhu, Z.; Singh, A.; Loveland, T.; Masek, J.; Duke, N. Status and distribution of mangrove forests of the world using earth observation satellite data. Glob. Ecol. Biogeogr. 2011, 20, 154–159.
Lagomasino, D., Fatoyinbo, T. Lee, S., and Simard, M. High-resolution forest canopy height estimation in an African blue carbon ecosystem. Remote Sens. Ecol. Conserv. 2015, 1, 51–60. http://dx.doi.org/10.1002/rse2.3
Mcleod, E., G. L. Chmura, S. Bouillon, R. Salm, M. Bj€ork, and C. M. Duarte, et al. 2011. A blueprint for blue carbon: toward an improved understanding of the role of vegetated coastal habitats in sequestering CO2. Front. Ecol. Environ.9:552–560.
Ni, W., Ranson, K.J., Zhang, Z., and Sun, G. Features of point clouds synthesized from multi-view ALOS/PRISM data and comparisons with lidar data in forested areas. Remote Sens. Environ. 2014, 149, 47–57.