Documentation Revision Date: 2016-02-03
Summary
The LiDAR point cloud data are provided in the LASer (LAS) binary file format (*.las, or compressed as *.laz) and the derived DTMs are provided in GeoTIFF (*.tif) format. There are 338 *.tif files and 338 *.laz files. The five boundary maps are provided as shapefiles.
[ Supplemental information for Figure 1. Points are colored by relative elevation above mean sea level (meters) with a blue, green, red color gradient. Orange and red trees extend above the surrounding forest canopy. Scale is in meters. ]
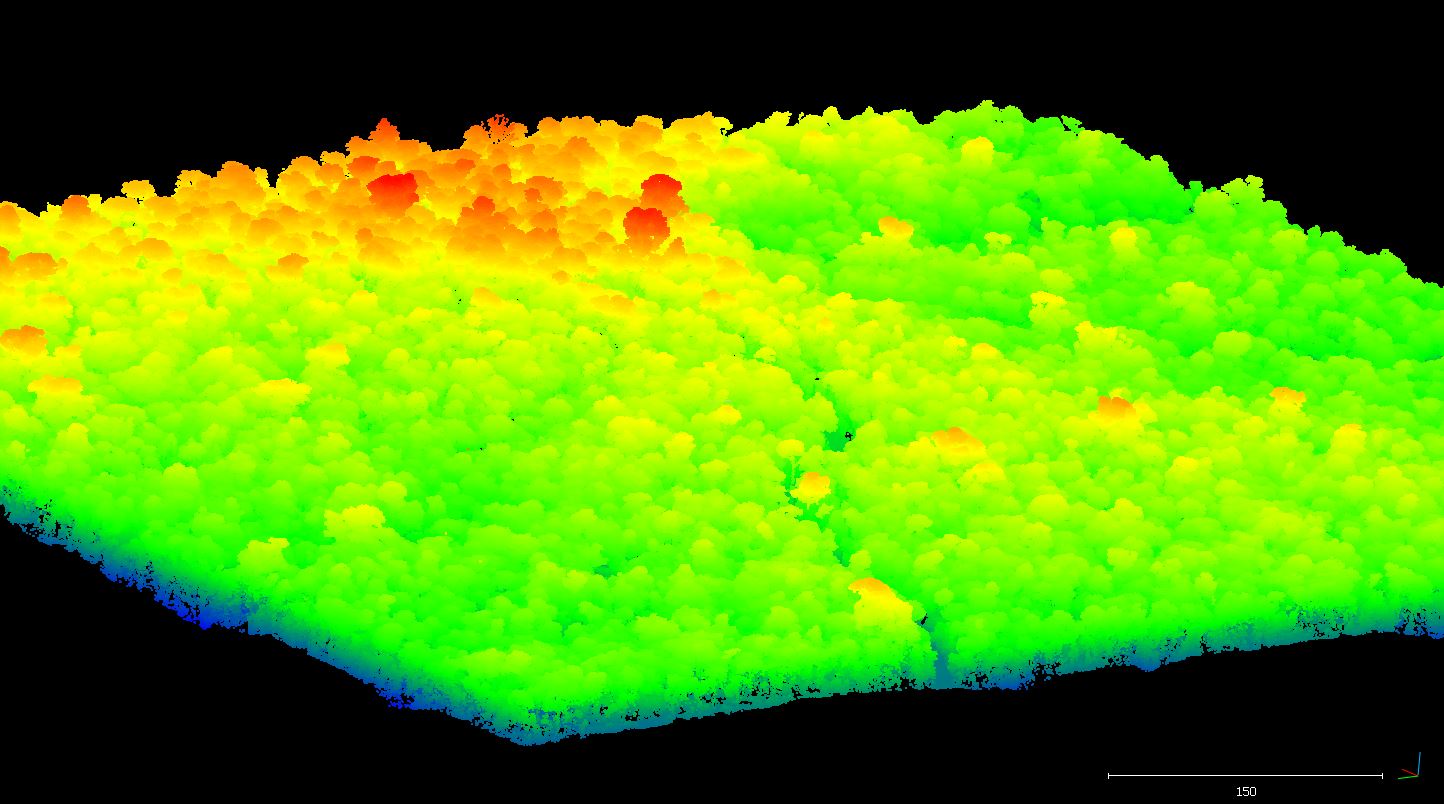
Figure1. LiDAR point cloud of Fazenda Cauaxi, 2012. Points are colored by elevation above sea level. Orange and red trees extend above the surrounding canopy.
Citation
dos-Santos, M.N., and M.M. Keller. 2016. CMS: LiDAR Data for Forested Areas in Paragominas, Para, Brazil, 2012-2014. ORNL DAAC, Oak Ridge, Tennessee, USA. http://dx.doi.org/10.3334/ORNLDAAC/1302
Table of Contents
- Data Set Overview
- Data Characteristics
- Application and Derivation
- Quality Assessment
- Data Acquisition, Materials, and Methods
- Data Access
- References
Data Set Overview
Project: Carbon Monitoring System (CMS)
Investigators: Maiza Nara dos-Santos and Michael Keller
This data set provides raw LiDAR point cloud data and derived Digital Terrain Models (DTMs) obtained for five areas in the municipality of Paragominas, Para, Brazil, for the years 2012, 2013, and 2014. Data are included for two areas in Paragominas for 2013 and 2014, two areas for the Fazenda Cauaxi for 2012 and 2014, and for the Fazenda Andiroba for 2013. Boundary maps are also provided for each of the areas.
The CMS is designed to make significant contributions in characterizing, quantifying, understanding, and predicting the evolution of global carbon sources and sinks through improved monitoring of carbon stocks and fluxes. The System will use the full range of NASA satellite observations and modeling/analysis capabilities to establish the accuracy, quantitative uncertainties, and utility of products for supporting national and international policy, regulatory, and management activities. CMS will maintain a global emphasis while providing finer scale regional information, utilizing space-based and surface-based data.
Related Data Set:
CMS: Forest Inventory and Biophysical Measurements, Para, Brazil, 2012-2014. This data set provides inventories and tree biophysical measurements made in the areas of this LiDAR data set and can be used for validation of LiDAR data.
Data Characteristics
Spatial Coverage
LiDAR surveys covered the following areas in the Paragominas municipality, Para Brazil:
Paragominas, municipality, two areas:
Area 1=1,000 ha; Area 2=3,000 ha
Fazenda Cauaxi:
Area 1, 2012= 1,214 ha; Area 2 in 2014=1,216 ha
Fazenda Andiroba: 1,000 ha
Spatial Resolution
LiDAR Point Clouds
Overall, the resolution for the point cloud data is < 1 meter squared. Resolution for a particular flight may be as high as 0.1 meter squared.
Resolution is estimated from the average point return density expressed as points per square meter, over the area of data acquisition. See the *_laz_Metadata.csv companion file for file-level detail.
Digital Terrain Models (DTMs)
1 x 1 meter
Temporal Coverage
Fazenda Cauaxi: 2012/07/27 - 2012/07/29 and 2014/12/26 - 2014/12/27
Paragominas: Area 1= 2014/06/18. Area 2= 2013/08/21 - 2013/09/09 and 2014/06/21 - 2014/07/02
Fazenda Andiroba: 2014/06/18 and 2014/06/22
Temporal Resolution
The LiDAR data were acquired on individual flights/days during 2012, 2013, and 2014.
Site boundaries: (All latitude and longitude given in decimal degrees, datum: WGS84)
| Site | Westernmost Longitude | Easternmost Longitude | Northernmost Latitude | Southernmost Latitude |
|---|---|---|---|---|
| Paragominas municipality, Brazil, area 1 (PAR) | -47.55805 | -47.511484 | -3.306267 | -3.328857 |
| Paragominas municipality, Brazil, area 2 (PRG) | -48.44061 | -46.793096 | -2.833795 | -3.761475 |
| Fazenda Cauaxi, Paragominas, Brazil, 2014 (CAU) | -48.495804 | -48.468434 | -3.730303 | -3.767183 |
| Fazenda Cauaxi, Paragominas, Brazil, 2012 (CAU) | -48.495804 | -48.468434 | -3.730303 | -3.767183 |
| Fazenda Andiroba, Paragominas, Brazil (AND) | -46.846065 | -46.82802 | -2.531909 | -2.57715 |
Data File Information
The data are for five areas for the years 2012, 2013, and 2014. There are 338 LiDAR point cloud (*.laz) files and 338 corresponding DTM (*.tif) files. The five area boundary maps are provided as shapefiles (provided in *.zip files).
Table 1. LiDAR Coverage Areas and Acquisition Dates
| Area | Year 2012 | Year 2013 | Year 2014 | Area Covered (ha) |
| Paragominas Municipality, Area 1 (PAR) | none | none | 20140618 | 1,000 |
| Paragominas Municipality, Area 2 (PRG) | none | 20130821, 20130822, 20130824, 20130825, 20130831, 20130903 and 20130909 | 20140621, 20140629, 20140630 and 20140702 | 3,000 |
| Fazenda Cauaxi (CAU) | 20120727-20120729 | none | none | 1,214 |
| Fazenda Cauaxi (CAU) | none | none | 20141226, 20141227 | 1,216 |
| Fazenda Andiroba (AND) | none | none | 20140618 and 20140622 | 1,000 |
GeoTIFF and *.laz File Naming
File naming conventions for *.tif and *.laz files differ only by the file-type extent.
The files are named as: aaaxBBBBcDDDD_YYYY (.tif or .laz)
Where:
aaa = lower case character abbreviation for the LiDAR surveyed area name
x = flightline, L or l
BBBB = first four digits of the x coordinate (UTM in meters) of the given tile
c = column
DDDD = first four digits of the y coordinate (UTM in meters) of the given tile
YYYY = Year 2012, 2013, or 2014
Example: andl2940c9715_2014 (.tif or .laz)
Where:
and = 3 letter code for the study area Fazenda Andiroba
l = stands for line
2940 = first four digits of the x coordinate (UTM in meters) of the given tile
c = column
9715 = first four digits of the y coordinate (UTM in meters) of the given tile
2014 = year data were collected
GeoTIFF and *.laz File Characteristics
The LiDAR point cloud data are provided in the LASer (LAS) binary file format (*.las, or compressed as *.laz) and the derived DTMs are provided in GeoTIFF (*.tif) format.
- For information regarding the area LiDAR surveys (instrumentation and acquisition parameters) and content of the *.laz files (number of points, returns, average point return density, and min and max coordinates) please refer to the companion file included with this data set, CMS_Landscapes_Brazil_LIDAR_laz_Metadata.csv
- For details about the DTM *.tif files, including coordinate reference system and GeoTIFF file characteristics, please refer to the companion file included with this data set, CMS_Landscapes_Brazil_LIDAR_DTM_Metadata.csv
Shapefiles
There are five shape files (*.shp) provided in zip files (*.zip files) of the boundaries of the LiDAR scanned areas:
- PAR_A01_2013_LiDAR_coverage_area.shp (PAR_A01_2013_LiDAR_coverage_area.zip)
- AND_A01_2013_LiDAR_coverage_area.shp (AND_A01_2013_LiDAR_coverage_area.zip)
- CAU_A01_2012_LiDAR_coverage_area.shp (CAU_A01_2012_LiDAR_coverage_area.zip)
- CAU_A01_2014_LiDAR_coverage_area.shp (CAU_A01_2014_LiDAR_coverage_area.zip)
- PRG_A01_2013-2014_LiDAR_coverage_area.shp (PRG_A01_2013-2014_LiDAR_coverage_area.zip)
Where, for example, "AND" = 3 letter code for the study area, "A01" = sub-study area (sometimes used with non-contiguous polygons), and "2013" = year data were collected.
Shapefile Spatial Properties
Shapefiles: PAR_A01_2013_LiDAR_coverage_area and AND_A01_2013_LiDAR_coverage_area
These shapefiles contain six files (*.shx, *.dbf, *.prj, *.sbn, *.sbx, and *.shp).
Parameters of the shapefiles:
Geometry Type: Polygon
Projected Coordinate System: WGS_1984_UTM_Zone_23S
Geographic Coordinate System: GCS_WGS_1984
Datum: D_WGS_1984
Prime Meridian: Greenwich
Angular Unit: Degree
Projection: Transverse_Mercator
false_easting: 500000.00000000
false_northing: 10000000.00000000
central_meridian: -45.00000000
scale_factor: 0.99960000
latitude_of_origin: 0.00000000
Linear Unit: Meter
Attributes:
FID: Internal feature number; sequential unique whole numbers that are automatically generated
Shape: Feature geometry
Area_ha: Area of polygon in hectares
Shapefiles: CAU_A01_2012_LiDAR_coverage_area and CAU_A01_2014_LiDAR_coverage_area
These shapefiles contain six files (*.shx, *.dbf, *.prj, *.sbn, *.sbx, and *.shp).
Parameters of the shapefiles:
Geometry Type: Polygon
Projected Coordinate System: WGS_1984_UTM_Zone_22S
Geographic Coordinate System: GCS_WGS_1984
Datum: D_WGS_1984
Prime Meridian: Greenwich
Angular Unit: Degree
Projection: Transverse_Mercator
false_easting: 500000.00000000
false_northing: 10000000.00000000
central_meridian: -51.00000000
scale_factor: 0.99960000
latitude_of_origin: 0.00000000
Linear Unit: Meter
Attributes:
FID: Internal feature number; sequential unique whole numbers that are automatically generated
Shape: Feature geometry
Area_ha: Area of polygon in hectares
Shapefile: PRG_A01_2013-2014_LiDAR_coverage_area
This shapefile contain six files (*.shx, *.dbf, *.prj, *.sbn, *.sbx, and *.shp).
Parameters of the shapefiles:
Geometry Type: Polygon
Projected Coordinate System: WGS_1984_UTM_Zone_23S
Geographic Coordinate System: GCS_WGS_1984
Datum: D_WGS_1984
Prime Meridian: Greenwich
Angular Unit: Degree
Projection: Transverse_Mercator
false_easting: 500000.00000000
false_northing: 10000000.00000000
central_meridian: -45.00000000
scale_factor: 0.99960000
latitude_of_origin: 0.00000000
Linear Unit: Meter
Attributes:
FID: Internal feature number; sequential unique whole numbers that are automatically generated
Shape: Feature geometry
File: LiDAR/DTM file whose extent is represented by the polygon
Polygon_ID: Project dataset ID that contains the file
area_ha: Area of polygon in hectares
Companion files
There are six companion files with this data set (there is also a .pdf of this guide included as a companion file):
Five *.kmz files included for visualization in Google Earth:
- PAR_A01_2013_LiDAR_coverage_area.kmz
- AND_A01_2013_LiDAR_coverage_area.kmz
- CAU_A01_2012_LiDAR_coverage_area.kmz
- CAU_A01_2014_LiDAR_coverage_area.kmz
- PRG_A01_2013-2014_LiDAR_coverage_area.kmz
One comma-separated (.csv) file which provides metadata for the LiDAR campaigns and the general contents of the *.las (*.laz) files described above, including dates, flight information, and instrumentation information:
- CMS_Landscapes_Brazil_LIDAR_laz_Metadata.csv
One comma-separated (.csv) file which provides metadata for the DTM *.tif files, including coordinate reference system and GeoTIFF file characteristics:
- CMS_Landscapes_Brazil_LIDAR_DTM_Metadata.csv
Application and Derivation
Brazilian tropical forests contain approximately one-third of the global carbon stock in above-ground tropical forest biomass. Deforestation has cleared about 15% of the extensive forest on the Brazilian Amazon frontier. In response to the potential climatic effects of deforestation, policy makers have suggested reductions in emissions through deforestation and forest degradation and enhanced forest carbon stocks (REDD+). Carbon accounting for REDD+ requires knowledge of deforestation, degradation, and associated changes in forest carbon stocks. These LiDAR data and related data set of forest inventories and ground measurements in the same areas as these LiDAR data may be used in the quantification of carbon stocks, changes, and associated uncertainties in Paragominas, a jurisdiction in the eastern Brazilian Amazon with a high proportion of logged and burned degraded forests where political change has opened the way for REDD+.
Quality Assessment
Data published by the Sustainable Landscapes Project undergo a strict process of quality control. Should a data set not fully meet these criteria, a new data collection is required from the vendor, therefore generating an entire new data set.
Please refer to http://mapas.cnpm.embrapa.br/paisagenssustentaveis/ for additional information.
Data Acquisition, Materials, and Methods
Site:
The LiDAR areas were located in the Paragominas municipality, Para, Brazil. Paragominas is located in the eastern Brazilian Amazon. The dominant vegetation in this region is humid forest with predominantly oxisols perenefólia and Ultisols soils. Paragominas was a large agricultural and timber center of the country, with its exploitation starting in the 70's and expansion in the 80's. During the period 1989 to 1990 it is estimated that 67,845 ha were logged with wood intended to supply the 238 sawmills operating in the region. Paragominas was once considered the largest timber producing area of Brazil (dos-Santos et al., 2015; Verissimo et al., 1992).
LiDAR and DTM Data
LiDAR data were obtained for five forested areas in the municipality of Paragominas, Para, Brazil, for the years 2012, 2013, and 2014. Data are included for two areas in Paragominas for 2013 and 2014, two areas for the Fazenda Cauaxi for 2012 and 2014, and for the Fazenda Andiroba for 2014. The data were collected and processed to point cloud *.las format files and corresponding DTM *.tif format files by commercial vendors under the Sustainable Landscapes project. Sustainable Landscapes is supported by the United States Agency for International Development (USAID) and US Department of State, in response to the potential climatic effects of deforestation, policy makers have suggested reductions in emissions through deforestation and forest degradation and enhanced forest carbon stocks (REDD+).
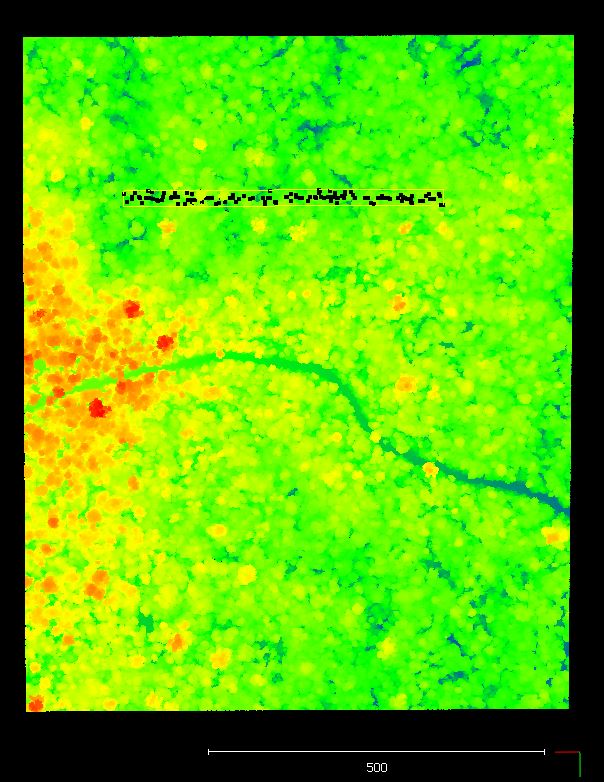
Figure 2. LiDAR point cloud of Cauaxi in 2012. The area with black dots indicates a transect where tree measurements were taken in the related data set (See Section 1).
For information regarding the area LiDAR surveys (instrumentation and acquisition parameters) and content of the *.laz files (number of points, returns, and min and max coordinates) please refer to the companion file included with this data set CMS_Landscapes_Brazil_LIDAR_laz_Metadata.csv and http://mapas.cnpm.embrapa.br/paisagenssustentaveis/.
The coincident forest inventory and biophysical measurements data reported in the data set, dos-Santos, M.N.and M. Keller (2015), can be used for validation of LiDAR data.
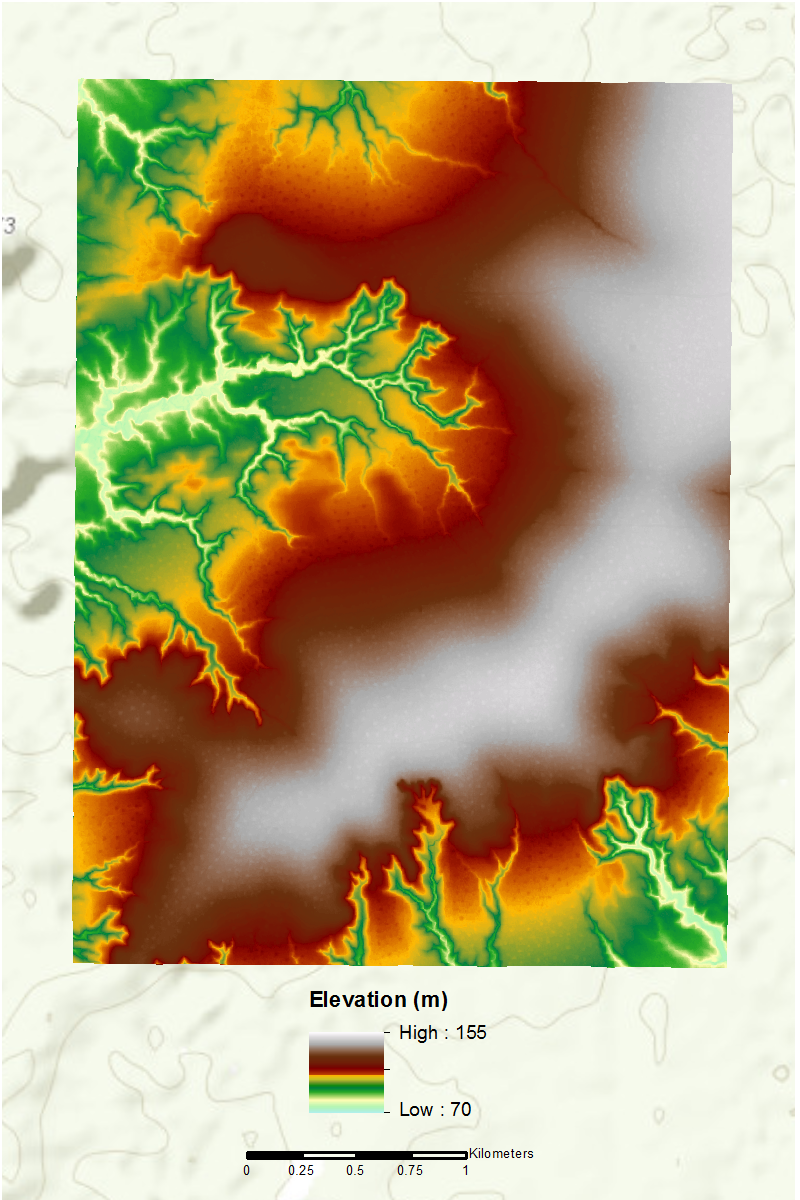
Figure 3. DTM data for entire scanned Cauaxi area in 2012, at 1 meter horizontal resolution. Elevation is meters above mean sea level. Twenty individual Cauaxi DTM files were composited to produce this image. The distributed GeoTIFF files for an area have the same overall area spatial extent, while the data coverage area in each file varies. That is, contiguous data areas share common extents when no-data areas are considered.
For details about the DTM *.tif files, including coordinate reference system and GeoTIFF file characteristics, please refer to the companion file included with this data set CMS_Landscapes_Brazil_LIDAR_DTM_Metadata.csv and http://mapas.cnpm.embrapa.br/paisagenssustentaveis/.
Data Access
This data is available through the Oak Ridge National Laboratory (ORNL) Distributed Active Archive Center (DAAC).
CMS: LiDAR Data for Forested Areas in Paragominas, Para, Brazil, 2012-2014
Contact for Data Center Access Information:
- E-mail: uso@daac.ornl.gov
- Telephone: +1 (865) 241-3952
References
dos-Santos, M.N., and M.M. Keller. 2015. CMS: Forest Inventory and Biophysical Measurements, Para, Brazil, 2012-2014. ORNL DAAC, Oak Ridge, Tennessee, USA. http://dx.doi.org/10.3334/ORNLDAAC/1301
dos-Santos, M.N., E.R. Pinage, M. Longo, L. Spinelli-Araujo, and M. Keller. Characterized edge effect with the use of LiDAR data in a degraded forest landscape in the municipality of Paragominas (PA). Proceedings of the XVII Brazilian Symposium on Remote Sensing - SBSR , Joao Pessoa, Brazil, 25 to 29 April 2015, INPE.
Verissimo, A., P. Barreto, M. Mattos, R. Tarifa, and C. Uhl. Logging impacts and prospects for sustainable forest management in an old Amazonian frontier: the case of Paragominas, Forest Ecology and Management, 55:169-199, 1992.