Documentation Revision Date: 2016-05-12
Data Set Version: V1
Summary
This data set includes one data file of greenhouse gas measurements in comma-separated text (*.csv) format and 6370 netCDF (*.nc) files representing gridded footprints from WRF-STILT simulations.
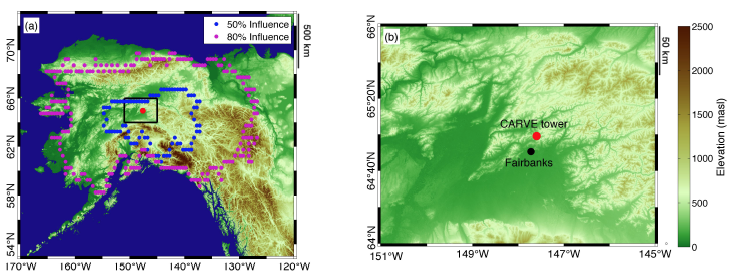
Figure 1: Location of the CARVE tower (red) and 50% and 80% surface influence contours for the average WRF-STILT influence functions (from Karion et al 2016).
Citation
Karion, A., C. Sweeney, J.B. Miller, A.E. Andrews, R. Commane, S.J. Dinardo, J. Henderson, J.O.W. Lindaas, J. Lin, K. Luus, T. Newberger, P. Tans, S.C. Wofsy, S. Wolter, and C.E. Miller. 2016. CARVE: CH4, CO2, and CO Atmospheric Concentrations, CARVE Tower, Alaska, 2012-2014. ORNL DAAC, Oak Ridge, Tennessee, USA. http://dx.doi.org/10.3334/ORNLDAAC/1316
Table of Contents
- Data Set Overview
- Data Characteristics
- Application and Derivation
- Quality Assessment
- Data Acquisition, Materials, and Methods
- Data Access
- References
- Data Set Revisions
Data Set Overview
Project: Carbon in Arctic Reservoirs Vulnerability Experiment (CARVE)
This data set provides hourly atmospheric concentrations of methane (CH4), carbon dioxide (CO2), and carbon monoxide (CO) as mole fractions, from January 2012 to December 2014 measured at the CARVE flux tower in Fox, Alaska (17 km north of Fairbanks) as part of NASA's Carbon in Arctic Reservoirs Vulnerability Experiment (CARVE). High-resolution meteorological fields from the Polar Weather Research and Forecasting (WRF) model coupled with the Stochastic Time-Inverted Lagrangian Transport model (WRF- STILT), along with the Polar Vegetation Photosynthesis and Respiration Model (PolarVPRM) were used to determine the influence region of the tower site and investigate the inter-annual and seasonal variability of regional fluxes of CO2 and CH4 in boreal Alaska using the tower observations. Modeled estimates of CH4, CO2, and CO background concentrations are provided. The WRF-STILT model "footprints" for the CARVE tower are provided with this data set.
The Carbon in Arctic Reservoirs Vulnerability Experiment (CARVE) is collecting detailed measurements of important greenhouse gases on local to regional scales in the Alaskan Arctic and demonstrating new remote sensing and improved modeling capabilities to quantify Arctic carbon fluxes and carbon cycle-climate processes. Ultimately, CARVE will provide an integrated set of data that will provide unprecedented experimental insights into Arctic carbon cycling.
Related publication:
Karion, A., Sweeney, C., Miller, J. B., Andrews, A. E., Commane, R., Dinardo, S., Henderson, J. M., Lindaas, J., Lin, J. C., Luus, K. A., Newberger, T., Tans, P., Wofsy, S. C., Wolter, S., and Miller, C. E. "Investigating Alaskan methane and carbon dioxide fluxes using measurements from the CARVE tower." Atmospheric Chemistry and Physics 16, 5383-5398, doi:10.5194/acp-16-5383-2016, 2016.
Related data sets:
Luus, K., and J. Lin. 2016. CARVE Modeled Gross Ecosystem CO2 Exchange and Respiration, Alaska, 2012-2014. ORNL DAAC, Oak Ridge, Tennessee, USA. http://dx.doi.org/10.3334/ORNLDAAC/1314
Data Characteristics
Site boundaries: (All latitude and longitude given in decimal degrees)
|
Site (Region) |
Westernmost Longitude |
Easternmost Longitude |
Northernmost Latitude |
Southernmost Latitude |
|
CRV tower, Fox, Alaska, USA |
-147.598 |
-147.598 |
64.986 |
64.986 |
|
Northern hemisphere above 30 degrees (for WRF-STILT footprint files) |
-180 |
180 |
90 |
30 |
Table 1. Data files
|
File Name |
Temporal Range |
Description |
|
CRVT_hourly_2012_2014.csv |
20120101- 20141231 |
Hourly gas concentrations (CO2, CH4, and CO) from the CARVE flux tower for 2012-01-01 to 2014-12-31 and model-derived background concentrations for the hourly averages. |
|
2012_footprints |
20120101-20121231 |
Directory containing 2088 netCDF (*.nc) files representing gridded footprints from WRF-STILT simulations for the year 2012. Data volume 5.76 GB. |
|
2013_footprints |
20130101-20131231 |
Directory containing 2105 netCDF (*.nc) files representing gridded footprints from WRF-STILT simulations for the year 2013. Data volume 5.57 GB. |
|
2014_footprints |
20140101-20141231 |
Directory containing 2177 netCDF (*.nc) files representing gridded footprints from WRF-STILT simulations for the year 2014. Data volume 5.62 GB. |
Description of CRVT_hourly_2012_2014.csv
Primary measurements
Measurements were made using a four-species (Picarro model 2401m, SN CFKBDS2008 and Picarro model 2401, SNCFKBDS2067) cavity ring-down spectrometer system (CRDS). The measurement frequency for CO2, CO, CH4, and water vapor was 0.5 Hz.
Measurement scales
CO2 measurement were made relative to the WMO CO2 X2007 Scale (Zhao and Tans, 2006). CO measurements are reported relative to the WMO CO X2004 Scale (Novelli et al., 1991). CH4 measurements are reported relative to the WMO CH4 2004 Scale (Dlugokencky et al., 2005), not the recently updated 2004A scale.
Tower profile sampling scheme
Air was sampled from three different levels on the tower.
Level 1: 616.3056 masl, 4.9 magl, air sampled for 5 minutes per hour
Level 2: 628.4976 masl, 17.1 magl, air sampled for 5 minutes per hour
Level 3: 643.1280 masl, 31.7 magl, air sampled for 50 minutes per hour
Water vapor correction
Sample air was not dried prior to measurement; the dry mole fraction for CO2, CO, and CH4 is derived from an empirical correction to the measured (wet) mole fraction that is a function of ambient water vapor that was measured by the CRDS analyzer, and accounts both for dilution effects and optical interference in the measurement cell. Using this correction below 3% H2O, the true dry mole fraction is recovered within 1 parts per billion (ppb) of CH4, 0.1 parts per million (ppm) of CO2, and 2 ppb of CO. More information on the water correction is available in Karion et al., 2013.
Data reporting units
CO2 Dry Air Mole Fraction: The CO2 abundance is given as a mole fraction with units of parts per million (ppm). This value corresponds to the number of CO2 molecules per 1 million molecules of dry air.
CH4 Dry Air Mole Fraction: The CH4 abundance is given as a mole fraction with units of parts per billion (ppb). This value corresponds to the number of CH4 molecules per 1 billion molecules of dry air.
CO Dry Air Mole Fraction: The CO abundance is given as a mole fraction with units of parts per billion (ppb). This value corresponds to the number of CO molecules per 1 billion molecules of dry air.
Data reporting interval
The aggregated data values are reported at the top of each hour (approximately), and represent data centered at the top of each hour (i.e. an average reported at 13:00 UTC represents data collected sometime during the interval from 12:30 to 13:30 UTC).
Data averaging
High resolution data (30-second averages of 2-second primary measurements) are available directly from the CARVE science team.
For 30-second data averaged for Level sampling time: For Levels 1 and 2, this means that the average is only a 5-minute average of 30-second data that occurred sometime within that hour. For Level 3, it is a 50-minute average of 30-second data.
Also reported is the Standard Deviation (SD) associated with the respective 30-second averaged value, which reflects both analyzer precision and real atmospheric variability during the measurement period.
Table 2. Data fields in CRVT_hourly_2012_2014.csv. Missing data are represented by "NaN".
|
Data Field |
Units |
Description |
|
Year |
|
Year |
|
Month |
|
Numeric month of year |
|
Day |
|
Numeric day of the month |
|
Hour |
|
Hour (UTC) |
|
Minute |
|
Minute (UTC) |
|
CO2L1_ppm |
ppm |
Hourly average CO2 dry mole fraction from Level 1 |
|
CO2L1_std |
ppm |
Standard deviation of the 30-second averages of CO2 dry mole fraction from Level 1 in that hour |
|
CO2L2_ppm |
ppm |
Hourly average CO2 dry mole fraction from Level 2 |
|
CO2L2_std |
ppm |
Standard deviation of the 30-second averages of CO2 dry mole fraction from Level 2 in that hour |
|
CO2L3_ppm |
ppm |
Hourly average CO2 dry mole fraction from Level 3 |
|
CO2L3_std |
ppm |
Standard deviation of the 30-second averages of CO2 dry mole fraction from Level 3 in that hour |
|
CH4L1_ppb |
ppb |
Hourly average CH4 dry mole fraction from Level 1 |
|
CH4L1_std |
ppb |
Standard deviation of the 30-second averages of CH4 dry mole fraction from Level 1 in that hour |
|
CH4L2_ppb |
ppb |
Hourly average CH4 dry mole fraction from Level 2 |
|
CH4L2_std |
ppb |
Standard deviation of the 30-second averages of CH4 dry mole fraction from Level 2 in that hour |
|
CH4L3_ppb |
ppb |
Hourly average CH4 dry mole fraction from Level 3 |
|
CH4L3_std |
ppb |
Standard deviation of the 30-second averages of CH4 dry mole fraction from Level 3 in that hour |
|
COL1_ppb |
ppb |
Hourly average CO dry mole fraction from Level 1 |
|
COL1_std |
ppb |
Standard deviation of the 30-second averages of CO dry mole fraction from Level 1 in that hour |
|
COL2_ppb |
ppb |
Hourly average CO dry mole fraction from Level 2 |
|
COL2_std |
ppb |
Standard deviation of the 30-second averages of CO dry mole fraction from Level 2 in that hour |
|
COL3_ppb |
ppb |
Hourly average CO dry mole fraction from Level 3 |
|
COL3_std |
ppb |
Standard deviation of the 30-second averages of CO dry mole fraction from Level 3 in that hour |
|
CO2_bg |
ppm |
Model-derived background concentration of CO for the hourly average from L3, using back-trajectories of particles from WRF-STILT with a data-derived background curtain |
|
CO2_stdbg |
ppm |
The 1-sigma uncertainty/error in the background value of CO2, based on the scatter in the particle back-trajectories and the uncertainty in the background curtain |
|
CH4_bg |
ppb |
Model-derived background concentration of CH4 for the hourly average from L3, using back-trajectories of particles from WRF-STILT with a data-derived background curtain |
|
CH4_stdbg |
ppb |
The 1-sigma uncertainty/error in the background value of CH4, based on the scatter in the particle back-trajectories and the uncertainty in the background curtain |
|
CO_bg |
ppb |
Model-derived background concentration of CO for the hourly average from L3, using back-trajectories of particles from WRF-STILT with a data-derived background curtain |
|
CO_stdbg |
ppb |
The 1-sigma uncertainty/error in the background value of CO, based on the scatter in the particle back-trajectories and the uncertainty in the background curtain |
|
U_mps |
meters per second |
Wind speeds from the Vaisala 2D sonic anemometer mounted at the top of the tower. U is positive for wind traveling from West to East |
|
V_mps |
meters per second |
Wind speeds from the Vaisala 2D sonic anemometer mounted at the top of the tower. V is positive for wind traveling from South to North |
|
Tsonic_C |
Deg C |
Sonic temperature from the Vaisala sonic anemometer |
WRF-STILT model output files:
The model output files are provided in three directories, one for each year 2012, 2013, and 2014. Each directory contains netCDF (*.nc) files representing gridded footprints from WRF-STILT simulations.
Each netcdf file aggregates particle footprints on a lat/lon/time grid starting at the STILT start time. The reported data have been limited to measurements collected at the CARVE tower (64.9863°N, 147.5980°W) during local mid-afternoon hours of 1 pm to 6 pm (22 GMT - 3 GMT) (to limit the analysis to time periods when the model is expected to perform better). Each file also contains information about the particle trajectories, which was used to determine a background condition for the footprint.
For each tower measurement, 2D surface influence fields (i.e. footprints) at two different spatial resolutions were derived using the WRF-STILT simulations. These gridded footprints are provided as netCDF formatted files. The first surface influence field, represented by the “foot1” variable in the netCDF files, provides a total 10 days of surface influence representing the response of the receptor to a unit surface emission (ppb/nmol m-2 s-1) of CH4 in each 0.5° x 0.5° grid square within the whole study area (30N to 90N and 180E to 180W) at hourly temporal resolution. These were the footprints used in Karion et al. (2016)
The second surface influence field, represented by the “footnearfield1” variable in the netCDF files, provides a total 24 hours of surface influence representing the response of the receptor to a unit surface emission (ppb/nmol m-2 s-1) of CH4 in each 0.1° x 0.1° grid square within a small region close to the measurement location at hourly temporal resolution. This was not used in the publication Karion et al. (2016).
The variable "footdate" is the date and time of the given footprint expressed in days since 00 GMT on January 1, 2000. The particle trajectories are given in these files as well, in the variable "part3d”, with variables and columns described in "part3dnames".
File naming convention for footprint netcdf files:
stiltYYYYxMMxDDxhhxmmxDecDegNxDecDegWxHeight.nc where:
YYYY = year
MM = month
DD = day
hh = hour (UTC time)
mm = minutes (UTC time)
DecDegN = Latitude in decimal degrees north
DecDegW = Longitude in decimal degrees west
Height = Height above ground level (m)
Height above ground level for the footprints was 300 m. The tower is located at 32 m above ground level, which is 611 m above sea level. The WRF-STILT model grid cell containing the tower site was significantly lower than the actual elevation of the tower (343 vs. 611 masl). The height above ground level of the model footprint origin is at 300 m to match the actual above sea level height of the tower.
For example, the file "stilt2012x01x06x23x00x64.9863Nx147.5980Wx00300.nc" contains the modeled particle footprints for January 6, 2012 at 23:00 UTC.
The WRF-STILT model as run for this project is described further in Henderson et al. (2015).
Application and Derivation
The regional CO2 and CH4 observations data in this study show how the CARVE tower data provides a continuous observation platform that will contribute to future efforts to investigate the high-latitude carbon cycle and its response to warming. The CO2 observations at the CARVE tower site are simulated very well by the WRF-STILT model when convolved with PolarVPRM biogenic CO2 fluxes and the high correlation between modeled and observed CO2 provide confidence in the STILT footprints and the WRF meteorological model that was used to generate them. In addition, the WRF-STILT meteorological model and the CARVE tower observations also indicate that the average CH4 flux over the entire region is relatively small with some spatial and temporal variability that may indicate the need for year round in-situ measurements.
Quality Assessment
QC flags are not reported in this data set. Uncertainties for the trace gas measurements (CO2, CH4, and CO averages) represent
reproducibility and comparability to other NOAA network sites, and are determined to be 0.2 ppm, 2 ppb, and 5 ppb, respectively (1-sigma), according to methods described in Karion et al. (2016) and based on comparisons with NOAA flasks. Standard deviation of the hourly means are provided.
Data Acquisition, Materials, and Methods
Tower measurements
Continuous in-situ measurements of CO2, CH4, and CO were made by drawing air from three heights through a Picarro G2401-m or G2401 Cavity Ring-Down Spectroscopic (CRDS) analyzer. In addition, a two-dimensional (2D) sonic anemometer was deployed at the top of the tower and was operational from April 2012 through June 2014.
WRF-STILT model footprints
The WRF-STILT modeling framework was used to generate footprints for CARVE tower observations. For each observation location (i.e. “receptor”), STILT produces a two-dimensional surface influence field called a “footprint” (units of ppm / (µmol m−2 s−1)) that quantifies the influence of upwind surface fluxes on atmospheric concentrations measured at the receptor location. The CARVE Polar WRF configuration consists of a triply nested grid, with the innermost domain covering mainland Alaska on a 3.3-km grid. More details of the WRF-STILT model configuration and validation of the meteorological simulations may be obtained from Henderson et al. (2015).
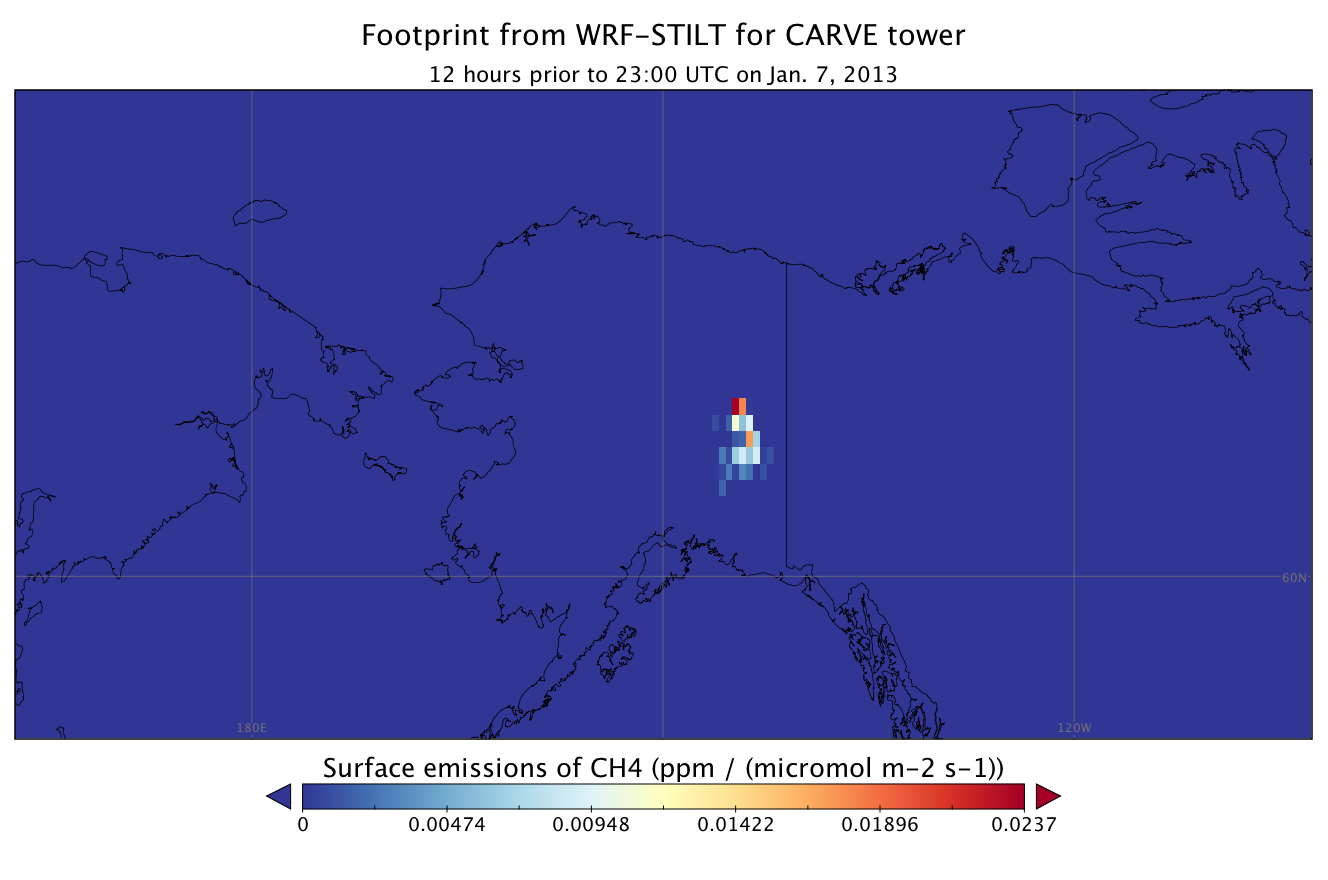
Figure 2: WRF-STILT modeled footprint for the CARVE tower showing modeled surface influence on Jan. 7, 2013.
CO2 fluxes from the land surface of Alaska were assessed by convolving surface fluxes from the PolarVPRM (Luus and Lin, 2015) with the footprints and comparing the resulting modeled CO2 enhancements with tower observations. To infer regional CH4 fluxes, the footprints were convolved with a constant (in space and time) flux model and an elevation-based flux model and scaled the results to monthly mean observed enhancements to estimate monthly average fluxes over a wide region, using similar methods as Chang et al. (2014). STILT footprints used for this study were generated every 3 hours during local nighttime and hourly during local daytime, for a total of 16 footprints per day, and gridded at 0.5° x 0.5° resolution. For each footprint, 500 particles were emitted from the tower location and altitude above sea level and traced backwards in time for 10 days. The altitude above sea level rather than ground level was used for the location of the particle emission because the elevation of the model grid cell containing the tower site was significantly lower than the actual elevation of the site (343 masl vs. 611 masl), despite use of the high-resolution grid (Henderson et al., 2015). Footprints generated during mid-afternoon hours (1 pm to 6 pm local Alaska standard time (LST), UTC+8) were used only to reduce biases induced by differences in actual and modeled topography, except where noted specifically.
For more information on methodology, see Karion et al. (2016).
Data Access
This data is available through the Oak Ridge National Laboratory (ORNL) Distributed Active Archive Center (DAAC).
CARVE: CH4, CO2, and CO Atmospheric Concentrations, CARVE Tower, Alaska, 2012-2014
Contact for Data Center Access Information:
- E-mail: uso@daac.ornl.gov
- Telephone: +1 (865) 241-3952
References
Andrews, A. E., J. D. Kofler, M. E. Trudeau, J. C. Williams, D. H. Neff, K. A. Masarie, D. Y. Chao et al. "CO 2, CO, and CH 4 measurements from tall towers in the NOAA Earth System Research Laboratory's Global Greenhouse Gas Reference Network: Instrumentation, uncertainty analysis, and recommendations for future high-accuracy greenhouse gas monitoring efforts." Atmospheric Measurement Techniques 7, no. 2 (2014): 647-687.
Chang, Rachel Y-W., Charles E. Miller, Steven J. Dinardo, Anna Karion, Colm Sweeney, Bruce C. Daube, John M. Henderson et al. "Methane emissions from Alaska in 2012 from CARVE airborne observations." Proceedings of the National Academy of Sciences 111, no. 47 (2014): 16694-16699.
Dlugokencky, E. J., R. C. Myers, P. M. Lang, K. A. Masarie, A. M. Crotwell, K. W. Thoning, B. D. Hall, J. W. Elkins, and L. P. Steele. "Conversion of NOAA atmospheric dry air CH4 mole fractions to a gravimetrically prepared standard scale." Journal of Geophysical Research: Atmospheres 110, no. D18 (2005).
Henderson, J. M., J. Eluszkiewicz, M. E. Mountain, T. Nehrkorn, R. Y. W. Chang, A. Karion, J. B. Miller et al. "Atmospheric transport simulations in support of the Carbon in Arctic Reservoirs Vulnerability Experiment (CARVE)." Atmos Chem Phys 15, no. 8 (2015): 4093-4116.
Karion, A., Sweeney, C., Miller, J. B., Andrews, A. E., Commane, R., Dinardo, S., Henderson, J. M., Lindaas, J., Lin, J. C., Luus, K. A., Newberger, T., Tans, P., Wofsy, S. C., Wolter, S., and Miller, C. E. "Investigating Alaskan methane and carbon dioxide fluxes using measurements from the CARVE tower." Atmospheric Chemistry and Physics 16, 5383-5398, doi:10.5194/acp-16-5383-2016, 2016.
Karion, A., C. Sweeney, S. Wolter, T. Newberger, H. Chen, A. Andrews, J. Kofler, D. Neff, and P. Tans. "Long-term greenhouse gas measurements from aircraft." Atmospheric Measurement Techniques 6, no. 3 (2013): 511-526.
Luus, Kristina, and J. C. Lin. "The Polar Vegetation Photosynthesis and Respiration Model: a parsimonious, satellite-data-driven model of high-latitude CO2 exchange." Geoscientific Model Development 8 (2015): 2655-2674.
Novelli, Paul C., James W. Elkins, and L. Paul Steele. "The development and evaluation of a gravimetric reference scale for measurements of atmospheric carbon monoxide." Journal of Geophysical Research: Atmospheres 96, no. D7 (1991): 13109-13121.
Zhao, Cong Long, and Pieter P. Tans. "Estimating uncertainty of the WMO mole fraction scale for carbon dioxide in air." Journal of Geophysical Research: Atmospheres 111, no. D8 (2006).
Data Set Revisions
Data Citation Note:
In Karion et al. (2016) this data set was cited with a different title:
Karion, A., C. Sweeney, J.B. Miller, A.E. Andrews, R. Commane, S.J. Dinardo, J. Henderson, J.O.W. Lindaas, J. Lin, K. Luus, T. Newberger, P. Tans, S.C. Wofsy, S. Wolter, and C.E. Miller. 2016. CARVE: CH4, CO2 and CO Hourly Mole Fractions from CARVE Tower, Fox, Alaska, 2012-2014. ORNL DAAC, Oak Ridge, Tennessee, USA. http://dx.doi.org/10.3334/ORNLDAAC/1316
The ORNL DAAC data set title more generally describes the contents:
Karion, A., C. Sweeney, J.B. Miller, A.E. Andrews, R. Commane, S.J. Dinardo, J. Henderson, J.O.W. Lindaas, J. Lin, K. Luus, T. Newberger, P. Tans, S.C. Wofsy, S. Wolter, and C.E. Miller. 2016. CARVE: CH4, CO2, and CO Atmospheric Concentrations, CARVE Tower, Alaska, 2012-2014. ORNL DAAC, Oak Ridge, Tennessee, USA. http://dx.doi.org/10.3334/ORNLDAAC/1316
The DOI is consistent and resolves to same ORNL DAAC Landing Page -- http://dx.doi.org/10.3334/ORNLDAAC/1316