Documentation Revision Date: 2016-09-12
Data Set Version: V1
Summary
There are 29 files in NetCDF v4 (*.nc4) format with this data set.
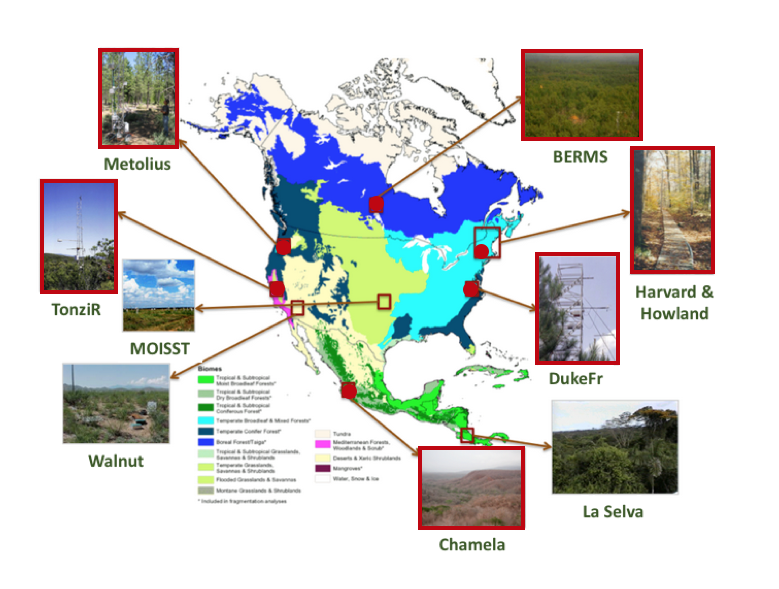
Figure 1: In-ground soil moisture measurements were taken at six of the ten AirMOSS sampling sites, highlighted here in red.
Citation
Hagimoto, Y., R. Cuenca, and AirMOSS Science Team. 2016. AirMOSS: L2 Hourly In-Ground Soil Moisture at AirMOSS Sites, 2011-2015. ORNL DAAC, Oak Ridge, Tennessee, USA. http://dx.doi.org/10.3334/ORNLDAAC/1416
Table of Contents
- Data Set Overview
- Data Characteristics
- Application and Derivation
- Quality Assessment
- Data Acquisition, Materials, and Methods
- Data Access
- References
Data Set Overview
This data set provides level 2 (L2) hourly volumetric (cm3/cm3) soil moisture profiles from in-ground sensors at seven North American sites as part of the Airborne Microwave Observatory of Subcanopy and Subsurface (AirMOSS) project. Three profiles were installed at each site, sampling at seven different depths per profile (2 cm to 80 cm). Initial sampling began at three sites in September 2011 and additional sites were added during 2012 and 2013. All sampling concluded in December 2015. The AirMOSS project used an airborne radar instrument to estimate root-zone soil moisture at 10 study sites across North America. These in-ground soil moisture data were collected to calibrate and validate the AirMOSS data.
Project: Airborne Microwave Observatory of Subcanopy and Subsurface (AirMOSS)
The goal of NASA’s Airborne Microwave Observatory of Subcanopy and Subsurface (AirMOSS) investigation is to provide high-resolution observations of root-zone soil moisture over regions representative of the major North American climatic habitats (biomes), quantify the impact of variations in soil moisture on the estimation of regional carbon fluxes, and extrapolate the reduced-uncertainty estimates of regional carbon fluxes to the continental scale of North America.
- The AirMOSS campaign used an airborne ultra-high frequency synthetic aperture radar flown on a Gulfstream-III aircraft to derive estimates of soil moisture down to approximately 1.2 meters.
- Extensive ground, tower, and aircraft in-situ measurements were collected to validate root-zone soil measurements and carbon flux model estimates.
The AirMOSS soil measurements can be used to better understand carbon fluxes and their associated uncertainties on a continental scale. Additionally, AirMOSS data provide a direct means for validating root-zone soil measurement algorithms from the Soil Moisture Active & Passive (SMAP) mission and assessing the impact of fine-scale heterogeneities in its coarse-resolution products.
Related Data:
Soil Moisture Profiles and Temperature Data from SoilSCAPE Sites, USA
AirMOSS: L2 Hourly Precipitation at AirMOSS Sites, 2011-2015
A full list of AirMOSS data products is available at: https://airmoss.ornl.gov/dataproducts.html.
Data Characteristics
Spatial Coverage: Seven sites across the USA, Canada, and Mexico
Spatial Resolution: Point locations
Temporal Coverage: 20110901 to 20151231
Temporal Resolution: Hourly
Study Area (coordinates in decimal degrees)
|
Site |
Westernmost Longitude |
Easternmost Longitude |
Northernmost Latitude |
Southernmost Latitude |
|
Selected AirMOSS sites |
-121.5583 |
-72.1712 |
53.9169 |
19.5086 |
Data File Information
There are 29 files in NetCDF v4 (*.nc4) format with this data set.
File-naming convention
L2IGSM_calibrated_SITE_yyyymmdd_vv.nc4
where:
L2IGSM_calibrated = data product name
SITE = six character site name (see Table 1)
yyyymmdd = start date of data file
vv = data version number
Example file names: L2IGSM_calibrated_DUKEFR_20150101_03.nc4
L2IGSM_calibrated_BERMSP_20140101_03.nc4
Table 1. AirMOSS sites where in-ground soil moisture (IGSM) was recorded. The seven standard sampling depths were: 2, 5, 10, 20, 40, 60, 80 cm.
|
Site name |
Site description |
Start date |
End date |
IGSM profile |
Latitude |
Longitude |
Sampling depths |
|
BERMSA |
BERMS (Boreal Ecosystem Research and Monitoring Sites), Old Aspen site, Saskatchewan, Canada. |
20130714 |
20151231 |
1 |
53.6289 |
-106.1979 |
standard |
|
|
|
|
|
2 |
53.6287 |
-106.1983 |
standard |
|
|
|
|
|
3 |
53.6284 |
-106.1985 |
standard |
|
BERMSP |
BERMS (Boreal Ecosystem Research and Monitoring Sites), Old Jack Pine site, Saskatchewan, Canada. |
20120622 |
20151231 |
1 |
53.9167 |
-104.6922 |
standard |
|
|
|
|
|
2 |
53.9167 |
-104.6916 |
standard |
|
|
|
|
|
3 |
53.9169 |
-104.6911 |
standard |
|
CHAMEL |
Chamela Biological Station, Jalisco, Mexico. |
20130303 |
20150930 |
1 |
19.5095 |
-105.0402 |
2, 5, 10, 15, 25, 35, 50 cm |
|
|
|
|
|
2 |
19.5089 |
-105.0407 |
2, 5, 10, 15, 25, 35, 50 cm |
|
|
|
|
|
3 |
19.5086 |
-105.041 |
2, 5, 10, 15, 25, 35, 45 cm |
|
DUKEFR |
Duke Forest site, North Carolina, USA. |
20110907 |
20150923 |
1 |
35.9733 |
-79.1001 |
standard |
|
|
|
|
|
2 |
35.9733 |
-79.0994 |
2, 5 ,10, 20, 30, 50, 70 cm |
|
|
|
|
|
3 |
35.9732 |
-79.1008 |
2, 5, 10, 10, 20, 20, 30 cm |
|
HARVRD |
Harvard Forest site, Massachusetts, USA. |
20110905 |
20151231 |
1 |
42.5378 |
-72.1714 |
standard |
|
|
|
|
|
2 |
42.5381 |
-72.1712 |
standard |
|
|
|
|
|
3 |
42.5385 |
-72.1718 |
standard |
|
METOLI |
Metolius site, Oregon, USA. |
20110923 |
20151231 |
1 |
44.4523 |
-121.5517 |
standard |
|
|
|
|
|
2 |
44.4521 |
-121.5575 |
standard |
|
|
|
|
|
3 |
44.4519 |
-121.5583 |
standard |
|
TONZIR |
Tonzi Ranch site, California, USA. |
20120109 |
20151231 |
1 |
38.43119 |
-120.9667 |
standard |
|
|
|
|
|
2 |
38.4309 |
-120.9659 |
2, 5, 10, 20, 30, 50, 70 cm |
|
|
|
|
|
3 |
38.4301 |
-120.9661 |
2, 5, 10, 20, 30, 45, 65 cm |
Table 2. Data fields in the IGSM data files (e.g. L2IGSM_calibrated_DUKEFR_20150101_03.nc4)
|
Data Field |
Units |
Description |
|
level |
cm |
Depth below ground surface of soil moisture sensor |
|
SP01 |
cm3/cm3 |
Hourly volumetric soil water content for Profile 1 |
|
SP02 |
cm3/cm3 |
Hourly volumetric soil water content for Profile 2 |
|
SP03 |
cm3/cm3 |
Hourly volumetric soil water content for Profile 3 |
|
time |
hours since 2011-01-01 00:00:00 UTC |
Date and time of the data collection |
Application and Derivation
The Level 2 in-ground soil moisture data were collected to calibrate and validate other, higher-level, AirMOSS data products including the Level 2/3 Root Zone Soil Moisture estimates for each AirMOSS flight (Cuenca et al, 2015).
Quality Assessment
These data are provided with no QA information. The in-situ data were subjected to calibration procedures described in detail in Cuenca et al. (2015).
Data Acquisition, Materials, and Methods
The goal of the Airborne Microwave Observatory of Subcanopy and Subsurface (AirMOSS) investigation is to provide high-resolution observations of root-zone soil moisture over regions representative of the major North American climatic habitats (biomes), quantify the impact of variations in soil moisture on the estimation of regional carbon fluxes, and extrapolate the reduced-uncertainty estimates of regional carbon fluxes to the continental scale of North America. See Chapin et al. (2012) for more details.
AirMOSS Flights
These Level 2 in-situ data are one set of products generated by the AirMOSS campaign.
For AirMOSS, NASA's Uninhabited Aerial Vehicle Synthetic Aperture Radar (UAVSAR) was flown on a Gulfstream-III aircraft, making frequent flights over ten sites (given in Table 3) in 9 different biomes of North America over the course of four years. In-ground soil moisture was not measured at all sites.
Table 3. AirMOSS sites
|
Site name |
North latitude |
South latitude |
East longitude |
West longitude |
Fluxnet Site ID |
Description |
|
BermsP |
54.125 |
53.501 |
-103.626 |
-107.125 |
CA-Ojp & CA-Oas |
BERMS (Boreal Ecosystem Research and Monitoring Sites), Saskatchewan, Canada. Landcover: Mixed boreal forest. Elevation: 518m. |
|
Chamel |
20.326 |
19.316 |
-104.22 |
-105.29 |
MX-Cha |
Chamela Biological Station, Jalisco, Mexico. Landcover: Seasonally dry tropical forest. Elevation: 58m. |
|
DukeFr |
36.368 |
35.437 |
-78.694 |
-79.849 |
US-Dk1,US-Dk2, US-Dk3 |
Duke Forest site, North Carolina, USA. Landcover: Mature oak-hickory dominated hardwood forest. Elevation: 169m. |
|
Harvrd |
43.376 |
42.293 |
-71.839 |
-72.389 |
US-Ha1 & US-Ha2 |
Harvard Forest site, Massachusetts, USA. Landcover: Temperate deciduous forest. Elevation: 353m. |
|
Howlnd |
45.778 |
44.669 |
-68.336 |
-69.086 |
US-Ho1, US-Ho2, US-Ho3 |
Howland Forest site, Maine, USA. Landcover: boreal - northern hardwood transitional forest. Elevation 72m. |
|
LaSelv |
10.878 |
9.92 |
-83.519 |
-84.57 |
CR-Lse |
La Selva Biological Station, Costa Rica. Landcover: tropical rain forest. Elevation 93m. |
|
Metoli |
45.242 |
43.38 |
-120.363 |
-123.283 |
US-Me1 to US-Me6 |
Metolius site, Oregon, USA. Landcover: evergreen needleleaf forest. Elevation 1237m. |
|
Oklaho or Moisst |
36.880 |
35.775 |
-96.824 |
-98.996 |
US-ARM |
The Marena, Oklahoma In Situ Sensor Testbed (MOISST) is located in Oklahoma, USA. Landcover: temperate grasslands, crops. Elevation: 312m. |
|
TonziR |
38.625 |
37.501 |
-120.001 |
-121.25 |
US-Ton |
Tonzi Ranch site, California, USA. Landcover: oak savanna and grazed grassland. Elevation 170m. |
|
Walnut |
32.125 |
31.501 |
-109.376 |
-111.5 |
US-Wkg & US-Whs |
Walnut Gulch site, Arizona, USA. Landcover: warm season C4 grassland with a few shrubs. Elevation 1524m. |
Beginning in September 2012, the AirMOSS instrument flew 215 flight campaigns. A summary of flight campaigns by year and site is found in Table 4. Typically, the aircraft made repeat visits to sites in the same region in a single week and then proceeded to another region. Most sites had at least three campaigns per year. The Harvard and Howland forest sites were flown together in a single day. In 2012, Chamela, La Selva, and Tonzi were not surveyed.
Table 4. Summary of AirMOSS flight campaigns.
|
Site |
||||||||||
|
Year |
BermsP |
Chamel |
DukeFr |
Harvrd |
Howlnd |
LaSelv |
Metoli |
Oklaho |
TonziR |
Walnut |
|
2012 |
3 |
0 |
3 |
3 |
3 |
0 |
4 |
3 |
0 |
3 |
|
2013 |
6 |
3 |
9 |
9 |
9 |
6 |
7 |
8 |
5 |
6 |
|
2014 |
7 |
3 |
10 |
9 |
9 |
3 |
9 |
9 |
6 |
5 |
|
2015 |
9 |
2 |
5 |
5 |
5 |
3 |
9 |
6 |
5 |
6 |
|
Total |
25 |
8 |
27 |
26 |
26 |
12 |
29 |
26 |
16 |
20 |
A complete list of AirMOSS flights can be found at: https://airmoss.ornl.gov/flights.html.
AirMOSS Level 2 In Ground Soil Moisture Data
The objective of the in situ soil profile instrumentation was specifically to monitor soil water content over a depth representative of that which will have an impact on the P-band radar signal. Each of the seven AirMOSS sites sampled (Table 1) had three monitored soil profiles installed approximately 40 to 50 m apart along a “representative” (in terms of soil texture and vegetation) transect within the footprint of the flux tower. The in-situ observation system for the NASA AirMOSS project used 5-TE and 5-TM sensors by Decagon Devices (Pullman, WA) to observe volumetric SWC. Standard installation depths for these sensors at these sites were 2, 5, 20, 40 60 and 80 cm depths. In addition to volumetric SWC and temperature, the 5-TE is capable of measuring electrical conductivity in soil. These sensors determine volumetric water content by measuring the apparent (or bulk) dielectric permittivity (Eb) of the media (e.g. soils and peat) using capacitance/frequency domain technology. Since 5-TE and 5-TM sensors were installed in various soils in different biomes for this project, verification and calibration of these sensors was critical. Calibration of 5- TE and 5-TM sensors consists of two steps: 1) sensor specific calibration and 2) site specific calibration. Calibration methods and additional details are available in Cuenca et al. (2015).
Data Access
These data are available through the Oak Ridge National Laboratory (ORNL) Distributed Active Archive Center (DAAC).
AirMOSS: L2 Hourly In-Ground Soil Moisture at AirMOSS Sites, 2011-2015
Contact for Data Center Access Information:
- E-mail: uso@daac.ornl.gov
- Telephone: +1 (865) 241-3952
References
Chapin, E., A. Chau, J. Chen, B. Heavey, S. Hensley, Y. Lou, R. Machuzak, and M. Moghaddam. 2012. AirMOSS: An Airborne P-band SAR to measure root-zone soil moisture, 2012 IEEE Radar Conference, Atlanta, GA, 2012, pp. 0693-0698. http://dx.doi.org/10.1109/RADAR.2012.6212227
Cuenca, R.H.,Y. Hagimoto, T.M. Ring, and J.P. Beamer. 2015. Interpretation of in situ observations in support of P-band radar retrievals. Geoscience and Remote Sensing Symposium (IGARSS), 2015 IEEE International. 5083-5086. http://dx.doi.org/10.1109/IGARSS.2015.7326976