Documentation Revision Date: 2021-02-02
Dataset Version: 1.2
Summary
ACT-America's overall mission spanned four years and included airborne campaigns covering all four seasons over central and eastern regions of the United States. ACT-America's objectives were to study the transport and fluxes of atmospheric CO2 and CH4. Two instrumented aircraft platforms, the NASA Langley Beechcraft B-200 King Air and the NASA Wallops Flight Facility's C-130 Hercules, were used to collect high-quality in-situ measurements across a variety of continental surfaces and atmospheric conditions. At times they flew directly under Orbiting Carbon Observatory-2 (OCO-2) overpasses to evaluate the ability of OCO-2 to observe high-resolution atmospheric CO2 variations. The C-130 aircraft was also equipped with active remote sensing instruments for planetary boundary layer height detection and column greenhouse gas measurements.
This dataset contains 2,188 data files total; 1,094 files in netCDF (*.nc) format and 1,094 data files in ICARTT (*.ict) format. The netCDF variables are structured as GeoTrajectory along each flight segment. Each netCDF file has a corresponding file in ICARTT format that has identical trace gas data but the ICARTT file contains no aircraft navigation or meteorological data.
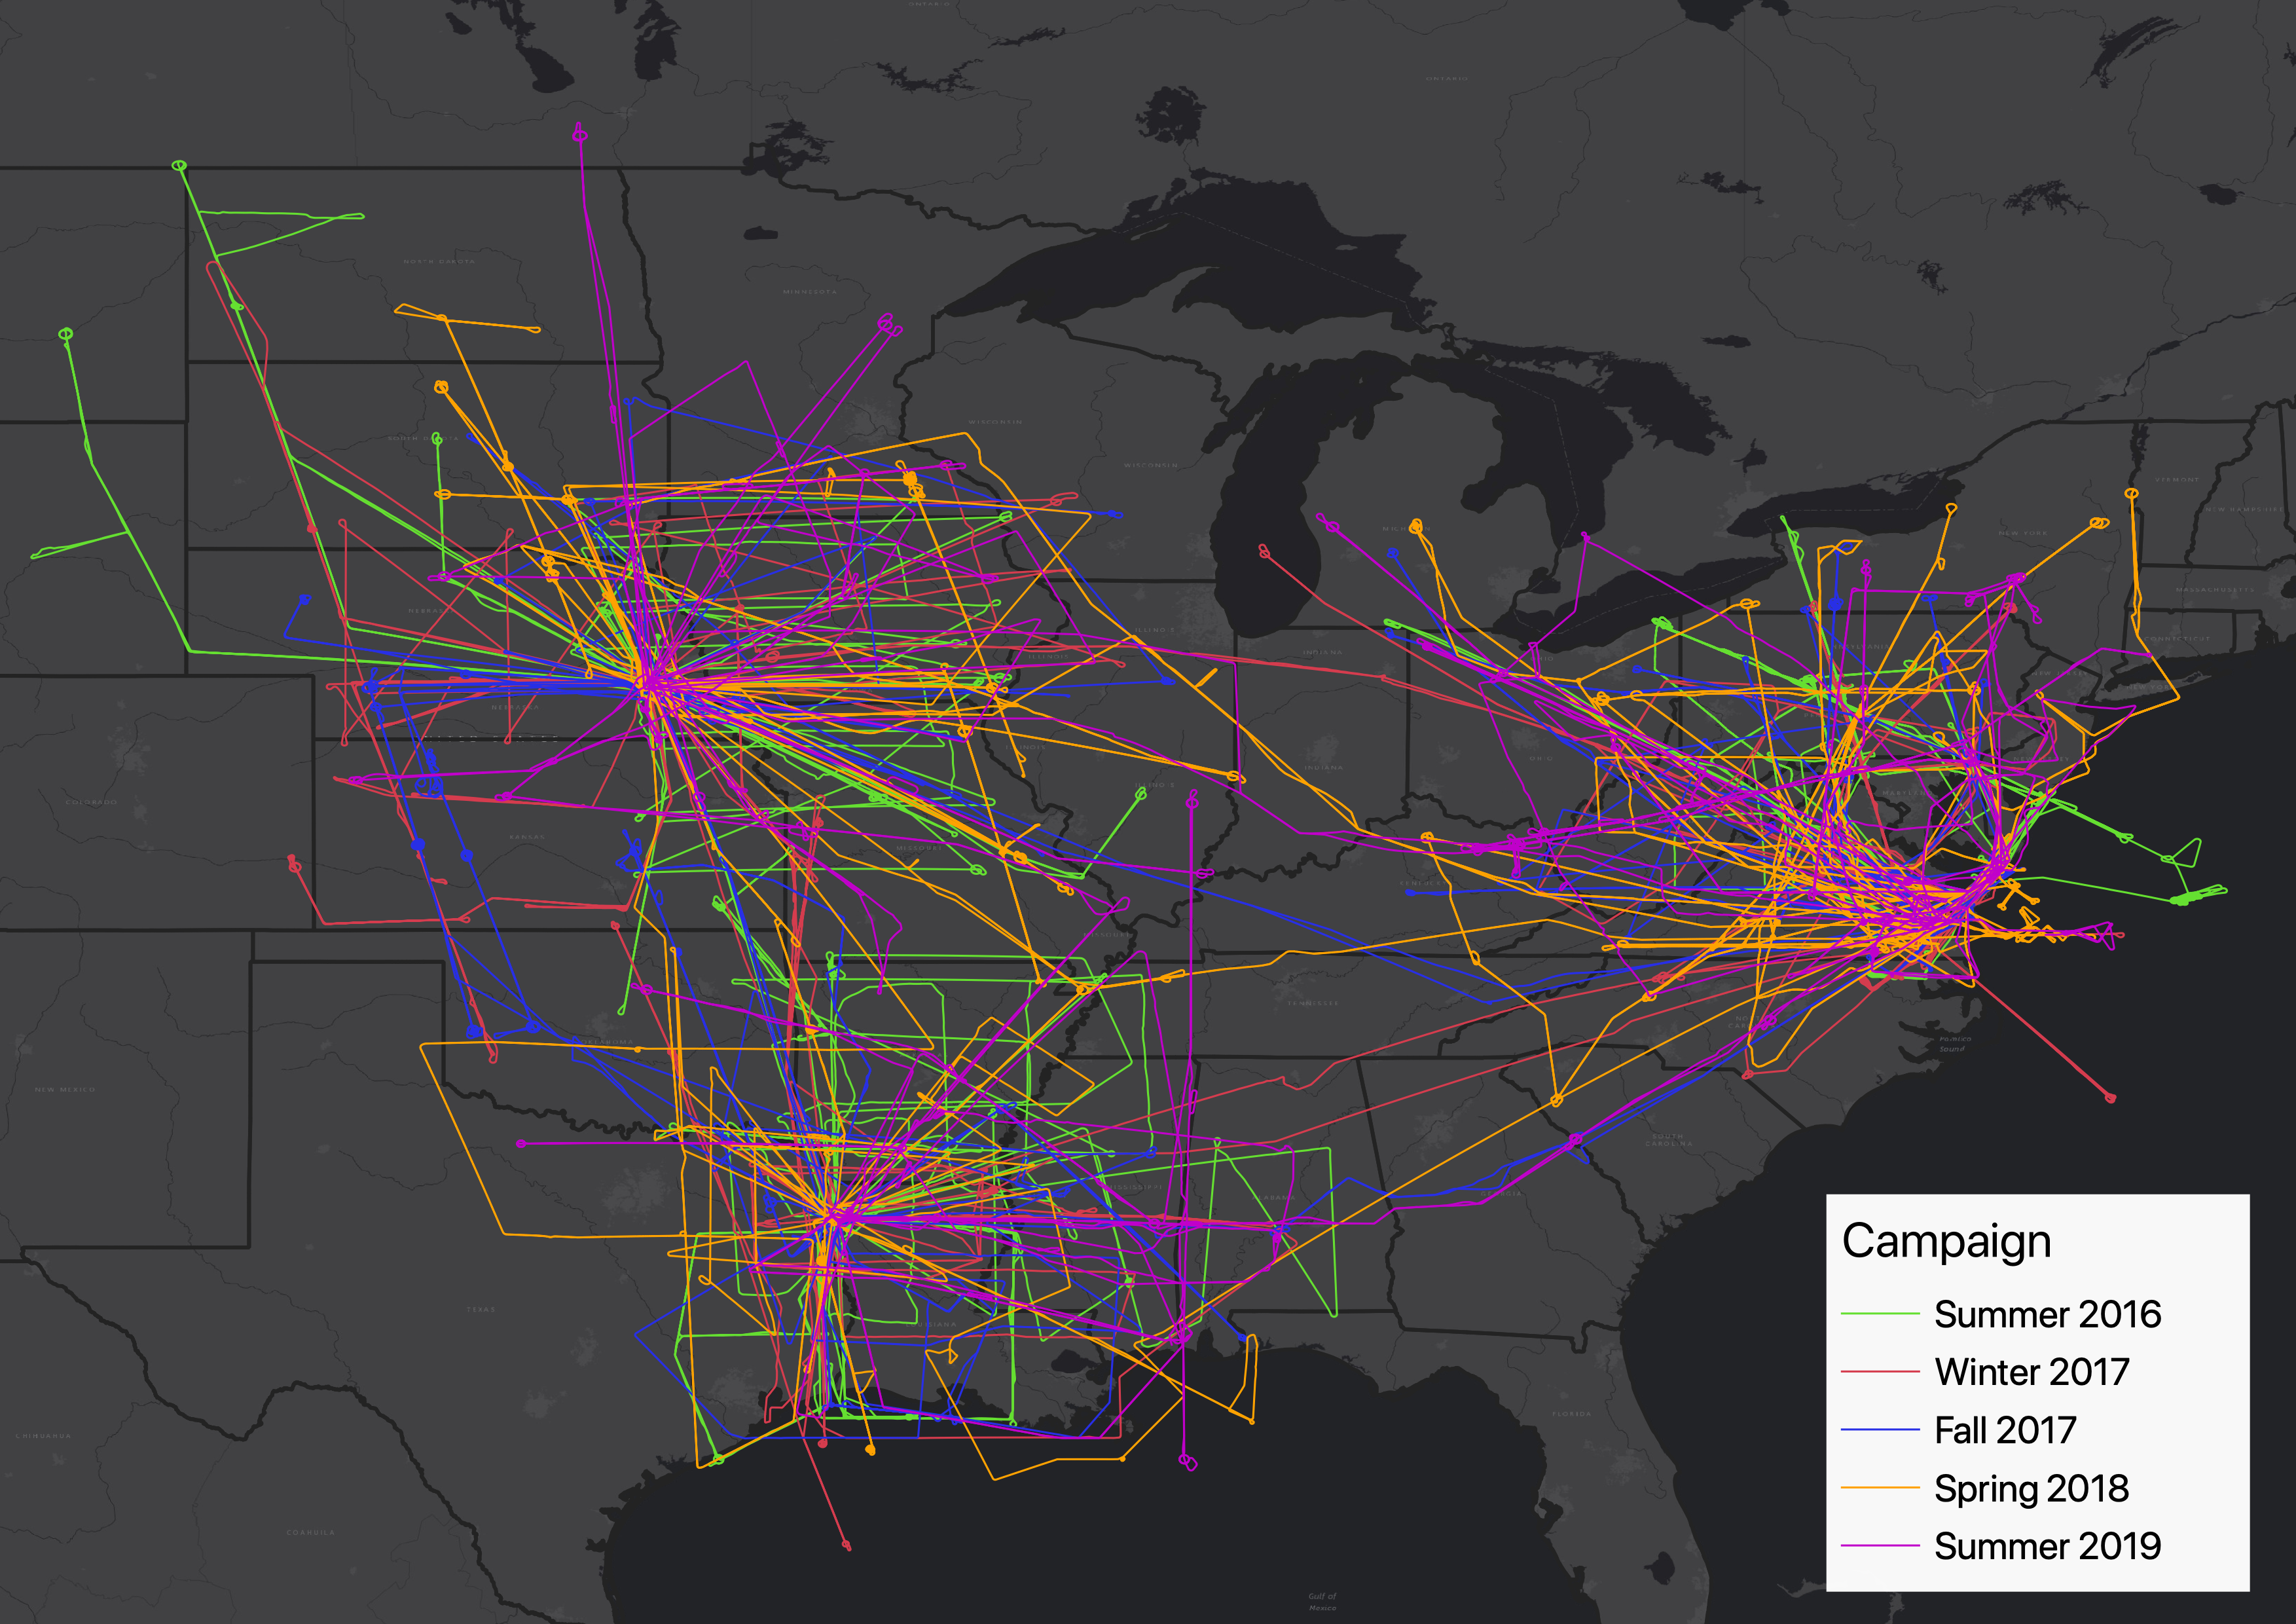
Figure 1. Flight paths for all five airborne campaigns of ACT-America. Flights were concentrated on three study areas: the northeast, south-central, and midwest regions of the United States.
Citation
DiGangi, J.P., Y. Choi, J.B. Nowak, H.S. Halliday, M.M. Yang, B.C. Baier, and C. Sweeney. 2018. ACT-America: L2 In Situ Atmospheric CO2, CO, CH4, and O3 Concentrations, Eastern USA. ORNL DAAC, Oak Ridge, Tennessee, USA. https://doi.org/10.3334/ORNLDAAC/1556
Table of Contents
- Dataset Overview
- Data Characteristics
- Application and Derivation
- Quality Assessment
- Data Acquisition, Materials, and Methods
- Data Access
- References
- Dataset Revisions
Dataset Overview
This dataset provides atmospheric carbon dioxide (CO2), carbon monoxide (CO), methane (CH4), water vapor (H2O) and ozone (O3) concentrations collected during airborne campaigns conducted by the Atmospheric Carbon and Transport-America (ACT-America) project. ACT-America's mission spanned 4 years and included five 6-week airborne campaigns covering all 4 seasons and 3 regions of the central and eastern United States. This dataset provides results from all five campaigns, including Summer 2016, Winter 2017, Fall 2017, Spring 2018, and Summer 2019. Two instrumented aircraft platforms, the NASA Langley Beechcraft B200 King Air and the NASA Goddard Space Flight Center's C-130H Hercules, were used to collect high-quality in situ measurements across a variety of continental surfaces and atmospheric conditions. CO2, CO, CH4, and H2O were collected with an infrared cavity ring-down spectrometer system (CRDS; Picarro Inc.). Ozone data were collected with a dual beam differential UV absorption ozone monitor (Model 205; 2B Technologies). Both aircraft hosted identical arrays of in situ sensors. Complete aircraft flight information including, but not limited to, latitude, longitude, altitude, and meteorological conditions are also provided.
ACT-America's overall mission spanned four years and included airborne campaigns covering all four seasons over central and eastern regions of the United States. ACT-America's objectives were to study the transport and fluxes of atmospheric CO2 and CH4. Two instrumented aircraft platforms, the NASA Langley Beechcraft B-200 King Air and the NASA Wallops Flight Facility's C-130 Hercules, were used to collect high-quality in-situ measurements across a variety of continental surfaces and atmospheric conditions. At times they flew directly under Orbiting Carbon Observatory-2 (OCO-2) overpasses to evaluate the ability of OCO-2 to observe high-resolution atmospheric CO2 variations. The C-130 aircraft was also equipped with active remote sensing instruments for planetary boundary layer height detection and column greenhouse gas measurements.
Project: Atmospheric Carbon and Transport - America
The ACT-America, or Atmospheric Carbon and Transport - America, project was a NASA Earth Venture Suborbital-2 mission to study the transport and fluxes of atmospheric carbon dioxide and methane across three regions in the eastern United States. ACT-America conducted five flight campaigns spanning all four seasons throughout 2016–2019 and measured how weather systems transported greenhouse gases. Ground-based measurements were also collected. The objective of the study was to enable more accurate and precise estimates of the sources and sinks of greenhouse gases, as better estimates are needed for climate management and for prediction of future climate. Three primary sources of uncertainty (i.e., transport error, prior flux uncertainty, and limited data density) were addressed to improve the inference of carbon dioxide and methane sources and sinks.
Related Datasets
Davis, K.J., M.D. Obland, B. Lin, T. Lauvaux, C. O'Dell, B. Meadows, E.V. Browell, J.P. DiGangi, C. Sweeney, M.J. McGill, J.D. Barrick, A.R. Nehrir, M.M. Yang, J.R. Bennett, B.C. Baier, A. Roiger, S. Pal, T. Gerken, A. Fried, S. Feng, R. Shrestha, M.A. Shook, G. Chen, L.J. Campbell, Z.R. Barkley, and R.M. Pauly. 2018. ACT-America: L3 Merged In Situ Atmospheric Trace Gases and Flask Data, Eastern USA. ORNL DAAC, Oak Ridge, Tennessee, USA. https://doi.org/10.3334/ORNLDAAC/1593
Pal, S. 2019. ACT-America: Profile-based Planetary Boundary Layer Heights, Eastern USA. ORNL DAAC, Oak Ridge, Tennessee, USA. https://doi.org/10.3334/ORNLDAAC/1706
Yang, M.M., J.D. Barrick, C. Sweeney, J.P. Digangi, and J.R. Bennett. 2018. ACT-America: L1 Meteorological and Aircraft Navigational Data. ORNL DAAC, Oak Ridge, Tennessee, USA. https://doi.org/10.3334/ORNLDAAC/1574
Acknowledgments
This work was supported by NASA EVS-2 grant number NNX15AG76G.
Data Characteristics
Spatial Coverage: Eastern and central United States
Spatial Resolution: Point measurements
Temporal Coverage: Periodic flights occurred during each intensive campaign.
| Campaign | Beginning and Ending Dates |
|---|---|
| Summer 2016 | 2016-07-11 to 2016-08-28 |
| Winter 2017 | 2017-01-21 to 2017-03-10 |
| Fall 2017 | 2017-10-03 to 2017-11-13 |
| Spring 2018 | 2018-04-12 to 2018-05-20 |
| Summer 2019 | 2019-06-17 to 2019-07-27 |
Temporal Resolution: Approximately 1–2 seconds depending on instrument and flight.
Study Area: Latitude and longitude are given in decimal degrees.
| Site | Northernmost Latitude | Southernmost Latitude | Westernmost Longitude | Easternmost Longitude |
|---|---|---|---|---|
| Eastern and Central United States | 50.550 | 27.230 | -106.494 | -71.911 |
Data File Information
This dataset contains 2,188 data files total; 1,094 files in netCDF (*.nc) format and 1,094 data files in ICARTT (*.ict) format. The netCDF variables are structured as GeoTrajectory along each flight segment. Each netCDF file has a corresponding file in ICARTT format.
NetCDF files follow the standards of the NetCDF Climate and Forecast (CF) Metadata Conventions V1.6. Variables are structured as GeoTrajectory, where the observations for a flight segment are connected along a one-dimensional track in space and with time increasing monotonically along the track. These files contain gas concentrations and data from the respective aircraft’s flight navigation system and meteorological instruments.
ICARTT files follow ICARTT File Format Standards V1.1. The ICARTT files contain the same gas concentration data as the netCDF files (i.e., Start_UTC, Stop_UTC, Mid_UTC, CH4_PIC_ppm) but no navigational or meteorological information.
Companion File Information
Additional information on the aircraft platforms deployed by ACT-America is provided in Platform_B200.pdf and Platform_C130.pdf.
Data File Details
File Naming Convention
Files are organized by instrument and aircraft for the flights on a given date. The naming convention is the same for netCDF and ICARTT files. Files are named according to the format ACTAMERICA-<instrument>_<aircraft>_<YYYYMMDD>_<R#>_<L#>.<ext> (e.g., ACTAMERICA-Ozone_B200_20160711_R1.nc), where
<instrument> is 'Ozone', 'PICARRO', 'PICARRO-CH4', 'PICARRO-CO', 'PICARRO-CO2', or 'PICARRO-H2O',
<aircraft> is either 'B200' or 'C130',
<YYYYMMDD> is the flight date in UTC time,
<R#> is the revision number of the data, where a higher number indicates a more recent revision (e.g., R1 = first revision),
<L#> is the launch number as some flights had more than one launch (e.g., L1 = first launch), and
<ext> is the file extension, either '.nc' (netCDF) or '.ict' (ICARTT).
Quality Flags
Missing values: All missing data are flagged with a value of -9999.
LOD flags: If any portion of the averaging period contains a Limit of Detection (LOD) value for a given measurement, the value is marked with a LOD flag.
- Measurements above the upper LOD are flagged with -7777.
- Measurements below the lower LOD are flagged with -8888.
The measurement upper and lower LOD values (or N/A) are provided in the netCDF global attributes and ICARTT header as applicable.
Table 1. Names and descriptions for variables in respective instrument files.
| Instrument | Variable name | Units | Description |
|---|---|---|---|
| PICARRO (Summer 2016 campaign only) | CH4_PIC_ppmv, CO_PIC_ppmv, CO2_PIC_ppmv | parts per million volume | Methane mixing ratio, Carbon monoxide mixing ratio, Carbon dioxide mixing ratio |
| PICARRO-CH4 | CH4_PIC_ppmv | parts per million volume | Methane mixing ratio |
| PICARRO-CO | CO_PIC_ppmv | parts per million volume | Carbon monoxide mixing ratio |
| PICARRO-CO2 | CO2_PIC_ppmv | parts per million volume | Carbon dioxide mixing ratio |
| PICARRO-H2O | H2O_PIC_pct | percent | Water vapor volume mixing ratio |
| PICARRO-H2O | H2O_PIC_gkg | grams per kilogram | Water vapor mass mixing ratio |
| PICARRO-H2O | eH2O_PIC_mbar | millibars | Derived water vapor pressure |
| PICARRO-H2O | RHi_PIC_pct | percent | Derived relative humidity wrt ice |
| PICARRO-H2O | RHw_PIC_pct | percent | Derived relative humidity wrt liquid water |
| PICARRO-H2O | DP_PIC_degC | Celsius | Derived dew point |
| Ozone | O3_ppbv | parts per billion volume | Ozone mixing ratio |
User Note: The ICARTT files contain the same gas concentration data as the netCDF files (e.g., Start_UTC, Stop_UTC, Mid_UTC, and CH4_PIC_ppm) but no navigational or meteorological information.
Table 2. Names and descriptions of navigation and meteorological variables. These variables are present in the netCDF files.
| Variable name | Units | Description |
|---|---|---|
| time | seconds | seconds since 2016-01-01 00:00:00.0 UTC |
| time_bnds | boundary (start and end time) of each time step | |
| Start_UTC | seconds | start UTC time of day for measurement |
| Stop_UTC | seconds | stop UTC time of day for measurement interval |
| Mid_UTC | seconds | mean UTC time of day of measurement interval |
| Flight_ID | Flight identification (aircraft and flight date) | |
| Aircraft_Sun_Azimuth | degree | Platform azimuth angle |
| Aircraft_Sun_Elevation | degree | Solar elevation angle |
| Cabin_Pressure | millibars | Air pressure of cabin |
| Day_of_Year | day | Day of year starting Jan 1 UTC |
| Dew_Point | Celsius | Dew point temperature |
| Drift_Angle | degree | Drift angle |
| GPS_Altitude | meters | Global Positioning System altitude |
| GPS_Time | hours since 2016-01-01 00:00:00.0 UTC | Time |
| Ground_Speed | meters per second | Platform speed with respect to ground |
| Indicated_Air_Speed | knots | Indicated air speed |
| Latitude | degree north | Latitude, EPSG: 4326 |
| Longitude | degree east | Longitude, EPSG: 4326 |
| Mach_Number | Mach number | |
| Mixing_Ratio | grams per kilogram | H2O mixing ratio |
| Part_Press_Water_Vapor | millibars | Water vapor partial pressure in air |
| Pitch_Angle | degree | Platform pitch angle |
| Potential_Temp | Celsius | Potential temperature |
| Pressure_Altitude | feet | Barometric altitude |
| Relative_Humidity | percent | Relative humidity |
| Roll_Angle | degree | Platform roll angle |
| Sat_Vapor_Press_H2O | millibars | H2O saturation vapor pressure of water |
| Sat_Vapor_Press_Ice | millibars | H2O saturation vapor pressure of ice |
| Solar_Zenith_Angle | degree | Solar zenith angle |
| Static_Air_Temp | Celsius | Static air temperature |
| Static_Pressure | millibars | Air pressure |
| Sun_Azimuth | degree | Solar azimuth angle |
| Total_Air_Temp | Celsius | Total air temperature |
| Track_Angle | degree | Track angle |
| True_Air_Speed | knots | Platform speed with respect to air |
| True_Heading | degree | Platform yaw angle |
| Vertical_Speed | feet per minute | Vertical speed |
| Wind_Direction | degree | Wind direction |
| Wind_Speed | meters per second | Wind speed |
| Altitude_AGL_m | meters | Aircraft altitude above ground level |
| Ground_Elevation_m | meters | Ground elevation above mean sea level |
Data Center Processing
The ORNL DAAC created netCDF files for each of the provided ICARTT files. Aircraft navigation and meteorological information were added to the netCDF files from Pal (2019) for B-200 flights and Yang et al. (2018) for C-130 flights.
Application and Derivation
ACT-America, or Atmospheric Carbon and Transport - America, conducted five airborne campaigns across three regions in the eastern United States to study the transport and fluxes of atmospheric carbon. The eastern half of the United States is a region that includes a highly productive biosphere, vigorous agricultural activity, extensive gas and oil extraction and consumption, dynamic, seasonally varying weather patterns and the most extensive carbon cycle and meteorological observing networks on Earth, serves as an ideal setting for the mission.
Each 6-week campaign accurately and precisely quantified anomalies in atmospheric carbon, also known as carbon flux. Accurate carbon flux data is necessary to address all terrestrial carbon cycle science questions. ACT-America addressed the three primary sources of uncertainty in atmospheric inversions—transport error, prior flux uncertainty, and limited data density.
ACT-America advances society’s ability to predict and manage future climate change by enabling policy-relevant quantification of the carbon cycle. Sources and sinks of atmospheric carbon dioxide (CO2) and methane (CH4) are poorly known at regional to continental scales. ACT-America enables and demonstrates a new generation of atmospheric inversion systems for quantifying CO2 and CH4 sources and sinks.
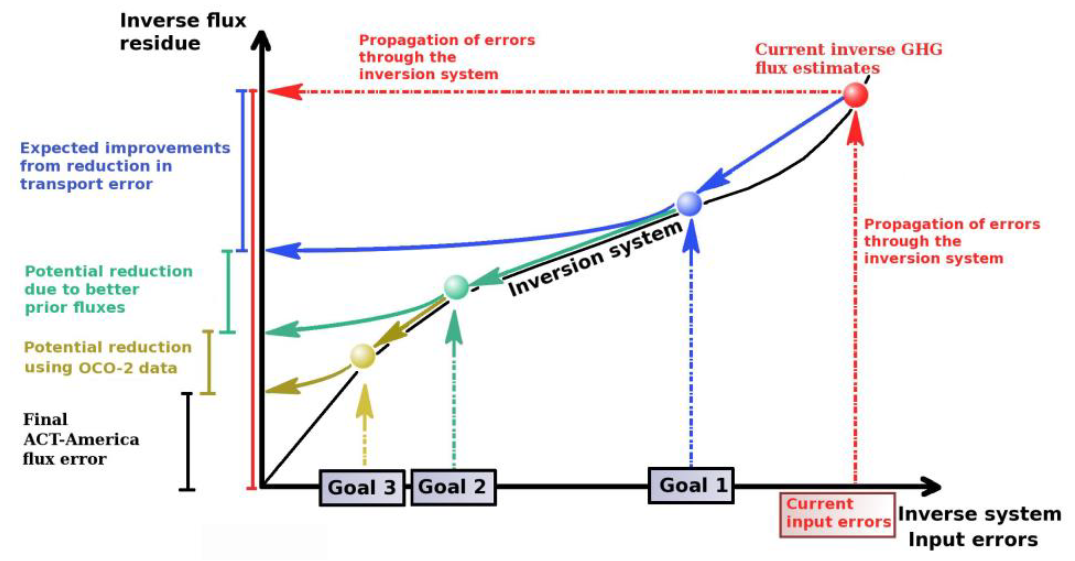
Figure 2. A schematic showing ACT-America mission goals.
ACT-America Goals:
- To quantify and reduce atmospheric transport uncertainties.
- To improve regional-scale, seasonal prior estimates of CO2 and CH4 fluxes.
- To evaluate the sensitivity of Orbiting Carbon Observatory (OCO-2) column measurements to regional variability in tropospheric CO2.
ACT-America achieved these goals by deploying airborne and ground-based platforms to obtain data that were combined with data from existing measurement networks and integrated with an ensemble of atmospheric inversion systems. Aircraft instrumented with remote and in-situ sensors observed how mid-latitude weather systems interact with CO2 and CH4 sources and sinks to create atmospheric CO2/CH4 distributions. A model ensemble consisting of a mesoscale atmospheric transport model with multiple physics and resolutions options nested within global inversion models and surface CO2/CH4 flux ensembles was used to predict atmospheric CO2 and CH4 distributions.
Beyond the conclusion of the mission, the application of knowledge gained from this mission will improve diagnoses of the carbon cycle across the globe for decades.
Quality Assessment
Picarro G2301
These instruments exceed the precision requirements of the baseline science objective for the mission for all four gases (Karion et al., 2013). Accuracies of 0.2 ppm for CO2 and 2 ppb for CH4 also exceed mission accuracy requirements of 1 ppm for CO2 and 4 ppb for CH4.
2B Technologies Model 205
The O3 monitor has been previously flown on tropospheric chemistry field missions and meets the accuracy and precision requirements for the baseline science objectives of the mission (Bertschi et al., 2004).
Table 3. Instrument precision as provided in the ACT-America proposal.
| Instrument | Platform | Technique | Species/Parameter | Instrument Precision (Averaging Time) | STM Precision Requirement [over 20 km (~130 sec) unless otherwise noted] |
|---|---|---|---|---|---|
| 2B Technologies Model 205 | C-130H, B-200 | Laser Spectrometer | O3 | 1 ppb (10 sec) | 8 ppb |
| Picarro G2301 | Tower | Cavity Ring-Down Spectroscopy | CO2, CH4 | ≤ 0.07 ppm CO2 ≤ 0.5 ppb CH4 (both 5 sec) |
1 ppm hourly CO2 4 ppb hourly CH4 |
Data Acquisition, Materials, and Methods
ACT-America Overview
ACT-America deployed the NASA C-130 and B-200 aircraft to measure atmospheric CO2 and CH4 in the atmospheric boundary layer (ABL) and free troposphere (FT). In all five seasonal campaigns, a total of 121 days of research flights, more than 1,140 hours of observations, 570 level legs, and 1,363 vertical profiles were conducted. Flights concentrated observations on three study domains: Northeast, South-central, and Midwest. These flights were dedicated in a roughly 3:3:1 ratio among fair weather, stormy weather, and OCO-2 underpass flight patterns (Crisp et al., 2004, Crisp et al., 2008).
For fair and stormy weather flights, the C-130 flew at 3–8 km above ground, collecting in-situ measurements in the lower FT, remotely sensed, column-averaged CO2 measurements focused on the ABL, and occasional in-situ vertical profiles. The B-200 primarily sampled the ABL. For OCO-2 under flights, the C-130 flew at 8 km above ground with the B-200 flying in the ABL, both along the OCO-2 flight track. The existing in situ tower CO2/CH4 observing network was enhanced with five additional tower sites.
The mission delivered 2-3 times more high-quality lower tropospheric CO2 and CH4 observations than any previous airborne campaign.
Flight Plans
Data from the fair-weather flights are intended to quantify regional CO2 and CH4 fluxes, and to evaluate fair weather atmospheric C transport processes. The flight pattern is designed to provide extensive sampling of the ABL and lower FT in source/sink regions, meeting the requirements for the fair weather investigation. The C-130 aircraft will fly a U-shape pattern with flight legs perpendicular to the wind, sampling FT and ABL properties downwind of the sources and sinks of C. The C-130 will fly at roughly two times the midday ABL depth, (3–4 km above ground level) with periodic descents and ascents (5–10 times in a 6–8 hr flight) to sample the ABL. Although clear sky conditions will be targeted, the C-130 will conduct more profiling if low-altitude clouds interfere with the remote sensors. The B-200 aircraft will partake in two flights per day and will sample a subset of the C-130 flight path focusing on long transects in the ABL with periodic ascents to the FT. The two aircraft will operate over the same time period, but precise coordination is not required.
Data from stormy-weather flights will be used in combination with the data from fair-weather flights to evaluate the transport of C in the mid-latitudes. The flight plans include flight legs parallel to and crossing frontal boundaries at two or more altitudes, and crossing the frontal zone at two or more locations, meeting the requirements for the stormy weather investigation.
The pattern for the OCO-2 inter-comparison flights is designed to obtain data to evaluate the degree to which OCO-2 column CO2 measurements capture true spatial variability in column CO2 content over the continents. Two OCO-2 under flights will be conducted during each campaign and will be selected to cover varying surface reflectance, topography, and aerosol and cloud cover, all possible sources of bias in the OCO-2 measurements. The C-130 flights will be 1,000 km in length and flown at 8 km (28 ft) altitude to maximize the fraction of the atmospheric column sampled by the MFLL. The B-200 aircraft will sample a shorter (~360 km) leg in the ABL, often the largest source of variability in column CO2. The B-200 flight will be centered with the C-130 and both aircraft will be vertically stacked during the OCO-2 overpass.
Airborne Instruments
ACT-America deployed high-quality, field-tested trace gas and meteorological instruments. For this dataset, the C-130 aircraft carried continuous CO2/CH4/H2O/CO analyzers, a cavity ring-down spectroscopy (CRDS) instrument (Picarro Inc.) used for rapid measurement of trace gas mole fractions (Crosson, 2008), and continuous O3 monitors. The B-200 has the same in situ sensors except for winds.
Picarro G2301
The C-130 and B-200 both have Picarro instruments. The Picarro instruments have been extensively tested on aircraft flights (Karion et al., 2013; Mays et al., 2009; Turnbull et al., 2011). Picarro analyzers are based on Wavelength-Scanned Cavity Ring Down Spectroscopy (WS-CRDS), a time-based measurement utilizing a near-infrared laser to measure a spectral signature of molecular absorption. Gas flows through a 35-cc optical cavity with an effective path length of up to 20 km and pressure of 140 Torr. Extremely stable and high-precision measurements are achieved through cavity temperature, pressure, and wavelength laser frequency control to better than 0.002°C, 0.00003 atm, and 1 MHz, respectively. Aircraft instruments are similar to surface-based sensors, but use faster flow rates, solid-state data storage, and additional vibration isolation. These instruments exceed the precision requirements of the baseline science objectives for all four gases (Karion et al., 2013). Accuracies of 0.2 ppm for CO2 and 2 ppb for CH4 (Karion et al., 2013) also exceed mission accuracy requirements of 1 ppm for CO2 and 4 ppb for CH4.
2B Technologies Model 205
The Model 205 O3 monitor uses two ultraviolet beams in two cells to simultaneously measure O3-scrubbed air and unscrubbed air. This model has been approved by the Environmental Protection Agency as a Federal Equivalent Method (FEM) and is the fastest UV-based O3 monitor available. The O3 monitor has been previously flown on tropospheric chemistry field missions and meets the accuracy and precision requirements laid out in the STM (Bertschi et al., 2004).
Data Access
These data are available through the Oak Ridge National Laboratory (ORNL) Distributed Active Archive Center (DAAC).
ACT-America: L2 In Situ Atmospheric CO2, CO, CH4, and O3 Concentrations, Eastern USA
Contact for Data Center Access Information:
- E-mail: uso@daac.ornl.gov
- Telephone: +1 (865) 241-3952
References
Bertschi, I.T., D.A. Jaffe, L. Jaeglé, H.U. Price, and J.B. Dennison. 2004. PHOBEA/ITCT 2002 airborne observations of transpacific transport of ozone, CO, volatile organic compounds, and aerosols to the northeast Pacific: Impacts of Asian anthropogenic and Siberian boreal fire emissions. Journal of Geophysical Research: Atmospheres 109. https://doi.org/10.1029/2003JD004328
Crisp, D., R.M. Atlas, F.-M. Breon, L.R. Brown, J.P. Burrows, P. Ciais, B.J. Connor, S.C. Doney, I.Y. Fung, D.J. Jacob, C.E. Miller, D. O’Brien, S. Pawson, J.T. Randerson, P. Rayner, R.J. Salawitch, S.P. Sander, B. Sen, G.L. Stephens, P.P. Tans, G.C. Toon, P.O. Wennberg, S.C. Wofsy, Y.L. Yung, Z. Kuang, B. Chudasama, G. Sprague, B. Weiss, R. Pollock, D. Kenyon, and S. Schroll. 2004. The Orbiting Carbon Observatory (OCO) mission. Advances in Space Research 34:700–709. https://doi.org/10.1016/j.asr.2003.08.062
Crisp, D. 2008. NASA Orbiting Carbon Observatory: measuring the column averaged carbon dioxide mole fraction from space. Journal of Applied Remote Sensing 2:023508. https://doi.org/10.1117/1.2898457
Crosson, E. R. 2008. A cavity ring-down analyzer for measuring atmospheric levels of methane, carbon dioxide, and water vapor. Applied Physics B 92:403–408. https://doi.org/10.1007/s00340-008-3135-y
Davis, K.J., M.D. Obland, B. Lin, T. Lauvaux, C. O'Dell, B. Meadows, E.V. Browell, J.P. DiGangi, C. Sweeney, M.J. McGill, J.D. Barrick, A.R. Nehrir, M.M. Yang, J.R. Bennett, B.C. Baier, A. Roiger, S. Pal, T. Gerken, A. Fried, S. Feng, R. Shrestha, M.A. Shook, G. Chen, L.J. Campbell, Z.R. Barkley, and R.M. Pauly. 2018. ACT-America: L3 Merged In Situ Atmospheric Trace Gases and Flask Data, Eastern USA. ORNL DAAC, Oak Ridge, Tennessee, USA. https://doi.org/10.3334/ORNLDAAC/1593
Karion, A., C. Sweeney, G. Pétron, G. Frost, R. Michael Hardesty, J. Kofler, B.R. Miller, T. Newberger, S. Wolter, R. Banta, A. Brewer, E. Dlugokencky, P. Lang, S. A. Montzka, R. Schnell, P. Tans, M. Trainer, R. Zamora, and S. Conley. 2013. Methane emissions estimate from airborne measurements over a western United States natural gas field. Geophysical Research Letters 40:4393–4397. https://doi.org/10.1002/grl.50811
Mays, K. L., P.B. Shepson, B.H. Stirm, A. Karion, C. Sweeney, and K.R. Gurney. 2009. Aircraft-Based Measurements of the Carbon Footprint of Indianapolis. Environmental Science & Technology 43:7816–7823. https://doi.org/10.1021/es901326b
Pal, S. 2019. ACT-America: Profile-based Planetary Boundary Layer Heights, Eastern USA. ORNL DAAC, Oak Ridge, Tennessee, USA. https://doi.org/10.3334/ORNLDAAC/1706
Turnbull, J.C., A. Karion, M.L. Fischer, I. Faloona, T. Guilderson, S.J. Lehman, B.R. Miller, J.B. Miller, S. Montzka, T. Sherwood, S. Saripalli, C. Sweeney, and P.P. Tans. 2011. Assessment of fossil fuel carbon dioxide and other anthropogenic trace gas emissions from airborne measurements over Sacramento, California in spring 2009. Atmospheric Chemistry and Physics 11:705–721. https://doi.org/10.5194/acp-11-705-2011
Yang, M.M., J.D. Barrick, C. Sweeney, J.P. Digangi, and J.R. Bennett. 2018. ACT-America: L1 Meteorological and Aircraft Navigational Data. ORNL DAAC, Oak Ridge, Tennessee, USA. https://doi.org/10.3334/ORNLDAAC/1574
Dataset Revisions
| Version | Release Date | Description of Changes |
|---|---|---|
| 1.2 | 2021-02-02 | Updated earlier campaign data and added Summer 2019 campaign data. |
| 1.1 | 2019-03-27 | Updated earlier campaign data and added Fall 2017 and Spring 2018 campaign data. |
| 1.0 | 2018-06-26 | Initial data added for Summer 2016 and Winter 2017 campaigns. |