Documentation Revision Date: 2018-12-31
Data Set Version: 1
Summary
This dataset includes three data files in *.csv format and one companion file.
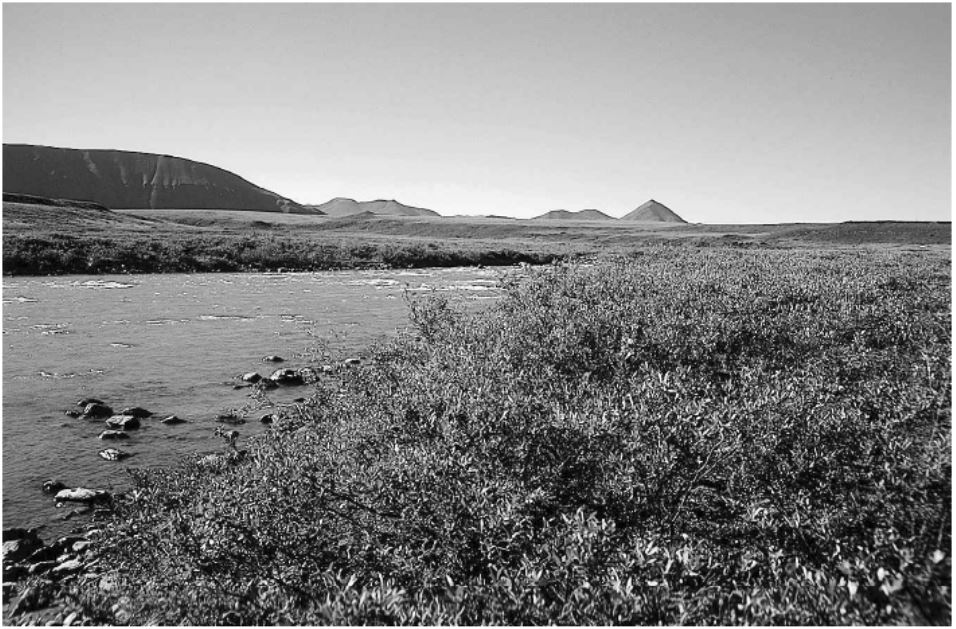
Figure 1: The low willow community Anemono-Salicetum richarsonii (subass. lupinetosum arctici) is widely distributed on upper terraces along the Sagavanirktok River (Schickhoff et al., 2002).
Citation
Schickhoff, U. 2018. Arctic Vegetation Plots in Willow Communities, North Slope, Alaska, 1997. ORNL DAAC, Oak Ridge, Tennessee, USA. https://doi.org/10.3334/ORNLDAAC/1368
Table of Contents
- Data Set Overview
- Data Characteristics
- Application and Derivation
- Quality Assessment
- Data Acquisition, Materials, and Methods
- Data Access
- References
Data Set Overview
This dataset provides environmental, soil, and vegetation data collected in July and August 1997 from 85 study plots in willow shrub communities located along a north-south transect from the Brooks Range to Prudhoe Bay on the North Slope of Alaska. Data includes the baseline plot information for vegetation, soils, and site factors for the study plots subjectively located in three broad habitat types across the glaciated landscape. Specific attributes include: dominant vegetation species, cover, indices, and biomass pools; soil chemistry, physical characteristics, moisture, and organic matter. This product brings together for easy reference all the available information collected from the plots that has been used for the classification, mapping, and analysis of geobotanical factors in the region and across Alaska.
The Pre-ABoVE vegetation plot datasets were curated to create the Alaska Arctic Vegetation Archive (AVA-AK; Walker et al. 2016b, Walker 2013). The AVA-AK is a regional database that is part of the larger Arctic Vegetation Archive (Walker 2016a, Walker et al. 2013, Walker and Raynolds 2011). The database contains vegetation plots from homogeneous plant communities with tables of cover or cover-abundance scores for all species and accompanying environmental site data. Field data were collected using Braun-Blanquet, US National Vegetation Classification protocols, or comparable methods.
Project: Arctic-Boreal Vulnerability Experiment (ABoVE)
The Arctic-Boreal Vulnerability Experiment (ABoVE) iis a NASA Terrestrial Ecology Program field campaign that will take place in Alaska and western Canada between 2016 and 2021. Climate change in the Arctic and Boreal region is unfolding faster than anywhere else on Earth. ABoVE seeks a better understanding of the vulnerability and resilience of ecosystems and society to this changing environment.
Acknowledgements:
These data files were edited by Donald A. Walker, Amy L. Breen and Lisa A. Druckenmiller at the University of Alaska Fairbanks' Alaska Geobotany Center and obtained via the Arctic Geoecological Atlas (http://arcticatlas.geobotany.org/), which provides access to existing Arctic vegetation plot and map data in support of the ABoVE campaign.
Data Characteristics
Spatial Coverage: North-south transect from Brooks Range to Prudhoe Bay, Alaska
ABoVE Grid Location: Ah1v0Bh2v2, Ah1v0Bh2v3
Spatial Resolution: Point samples
Temporal Coverage: 19970709 - 19970817
Temporal Resolution: Each plot was sampled once
Study Area: (All latitude and longitude given in decimal degrees)
|
Site |
Westernmost Longitude |
Easternmost Longitude |
Northernmost Latitude |
Southernmost Latitude |
|
Willow Vegetation Plots, Alaska |
-149.851 |
-148.084 |
70.187 |
68.033 |
Data File Information: There are three data files with this dataset in comma-separated (.csv) format.
Table 1. Data files
| Data File Name | Description |
| Willow_Soil_Data.csv | Soil characterization data for the willow transect plots |
| Willow_Species_Data.csv | Species cover data for the willow transect plots |
| Willow_Environmental_Data.csv | Comprehensive set of environmental characterization data for the willow shrub transect plots including the descriptive site factors. Most measurement data have been processed to provide values at a common 10 cm depth. This measurement comparability facilitates analysis of geobotanical relationships across Alaska. |
Data Descriptions: The column names, their units, and descriptions for each of the *.csv data files are listed below.
Table 2. Willow_Soil_Data.csv
| Column Name | Units | Description |
| PUBLICATION_RELEVE_NUMBER | Plot number from Schickhoff et al. 2002 | |
| FIELD_RELEVE_NUMBER | Plot number | |
| SOIL_WATER_CONTENT | G | Water content in the soil sample |
| BULK_DENSITY | G/CM3 | Bulk density of the soil sample |
| PH_PASTE | pH of the soil sample | |
| ELECTRICAL_CONDUCTIVITY | UMHOS/CM | Electrical conductivity of the soil sample |
| SOIL_ORGANIC_MATTER | % | Percentage of soil organic matter |
| NO3-N | PPM | Extractable NO3-N in the soil sample |
| P | PPM | Extractable P in the soil sample |
| K | PPM | Extractable K in the soil sample |
| ZN | PPM | Extractable Zn in the soil sample |
| FE | PPM | Extractable Fe in the soil sample |
| MN | PPM | Extractable Mn in the soil sample |
| CU | PPM | Extractable Cu in the soil sample |
| ROOT_PENETRATION_INDEX | Scalar value representing degree of root penetration (strong, medium, weak) | |
| SOIL_COLOR_AT_10_CM | Color of soil sample at 10 cm depth | |
| GRAVEL_AT_10_CM | G/100CM3 | Gravel content of soil sample at 10 cm depth |
| SAND_AT_10_CM | % | Percentage sand content of the soil sample |
| SILT_AT_10_CM | % | Percentage silt content of the soil sample |
| CLAY_AT_10_CM | % | Percentage clay content of the soil sample |
| SITE_MOISTURE | Site moisture (MST:moist or WET:wet) | |
| SOIL_TEXTURE | Soil texture (LOM:loam, SND:sand, CLY:clay, or SLT:silt) |
Table 3. Willow_Environmental_Data.csv
Note: Coded and scalar variables are followed by a description column (e.g. SNOW_COVER and SNOW_COVER_DESC).
| Column Name | Units | Description |
| PUBLICATION_RELEVE_NUMBER | Plot number from Schickhoff et al. 2002 | |
| PLANT_COMMUNITY_NAME | Primary vegetation types | |
| RELEVE_SIZE | m2 | Plot size |
| ELEVATION | m | Plot elevation |
| SHRUB_COVER | % | Percent shrub cover in the plot |
| HERB_COVER_GRASSES_AND_FORBS | % | Percent herb, grasses, forbs cover in the plot |
| MOSS_AND_LICHEN_COVER | % | Percent moss and lichen cover in the plot |
| CHARACTER_SPECIES | Plot dominant species | |
| PLANT_COMMUNITY_DESCRIPTION | Plot plant community description | |
| FIELD_RELEVE_NUMBER | Plot number from field survey (in Figure 2) | |
| AUTHORS_DESCRIPTION_OF_RELEVE_LOCATIONS | Author's plot descriptions | |
| MOSS_LAYER_HEIGHT | cm | Height of moss layer in the plot |
| SNOW_COVER | Snow cover code | |
| SNOW_COVER_DESC | Description of snow cover code | |
| DISTANCE_TO_WATER_TABLE | m | Distance to water table |
| FLOOD_FREQUENCY | Flood frequency | |
| SOIL_WATER_CONTENT | g | Water content of soil sample |
| BULK_DENSITY | g/cm3 | Bulk density of soil sample |
| PH_PASTE | pH of soil sample | |
| ELECTRICAL_CONDUCTIVITY | umho/cm | Electrical conductivity |
| SOIL_ORGANIC_MATTER | % | Percent organic matter of soil sample |
| NO3-N | ppm | NO3-N in soil |
| P | ppm | Phosphorous in soil sample |
| K | ppm | Potassium in soil sample |
| ZN | ppm | Zinc in soil sample |
| FE | ppm | Iron in soil sample |
| MN | ppm | Manganese in soil sample |
| CU | ppm | Copper in soil sample |
| ROOT_PENETRATION_INDEX | Root penetration code | |
| ROOT_PENETRATION_INDEX_DESC | Root penetration code description | |
| SOIL_COLOR | Color of soil sample | |
| GRAVEL_AT_10_CM | g/100cm3 | Gravel content of soil sample |
| SAND_AT_10_CM | % | Percent of sand in soil sample |
| SILT_AT_10_CM | % | Percent of silt in soil sample |
| CLAY_AT_10_CM | % | Percent of clay in soil sample |
| SITE_MOISTURE | Site moisture of the plots | |
| SOIL_TEXTURE | Soil texture of the plots | |
| TOTAL_VEGETATION_COVER | % | Percent vegetation cover of the plots |
| ESTIMATED_LATITUDE | decimal degrees | Latitude of the center of the plots |
| ESTIMATED_LONGITUDE | decimal degrees | Longitude of the center of the plots |
Table 4. Willow_Species_Data.csv
| Column Numbers | Column Name | Units | Description |
| 1 | PASL_TAXON_SCIENTIFIC_NAME_NO_AUTHORS | Current Taxonomy according to the Panarctic Species List (PASL) | |
| 2 | PASL_TAXON_SCIENTIFIC_NAME_WITH_AUTHORS | Current Taxonomy according to the Panarctic Species List (PASL) including author's names | |
| 3 | DATASET_TAXON | Dataset taxonomy | |
| 4 to 84 | 10428 to 10512 | Column headings are all 85 plot numbers. The data values are Species Cover Classes (Braun-Blanquet cover-abundance scale): where r (rare), + (common, but less than 1 percent cover), 1 (1-5 percent), 2 (6 to 25 percent), 3 (25 to 50 percent), 4 (51 to 75 percent), 5 (76 to 100 percent). |
Companion Files: There is one companion file with this dataset in .pdf format.
Table 5. Companion file
| Companion File Name | Description |
| Willow_Veg_Plot_photos.pdf | This file contains landscape photos of willow vegetation from Shickhoff et al., 2002. |
Application and Derivation
These data bring together for easy reference all of the available information collected from the plots that has been used for the classification, mapping, and analysis of the geo-botanical factors from plots on the willow transect along the Dalton Highway in northern Alaska. Derived regional maps of these data will be used in regional models of fluxes of trace gases, water, and energy from tundra surfaces. In addition, a circumpolar vegetation classification resulting from these datasets would be highly desirable to extend the results to the entire arctic region.
Quality Assessment
No specific quality assessment information provided.
Data Acquisition, Materials, and Methods
The eighty-five study plots are located along a N-S transect from the southern slope of the Brooks Range to the Arctic coast in the vicinity of Prudhoe Bay/Deadhorse. The transect follows the northern segment of the Dalton Highway. Plot locations are depicted in Figure 2. The major portion of the transect lies within the drainage system of the Sagavanirktok River on the North Slope of Alaska. The plots were subjectively located in three broad habitat types including: tall willow shrub communities on floodplains, gravel bars, and lower terraces as well as on upland montane stream banks (27 plots); open low willow shrub communities on the banks of upland tundra streams as well as upper terraces from about 950 m in elevation down to the coastal plain (35 plots); and low willow shrub communities restricted to the most humid and acidic banks of upland tundra streams in the Arctic foothills, roughly between 400 and 800 m in elevation (23 plots).
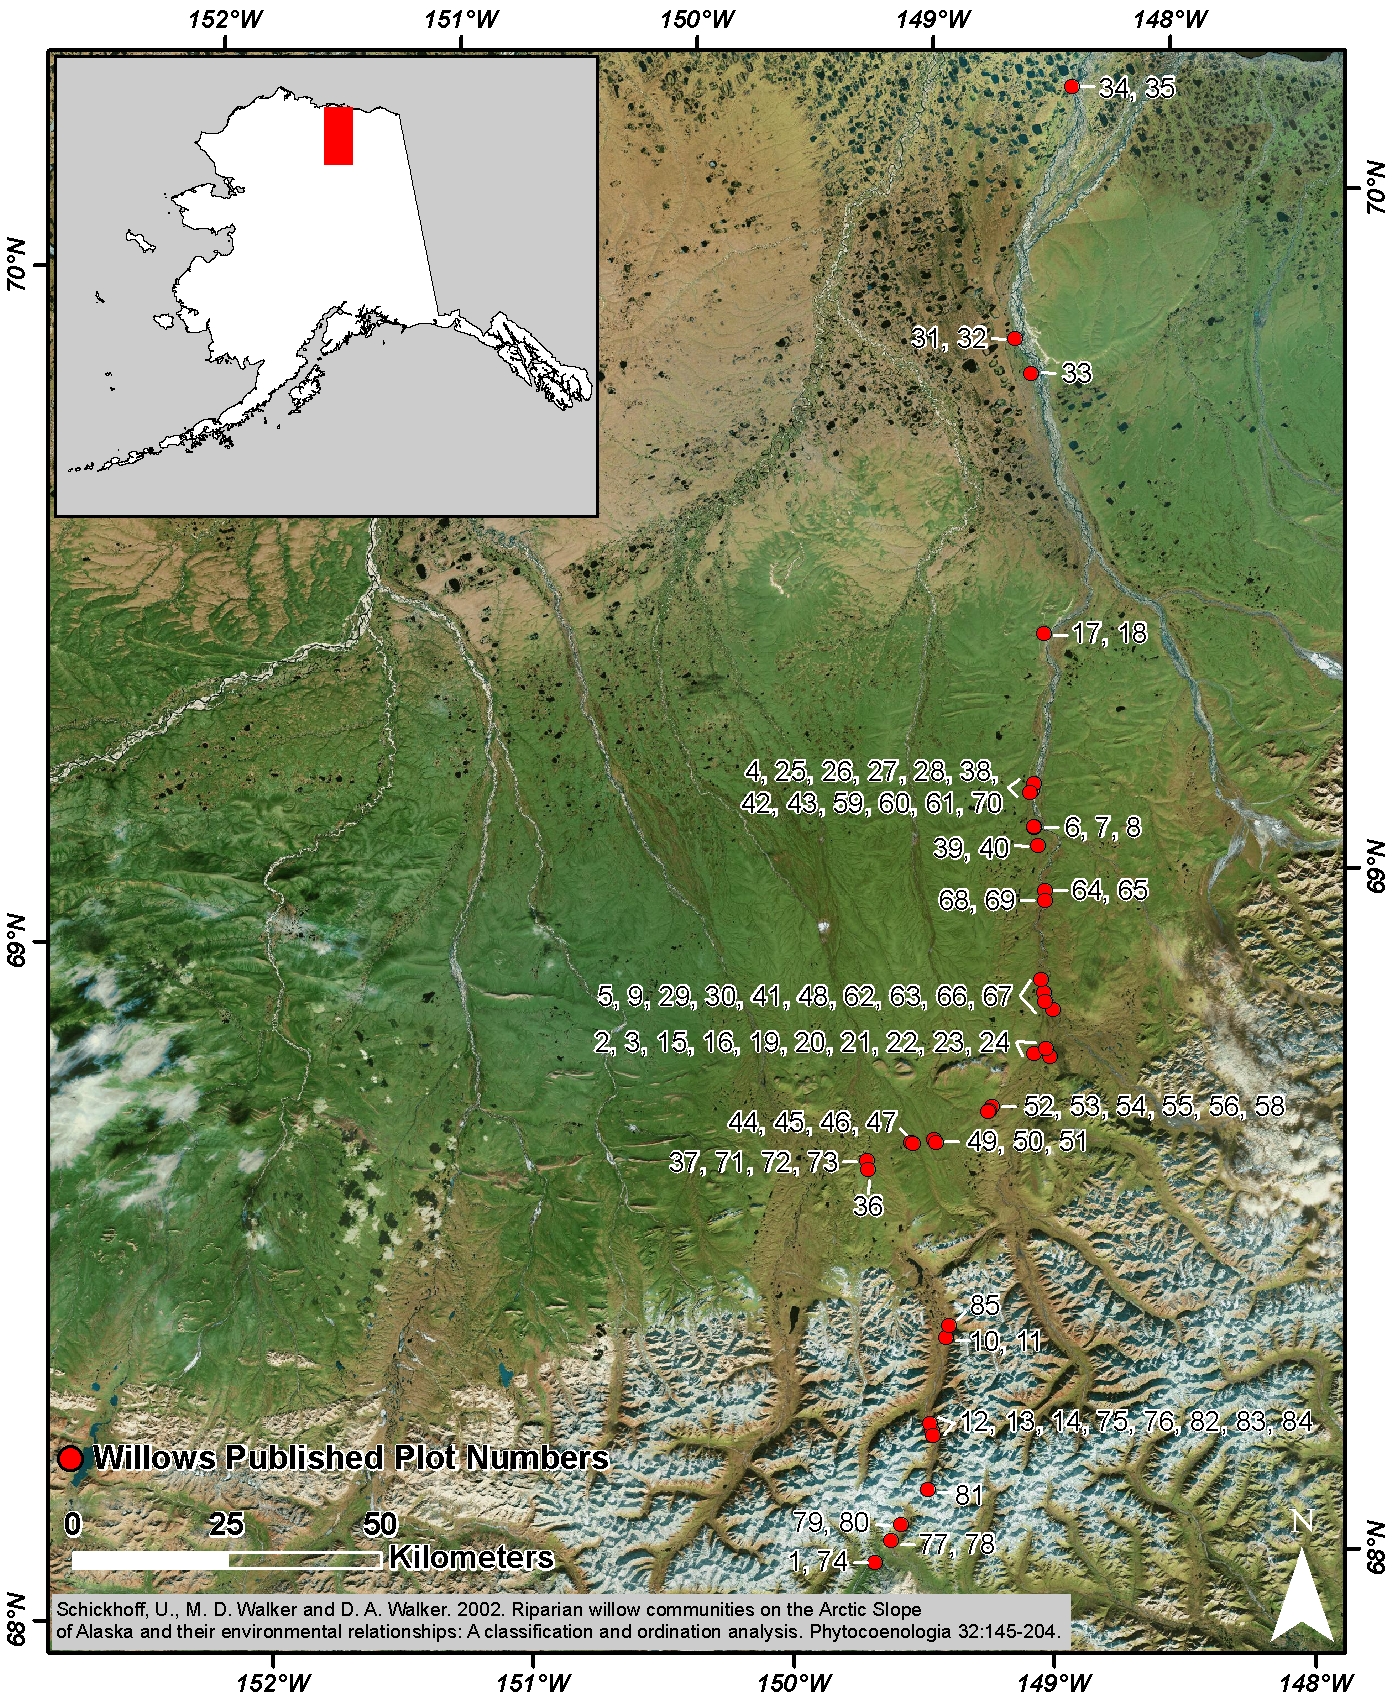
Figure 2. Location of the willow transect plots in northern Alaska
Vegetation Plot Sampling
The study sites were selected along rivers and streams of different orders in order to cover the full variety of riparian shrubland habitats between the Brooks Range and the coastal plain. The plots were sampled according to the Braun-Blanquet approach. Phytosociological and environmental data collection was conducted between July 9 and August 17 1997. Sample plots were of square or rectangular shape. Representative samples of the Salix-communities required minimal areas between 50 m2 (low shrublands) and 100 m2 (tall shrublands). Shrub, field, moss and lichen coverage were measured or estimated for each of the sample plots. Species cover was estimated according to the traditional Braun-Blanquet cover-abundance scale.
Estimates of a number of habitat factors, such as frequency of flooding, soil moisture, site moisture, snow cover, percent cryoturbation, and animal disturbance were recorded. Additionally, the vertical distance to the water table was measured, and information on the locality, on the entire size of the sample stand, on microtopography and geomorphic processes, and on the surrounding vegetation types was noted.
A soil pit was dug on each sample plot. Soil profiles were described according to Schlichting et al. (1995) with regard to active layer depth, thickness and type of horizons, color, texture, humus contents, moisture conditions, and root patterns. Soil samples were collected from 10 cm depth in each soil pit. Fresh field samples were oven-dried at 105 °C for 72 hours in camp to determine percentage weight loss and soil moisture. Laboratory soil analyses (Soil, Water and Plant Testing Laboratory, Colorado State University) comprised soil pH (saturated paste method), electrical conductivity, percent organic matter, NO3-N, plant available P, K, Zn, Fe, Mn, Cu, and percent gravel, sand, silt, and clay.
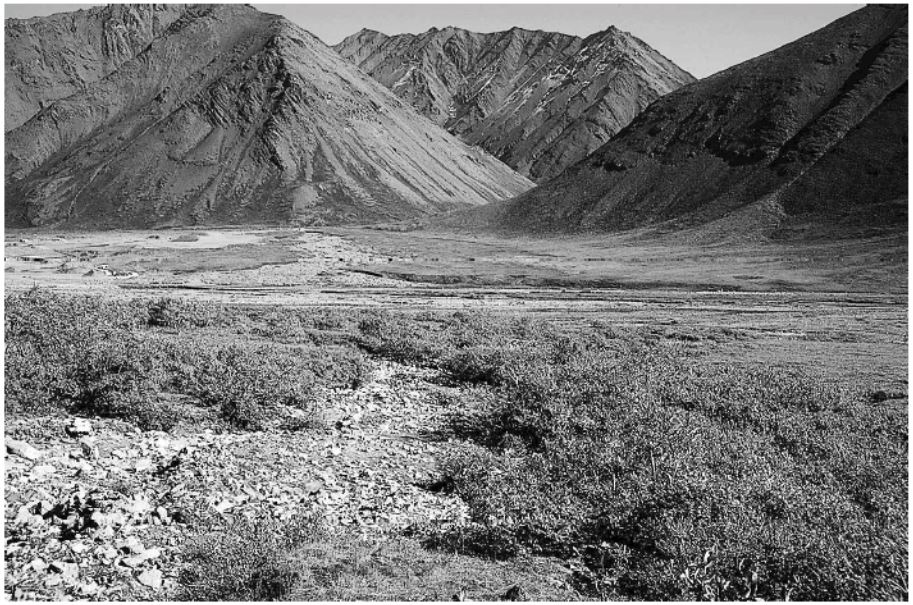
Figure 3. Salix alaxensis-communities are not restricted to lowland river banks. As true pioneer communities they occupy gravelly montane stream banks in the Brooks Range, which might show only periodical streamflow (subass. polemonietosum acutiflori). Stand productivity and vigor of Salix alaxensis is reduced (Schickhoff et al., 2002).
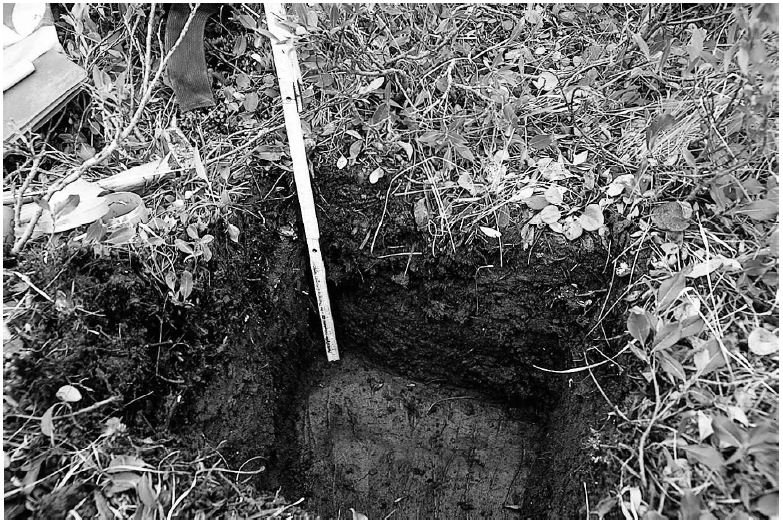
Figure 4. Sites of Salix pulchra-stands are characterized by a very shallow active layer. Thick moss layers provide perfect insulation of the subsoil (Schickhoff et al., 2002).
Data Access
These data are available through the Oak Ridge National Laboratory (ORNL) Distributed Active Archive Center (DAAC).
Arctic Vegetation Plots in Willow Communities, North Slope, Alaska, 1997
Contact for Data Center Access Information:
- E-mail: uso@daac.ornl.gov
- Telephone: +1 (865) 241-3952
References
Schickhoff, U., M.D. Walker, and D.A. Walker. 2002. Riparian willow communities on the Arctic Slope of Alaska and their environmental relationships: A classification and ordination analysis. Phytocoenologia 32: 145-204.
Schlichting, E., H.P. Blume, and K. Stahr. 1995. Bodenkundliches Praktikum. - 2. Aufl., Blackwell, Berlin - Wien.
Walker, D. A., F. J. A. Daniëls, I. Alsos, U. S. Bhatt, A. L. Breen, M. Buchhorn, H. Bültmann, L. A. Druckenmiller, M. E. Edwards, D. Ehrich, H. E. Epstein, W. A. Gould, R. A. Ims, M. H, M. K. Raynolds, J. Sibik, and S. S. Talbot. 2016a. Arctic vegetation: A hierarchic review of productivity, biodiversity patterns and an Arctic vegetation archive. Environmental Research Letters. doi:10.1088/1748-9326/11/5/055005
Walker, D. A.; A. L. Breen; L. A. Druckenmiller; L. W. Wirth; W. Fisher; M. K. Raynolds; J. Šibík; M. D. Walker; S. Hennekens; K. Boggs; T. Boucher; M. Buchhorn; H. Bültmann; D. J. Cooper; F. J.A Daniëls; S. J. Davidson; J. J. Ebersole; S. C. Elmendorf; H. E. Epstein; W. A. Gould; R. D. Hollister; C. M. Iversen; M.T. Jorgenson; A. Kade; M. T. Lee; W. H. MacKenzie; R. K. Peet; J. L. Peirce; U. Schickhoff; V. L. Sloan; S. S. Talbot; C. E. Tweedie; S. Villarreal; P. J. Webber; D. Zona. The Alaska Arctic Vegetation Archive. 2016b. Phytocoenologia doi: http://dx.doi.org/10.1127/phyto/2016/0128
Walker, D.A. (Ed). Alaska Arctic Vegetation Archive Workshop, Boulder, Colorado, October 14-16, 2013. CAFF Proceedings Report #11. Akureyri, Iceland. ISBN: 978-9935-431-29-5.
Walker, D. A., A. L. Breen, M. K. Raynolds, and M. D. Walker, editors. 2013. Arctic Vegetation Archive Workshop, Krakow, Poland April 14-16, 2013. CAFF Proceedings Report #10. Akureyri, Iceland. ISBN: 978-9935-431-24-0.
Walker, D. A., and M. K. Raynolds. 2011. An International Arctic Vegetation Database: A foundation for panarctic biodiversity studies. CAFF Strategy Series Report nr. 5. Conservation of Arctic Flora and Fauna (CAFF), Akureyri, Iceland.