Documentation Revision Date: 2018-12-31
Data Set Version: 1
Summary
There are two data files in comma-separated format (.csv) with this data set. There are also three companion files which provide plot photos and define data value codes and scalars.
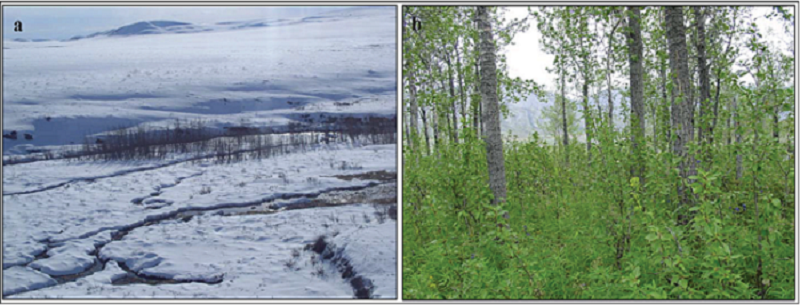
Figure 1. Photos of balsam poplar study area Ivishak Hot Springs in Arctic Alaska (Plot 18). Note the open water in the winter months that is indicative of a perennial spring (Breen, 2014).
Citation
Breen, A.L. 2018. Arctic Vegetation Plots, Poplars, Arctic and Interior AK and YT, Canada, 2003-2005. ORNL DAAC, Oak Ridge, Tennessee, USA. https://doi.org/10.3334/ORNLDAAC/1376
Table of Contents
- Data Set Overview
- Data Characteristics
- Application and Derivation
- Quality Assessment
- Data Acquisition, Materials, and Methods
- Data Access
- References
Data Set Overview
This data set provides vegetation cover and environmental plot data collected from 32 balsam poplar (Populus balsamifera L., Salicaceae) vegetation plots located on the the Arctic Slope of Alaska and in the interior boreal forests of Alaska and the Yukon from 2003 to 2005. The Arctic study area is bounded by the Noatak River to the west and the Kongakut River to the east. Vegetation species and percent cover classes are provided. Plot data includes moisture, topographic position, slope, aspect, shape, and soil data.
The data are provided according to the original source and also according to the listings provided in the TURBOVEG data base, a software program for managing vegetation-plot data (see http://www.synbiosys.alterra.nl/turboveg/).
The Pre-ABoVE vegetation plot datasets were curated to create the Alaska Arctic Vegetation Archive (AVA-AK; Walker et al. 2016b, Walker 2013). The AVA-AK is a regional database that is part of the larger Arctic Vegetation Archive (Walker 2016a, Walker et al. 2013, Walker and Raynolds 2011). The database contains vegetation plots from homogeneous plant communities with tables of cover or cover-abundance scores for all species and accompanying environmental site data. Field data were collected using Braun-Blanquet, US National Vegetation Classification protocols, or comparable methods.
Project: Arctic-Boreal Vulnerability Experiment (ABoVE)
The Arctic-Boreal Vulnerability Experiment (ABoVE) iis a NASA Terrestrial Ecology Program field campaign that will take place in Alaska and western Canada between 2016 and 2021. Climate change in the Arctic and Boreal region is unfolding faster than anywhere else on Earth. ABoVE seeks a better understanding of the vulnerability and resilience of ecosystems and society to this changing environment.
Acknowledgements:
This research was supported by a National Science Foundation Doctoral Dissertation Improvement grant (DEB-0608539) and by a Center for Global Change and Arctic System Research (University of Alaska Fairbanks) student award to Breen and by the National Science Foundation grant OPP-9996383 to Marilyn Walker.
These data files were edited by Donald A. Walker, Amy L. Breen and Lisa A. Druckenmiller at the University of Alaska Fairbanks' Alaska Geobotany Center and obtained via the Arctic Geoecological Atlas (http://arcticatlas.geobotany.org/), which provides access to existing Arctic vegetation plot and map data in support of the ABoVE campaign.
Data Characteristics
Spatial Coverage: Arctic Foothills and the interior boreal forests of Alaska and Yukon
Domain: Core ABoVE region
ABoVE grid location: Ahh0Avv0, Ahh1Avv0, Ahh1Avv1
Spatial Resolution: Point resolution. Each plot was a minimum of 100 m2
Temporal Coverage: 2003-01-01 to 2006-12-31
Temporal Resolution: Each plot was sampled once.
Study Area (All latitude and longitude given in decimal degrees)
| Site | Westernmost Longitude | Easternmost Longitude | Northernmost Latitude | Southernmost Latitude |
|---|---|---|---|---|
| Arctic Foothills and the interior boreal forests of Alaska and Yukon | -162.741 | -135.222 | 69.4718 | 61.07605 |
Data File Information
There are two data files with this data set in comma-separated (.csv) format. These data may also be found in the TURBOVEG database. There are also three companion files which provide plot photos and define data value codes and scalars.
Missing data are represented as -9999.
Table 1. Data files and descriptions.
| Data File Name | Description |
|---|---|
| Poplar_Veg_Plots_Environmental.csv | Plot data including soil code, moisture, slope, aspect, and topography data. Also includes percent groundcover |
| Poplar_Veg_Plots_Species.csv |
This file contains species cover data for the poplar vegetation plots. The source of these data is the Phytocoenologia publication (Breen 2014). Both the author's determination and the current taxonomy according to the Panarctic Species List (PASL) are listed. Taxa are listed in alphabetical order according to the accepted PASL name. The estimated percent land cover by species per plot are the old Braun-Blanquet cover-abundance scale where: 0= (none present) The plots are named according to the original stand numbers |
Table 2. Variables in the file Poplar_Veg_Plots_Environmental.csv
| Column number | Variable | Units/format | Description |
|---|---|---|---|
| 1 | FIELD_PLOT_NUM | text | The plot numbers in the modified source data are the author’s. The main plot numbers in the Turboveg database are accession numbers and will differ. The author’s plot numbers are retained in the ‘Field releve number’ field in the Turboveg database |
| 2 | DATE | YYYYMMDD | Survey date |
| 3 | BIOME | text | Arctic or Boreal |
| 4 | HABITAT | text | Description of the habitat at the plot |
| 5 | LOCALITY | text | Description of study plot location |
| 6 | LATITUDE | decimal degrees | Latitude of the study plot in decimal degrees. All coordinates were projected to the WGS84 datum |
| 7 | LONGITUDE | decimal degrees | Longitude of the study plot in decimal degrees. All coordinates were projected to the WGS84 datum |
| 8 | ELEVATION | m | Elevation of plot area in meters |
| 9 | SLOPE | degrees | Slope of plot area in degrees |
| 10 | ASPECT | degrees | Aspect of plot area in degrees |
| 11 | STAND_AREA | m2 | Stand area in meters squared |
| 12 | LANDFORM | code | Refer to the code defined in the companion file Poplar_Veg_Plots_legend.pdf |
| 13 | SURFICIAL_GEOLOGY | code | Refer to the code defined in the companion file Poplar_Veg_Plots_legend.pdf |
| 4 | POPLAR_REPRODUCTION | code | Refer to the code defined in the companion file Poplar_Veg_Plots_legend.pdf |
| 15 | TOPOGRAPHIC_POSITION | code | Refer to the code defined in the companion file Poplar_Veg_Plots_legend.pdf |
| 16 | SNOW_DURATION | scalar | Refer to the code for scalars defined in the companion file Poplar_Veg_Plots_legend.pdf |
| 17 | SITE_CONTOUR | code | Refer to the code defined in the companion file Poplar_Veg_Plots_legend.pdf |
| 18 | STABILITY | scalar | Refer to the code for scalars defined in the companion file Poplar_Veg_Plots_legend.pdf |
| 19 | EXPOSURE | scalar | Refer to the code for scalars defined in the companion file Poplar_Veg_Plots_legend.pdf |
| 20 | SITE_MOISTURE | scalar | Refer to the code for scalars defined in the companion file Poplar_Veg_Plots_legend.pdf |
| 21 | SOIL_MOISTURE | scalar | Refer to the code for scalars defined in the companion file Poplar_Veg_Plots_legend.pdf |
| 22 | DISTURBANCE_TYPE | scalar | Refer to the code for scalars defined in the companion file Poplar_Veg_Plots_legend.pdf |
| 23 | DISTURBANCE_DEGREE | scalar | Refer to the code for scalars defined in the companion file Poplar_Veg_Plots_legend.pdf |
| 24 | TREE_CANOPY_HEIGHT | m | Tree canopy height in meters |
| 25 | SHRUB_HEIGHT | cm | Shrub height in centimeters |
| 26 | FORB_GRAMINOID_HEIGHT | cm | Height in centimeters |
| 27 | MOSS_ORGANIC_A_HORIZON_HEIGHT | cm | Height in centimeters |
| 28 | STAND_BASAL_AREA | m2/ha | Stand basal area reported in meters squared per ha |
| 29 | STAND_DENSITY | trees/ha | Stand density reported as the # of trees per hectare |
| 30 | LITTER_DEPTH | cm | Litter depth provided in centimeters |
| 31 | ORGANIC_HORIZON_PRESENT | text | Organic horizon |
| 32 | BURIED_ORGANIC_HORIZONS | text | Buried organic horizon |
| 33 | TREE_COVER | % | Percent of plot cover that is trees |
| 34 | TREE_SAPLINGS_COVER | % | Percent of plot cover that is tree saplings |
| 35 | DECIDUOUS_SHRUBS_COVER | % | Percent of plot cover that is deciduous shrub |
| 36 | EVERGREEN_SHRUBS_COVER | % | Percent of plot cover that is evergreen shrubs |
| 37 | SHRUBS_COVER | % | Percent of plot cover that is shrubs |
| 38 | FORBS_COVER | % | Percent of plot cover that is forbs |
| 39 | GRAMINOIDS_COVER | % | Percent of plot cover that is graminoids |
| 40 | HORSETAILS_COVER | % | Percent of plot cover that is horsetails |
| 41 | BRYOPHYTES_COVER | % | Percent of plot cover that is bryophytes |
| 42 | LICHEN_COVER | % | Percent of plot cover that is lichen |
| 43 | LITTER_COVER | % | Percent of plot cover that is litter |
| 44 | STANDING_DEAD_COVER | % | Percent of plot cover that is standing dead vegetation |
| 45 | BARE_ROCK_COVER | % | Percent of plot cover that is bare rock |
| 46 | BARE_SOIL_COVER | % | Percent of plot cover that is bare soil |
| 47 | OPEN_WATER_COVER | % | Percent of plot cover that is open water |
| 48 | TOTAL_DEAD_COVER | % | Percent of plot cover that is dead |
| 49 | TOTAL_VEGETATION_COVER | % | Percent of plot cover that is total vegetation |
Table 3. Variables in the file Poplar_Veg_Plots_Species.csv
| Column number | Column header | Description |
|---|---|---|
| 1 | PASL_TAXON_SCIENTIFIC_ NAME | Current nomenclature according to the Panarctic Species List (PASL) |
| 2 | PASL_TAXON_SCIENTIFIC_ NAME_AU | Current nomenclature according to the Panarctic Species List (PASL) with the data authors (AU) name |
| 3 | DATASET_TAXON | Data set taxonomy |
| 4-37 | DATASET_PLOT_ NUM |
Plot names- 33 column headers. The plot numbers as named by the author. Column headers= 3 letter abbreviation followed by a #. For example, "NOA3". The data values are the estimated percent land cover by species per plot according to the older Braun-Blanquet cover-abundance scale where: 0= (none present) Example data are provided in Table 4 below |
Example data from the file Poplar_Veg_Plots_Species.csv:
| PASL_TAXON_SCIENTIFIC_NAME | PASL_TAXON_SCIENTIFIC_ NAME_AU | DATASET TAXON | NOA3 | KON1 | IVI4 |
| Abietinella abietina | Abietinella abietina (Hedw.) Fleisch. | Abietinella abietina | 0 | 0 | 0 |
| Achillea millefolium s. borealis | Achillea millefolium s. borealis (Bong.) Breitung | Achillea millefolium ssp. borealis | 0 | 0 | 0 |
| Aconitum delphinifolium [s. delphinifolium] | Aconitum delphinifolium [s. delphinifolium] DC. | Aconitum delphinifolium var. delphinifolium | 0 | 0 | 1 |
Companion files
There are three companion files with this data set:
| Poplar_Veg_Plots_Legend.pdf | Defines the code and scalars found in the file Poplar_Veg_Plots_Environmental.csv |
| Poplar_Veg_Plots_Photos | Provides photos of the study area |
| Poplar_Veg_Plots.pdf | This document in pdf format |
Application and Derivation
The presence of balsam poplar in northern Alaska is strongly linked to climate. These data could be useful in climate change studies. An alteration of temperature regime caused by climate change will likely result in an increase in the abundance and distribution of balsam poplar on the arctic slope of Alaska (Breen, 2014).
Quality Assessment
Voucher specimens were collected for identification purposes, and a representative specimen for each taxon was deposited in the Herbarium of the University of Alaska Museum of the North.
Data Acquisition, Materials, and Methods
Site Description
Vegetation cover and environmental plot data were collected from 2003 to 2005 from 32 balsam poplar (Populus balsamifera L., Salicaceae) vegetation plots located on the the Arctic Slope of Alaska and in the interior boreal forests of Alaska and the Yukon from 2003 to 2005. The Arctic study area is bounded by the Noatak River to the west and the Kongakut River to the east. The boreal forest study area is bounded to the east by the Kobuk River and to the west by the headwaters of the Yukon River (Breen, 2014).
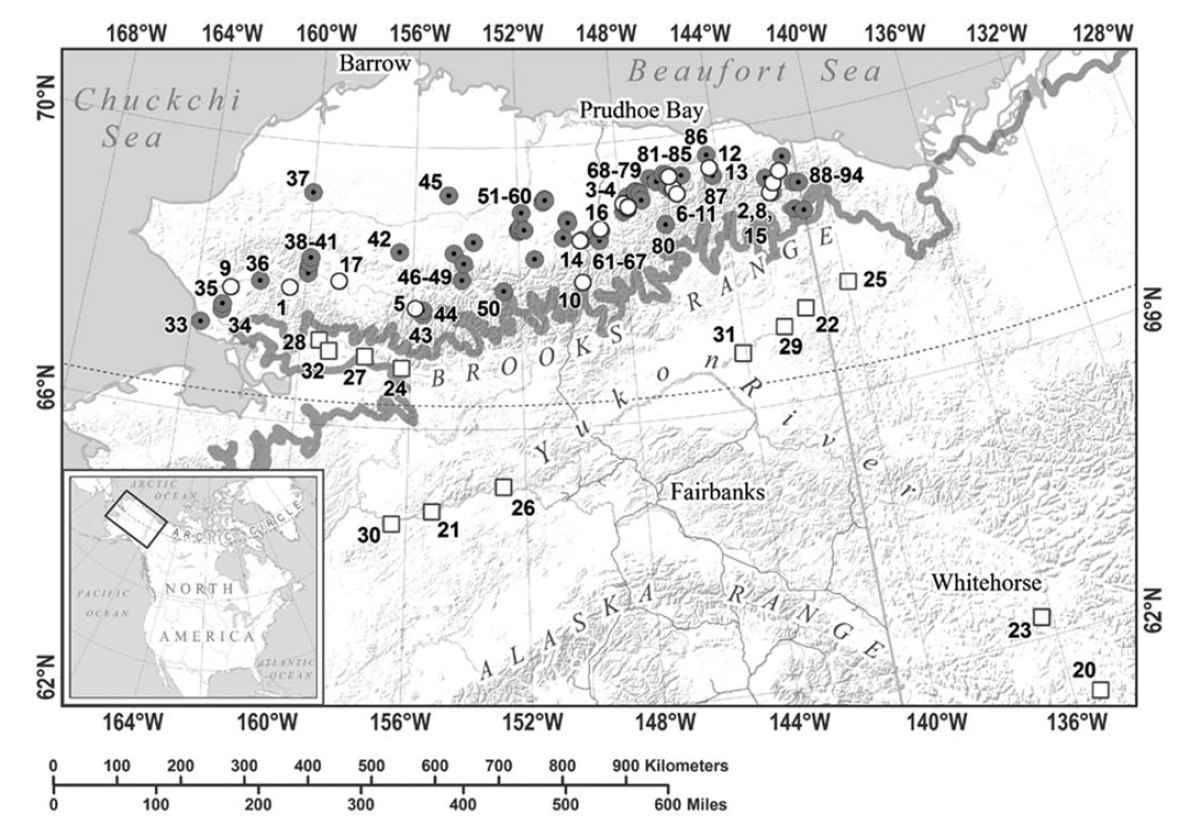
Figure 2. Location of study sites in Alaska and Yukon (1-32, open symbols) and known balsam poplar occurrences on the Arctic Slope in Alaska (33-94, gray circles). The study sites in the Arctic are denoted with circles and those in the boreal forests are denoted with squares. The gray line depicts the arctic treeline (CAVM Team 2003). The plots are numbered as in Breen (2014).
Methods
The study plots were chosen subjectively in areas of homogeneous, representative vegetation and geo-referenced. The minimum sampling area was approximately 100 m2. The vegetation data were analyzed using the Braun-Blanquet approach, and the plant community types were published in Breen (2014). The differentiation of vegetation types was based on diagnostic species. The criteria proposed by Dierschke (1994) was followed to assess the degree of fidelity of character species and to determine differential species
The point centre quarter method was used to estimate stand density (trees/ha), basal area and canopy height (Mueller-Dombois and Ellenberg 1974).
Elevation, slope, aspect, stability, exposure, parent material and geomorphology were noted at each site. Site and soil moisture and snow duration were categorized on scales of 1 to 10 (Breen, 2014; Komárková 1983).
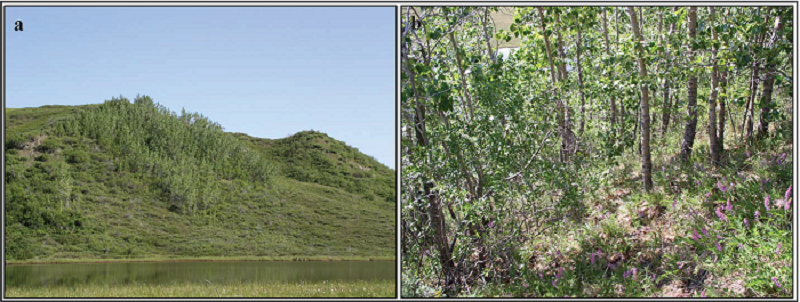
Figure 3. Vegetation plot photos on a south-facing slope adjacent to the Noatak River (Plot 17) in Arctic Alaska (Breen, 2014).
Data Access
These data are available through the Oak Ridge National Laboratory (ORNL) Distributed Active Archive Center (DAAC).
Arctic Vegetation Plots, Poplars, Arctic and Interior AK and YT, Canada, 2003-2005
Contact for Data Center Access Information:
- E-mail: uso@daac.ornl.gov
- Telephone: +1 (865) 241-3952
References
Breen, A. L. 2014. Balsam poplar (Populus balsamifera L.) communities on the Arctic Slope of Alaska. Phytocoenologia 44:1–24.DOI: https://doi.org/10.1127/0340-269X/2014/0044-0522
CAVM Team (2003): Circumpolar Arctic Vegetation Map. (1:7,500,000 scale), Conservation of Arctic Flora and Fauna (CAFF) Map No. 1. U.S. Fish and Wildlife Service, Anchorage, Alaska. ISBN: 978-0-9767525-0-9.
Dierschke, H. (1994): Pflanzensoziologie. – Ulmer Verlag, Stuttgart. DOI: 10.1002/fedr.19951060122
Komárková, V. (1983): Environmental data for 235 plots in the Gunnison and Uncompahgre National Forests. Progress report #5. Rocky Mountain Forest and Range Experiment Station, Fort Collins, Colorado, U.S. A.
Mueller-Dombois, D. and Ellenberg, H. (1974): Aims and methods of vegetation ecology. – John Wiley & Sons, New York, USA. ISBN: 0-471-62290-7