Documentation Revision Date: 2018-12-31
Data Set Version: 1
Summary
The dataset includes four data files in *.csv format and four companion files in *.pdf format
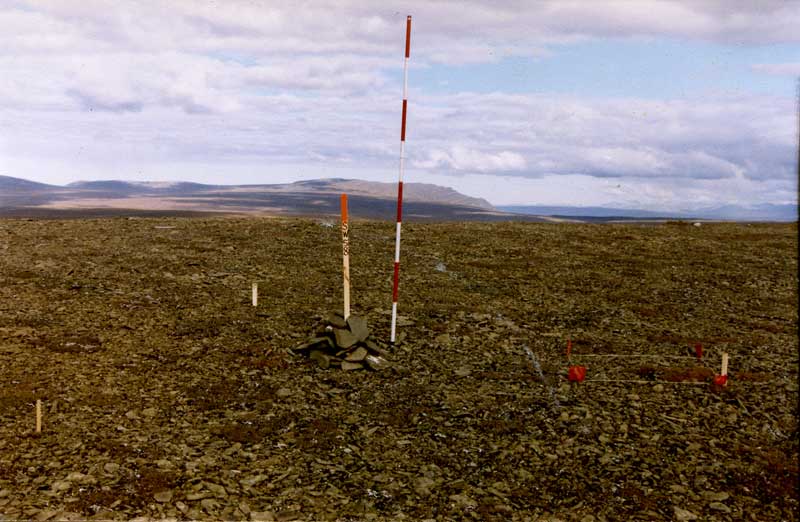
Figure 1: Imnavait Creek Permanent Vegetation Plot Layout at Plot SW-58.
Citation
Walker, D.A. 2018. Arctic Vegetation Plots at Imnavait Creek, Alaska, 1984-1985. ORNL DAAC, Oak Ridge, Tennessee, USA. https://doi.org/10.3334/ORNLDAAC/1356
Table of Contents
- Data Set Overview
- Data Characteristics
- Application and Derivation
- Quality Assessment
- Data Acquisition, Materials, and Methods
- Data Access
- References
Data Set Overview
This dataset is a summary of environmental, soil, and vegetation information collected from 84 study plots near Imnavait Creek, Alaska. Imnavait Creek is situated in a shallow basin at the foothills of the central Brooks Range and the Imnavait Creek vegetation area is located near the center of the Upper Kuparuk River region and encloses a 22-km2 area northeast of Toolik Lake, close to the southern foothills of northern Alaska. The Dalton Highway and the trans-Alaska pipeline both pass nearby. Imnavait Creek was chosen as a study site as it provides a good representation of the southern foothills of the Brooks Range, a glaciated region characterized by rolling tundra plains interspersed with hills, knobs and low ridges. Data includes the baseline plot information for vegetation, soils, and site factors for the study plots subjectively located in 14 plant communities that occur in 19 broad habitat types across the glaciated landscape. Specific attributes include: dominant vegetation species, cover, indices, and biomass pools; soil chemistry, physical characteristics, moisture, and organic matter. This product brings together for easy reference all the available information collected from the plots that has been used for the classification, mapping, and analysis of geo-botanical factors in the Imnavait Creek region and across Alaska.
The Pre-ABoVE vegetation plot datasets were curated to create the Alaska Arctic Vegetation Archive (AVA-AK; Walker et al. 2016b, Walker 2013). The AVA-AK is a regional database that is part of the larger Arctic Vegetation Archive (Walker 2016a, Walker et al. 2013, Walker and Raynolds 2011). The database contains vegetation plots from homogeneous plant communities with tables of cover or cover-abundance scores for all species and accompanying environmental site data. Field data were collected using Braun-Blanquet, US National Vegetation Classification protocols, or comparable methods.
Project: Arctic-Boreal Vulnerability Experiment (ABoVE)
The Arctic-Boreal Vulnerability Experiment (ABoVE) is a NASA Terrestrial Ecology Program field campaign that will take place in Alaska and western Canada between 2016 and 2021. Climate change in the Arctic and Boreal region is unfolding faster than anywhere else on Earth. ABoVE seeks a better understanding of the vulnerability and resilience of ecosystems and society to this changing environment.
Acknowledgements:
These data files were edited by Donald A. Walker, Amy L. Breen and Lisa A. Druckenmiller at the University of Alaska Fairbanks' Alaska Geobotany Center and obtained via the Arctic Geoecological Atlas (http://arcticatlas.geobotany.org/), which provides access to existing Arctic vegetation plot and map data in support of the ABoVE campaign.
Data Characteristics
Spatial Coverage: Imnavait Creek, Alaska
ABoVE Grid Location: Ah1v0.Bh2v3
Spatial Resolution: Point samples
Temporal Coverage: 19840801 to 19850901
Temporal Resolution: Each plot was sampled once.
Study Area: (All latitude and longitude given in decimal degrees)
|
Site |
Westernmost Longitude |
Easternmost Longitude |
Northernmost Latitude |
Southernmost Latitude |
|
Imnavait Creek, Alaska |
-149.325283 |
-149.23 |
68.625 |
68.6 |
Data File Information: There are four data files with this dataset in comma-separated (.csv) format.
Table 1. Data files
| Data File Name | Description |
| Imnavait_Creek_Soil_Data.csv | Soil characterization data for Imnavait Creek research plots |
| Imnavait_Creek_Species_Data.csv | Species cover data for Imnavait Creek research plots |
| Imnavait_Creek_Environmental_Data.csv | Comprehensive set of environmental characterization data for Imnavait Creek research plots including the descriptive site factors. Most measurement data have been processed to provide values at a common 10 cm depth. This measurement comparability facilitates analysis of geo-botanical relationships across Alaska. |
| Imnavait_Creek_Spectral_Biomass_Data.csv | NDVI, LAI, iPAR and above ground biomass data for the Imnavait Creek Research plots |
Data Descriptions: The column names, their units and descriptions for each of the *.csv data files are listed below.
Table 2. Imnavait_Creek_Soil_Data.csv
| Column Name | Units | Description |
| PLOT_NO | Plot number where the soil sample was collected | |
| HORIZON | Soil horizon | |
| DEPTH | CM | Depth of the soil layer. [ Watch out -- opening this *.csv in Excel may cause some DEPTH values to be interpreted as dates. Import DEPTH as 'text'. ] |
| WET_COLOR | MUNSELL | Color of wet soil in the soil sample following Munsell System of Color Notation |
| ORGANIC_MATTER | % | Percentage of organic matter in the soil sample |
| COARSE_GRAVEL | % | Percentage of coarse gravel in the soil sample |
| FINE_GRAVEL | % | Percentage of fine gravel in the soil sample |
| SAND | % | Percentage of sand in the soil sample |
| SILT | % | Percentage of silt in the soil sample |
| CLAY | % | Percentage of clay in the soil sample |
| TEXTURE | Texture of the soil in the soil sample | |
| HYGROSCOPIC_MOISTURE | % | Hygroscopic moisture of the soil sample |
| BULK_DENSITY | G/CC | Bulk density of the soil sample |
| SOIL_PH | PH of the soil sample | |
| CA_NH4OAC_EXTRACT | MEQ/100G | Extractable Ca in the soil sample |
| CA_NH4OAC_EXTRACT | MCG/G | Extractable Ca in the soil sample |
| MG_NH4OAC_EXTRACT | MEQ/100G | Extractable Mg in the soil sample |
| MG_NH4OAC_EXTRACT | MCG/G | Extractable Mg in the soil sample |
| K_NH4OAC_EXTRACT | MEQ/100G | Extractable K in the soil sample |
| K_NH4OAC_EXTRACT | MCG/G | Extractable K in the soil sample |
| NO3_KCL_EXTRACT | MCG/G | Extractable NO3 in the soil sample |
Table 3. Imnavait_Creek_Spectral_Biomass_Data.csv
| Column Name | Units | Description |
| SITE | Site Name | |
| REPLICATE_SAMPLE | Combination of plot number and microsite | |
| PLOT_NUMBER | Plot Number | |
| MICROSITE_WITHIN_PLOT | Microsite description of the plots | |
| PHYSISCAL_CATEGORY | Physiographic category code | |
| PHYSICAL_CATEGORY_NAME | Physiographic category name | |
| ACIDIC_NONACIDIC | Description of acidic/non-acidic | |
| ALLIANCE_CODE | Vegetation alliance code | |
| ALLIANCE_NAME | Vegetation alliance name | |
| ASSOCIATION_CODE | Vegetation association code | |
| ASSOCIATION_NAME | Vegetation association name | |
| SUBASSOCIATION_CODE | Vegetation sub-association code | |
| SUBASSOCIATION_NAME | Vegetation sub-association name | |
| RED_BAND | % | Red/visible band |
| NIR_BAND | % | Near-infrared |
| SAVI | Soil adjusted vegetation index | |
| NDVI | Normalized difference vegetation index | |
| 2ND_DERIV_AT_695NM | 2nd Derivative at 695NM | |
| 2ND_DERIV_AT_743NM | 2nd Derivative at 743 NM | |
| TRANSMITTED | % | Percentage of transmitted radiation |
| IPAR | % | Percentage of incidental photosynthetically active radiation |
| 0_58K_LAI | 0.58K Leaf Area Index | |
| 0_65K_LAI | 0.65K Leaf Area Index | |
| 0_61K_LAI | 0.61K Leaf Area Index | |
| MEAN_LAI | Average leaf area index | |
| PLOT_AVERAGE_LAI | Average leaf area index for the plot | |
| PLOT_AVERAGE_NDVI | Average NDVI for the plot | |
| LIVE_GRAMINOID | G/SQUARE METER | Amount of live graminoid |
| DEAD_GRAMINOID | G/SQUARE METER | Amount of dead graminoid |
| LIVE_FORB | G/SQUARE METER | Amount of live forb |
| DEAD_FORB | G/SQUARE METER | Amount of dead forb |
| LIVE_DECIDUOUS_SHRUB | G/SQUARE METER | Amount of live deciduous shrub |
| DEAD_DECIDUOUS_SHRUB | G/SQUARE METER | Amount of dead deciduous shrub |
| WOODY_DECIDUOUS_SHRUB | G/SQUARE METER | Amount of woody deciduous shrub |
| LIVE_EVERGREEN_SHRUB | G/SQUARE METER | Amount of live evergreen shrub |
| DEAD_EVERGREEN_SHRUB | G/SQUARE METER | Amount of dead evergreen shrub |
| WOODY_EVERGREEN_SHRUB | G/SQUARE METER | Amount of woody evergreen shrub |
| SPHAGNUM | G/SQUARE METER | Amount of sphagnum |
| OTHER_MOSS | G/SQUARE METER | Amount of other types of moss |
| LICHENS | G/SQUARE METER | Amount of lichens |
| MISCELLANEOUS_DEAD | G/SQUARE METER | |
| ALGAE | G/SQUARE METER | Amount of algae |
| LIVE_EQUISETUM | G/SQUARE METER | Amount of live equisetum |
| DEAD_EQUISETUM | G/SQUARE METER | Amount of dead equisetum |
| AQUATIC_MOSS | G/SQUARE METER | Amount of aquatic moss |
| TOTAL_BIOMASS | G/SQUARE METER | Amount of total biomass |
| GREEN_BIOMASS_INCLUDING_LICHENS | G/SQUARE METER | Amount of green biomass including lichens |
| GREEN_BIOMASS_WITHOUT_LICHENS | G/SQUARE METER | Amount of green biomass excluding lichens |
Table 4. Imnavait_Creek_Environmental_Data.csv
Note: Coded and scalar variables are followed by a description column (e.g., LANDFORM and LANDFORM_DESC). See the companion file Imnavait_Creek_Env_Legend.pdf for a complete list of coded and scalar variables and their descriptions.
| Column Name | Units | Description |
| FIELD_PLOT_NUMBER | Field plot number | |
| PLANT_COMMUNITY_NAME | Primary vegetation types | |
| MICROSITE | Detailed description of microsite within the plots | |
| DATE_SAMPLED | YYYYMMDD | Sampling date |
| LATITUDE | Decimal degrees | Latitude of the center of the plots |
| LONGITUDE | Decimal degrees | Longitude of the center of the plots |
| LANDFORM | Landform of the plots | |
| LANDFORM_DESC | Description of landforms of the plots | |
| TERRAIN_UNIT | Glacial geology of the plots | |
| TERRAIN_UNIT_DESC | Description of glacial geology of the plots | |
| SLOPE | Degrees | Slope of the plots |
| ASPECT | Degrees | Aspect of the plots |
| EXPOSURE | Exposure of the plots | |
| EXPOSURE_DESC | Description of the exposure of the plots | |
| SURFACE_FORM | Surficial geomorphology of the plots | |
| SURFACE_FORM_DESC | Description of surficial geomorphology of the plots | |
| MICROSITE_CODE | Microsite of the plots | |
| MICROSITE_DESC | Description of microsite of the plots | |
| COVER_ OF_MICROSITE | % | Percentage of microsite cover in the plot |
| SITE_MOISTURE | Site moisture of the plots | |
| SITE_MOISTURE_DESC | Description of the site moisture of the plots | |
| ESTIMATED_SNOW_DURATION | Estimated snow duration within the plots | |
| ESTIMATED_SNOW_DURATION_DESC | Description of estimated snow duration within the plots | |
| SNOW_ DEPTH | CM | Depth of snow within the plots |
| STABILITY | Stability of the plots | |
| STABILITY_DESC | Description of stability of the plots | |
| CRYOTURBATION | % | Cryoturbation within the plots |
| MICRORELIEF_HEIGHT | CM | Microrelief height of the plots |
| TUSSOCK_THAW_DEPTH | CM | Depth to Tussock permafrost of the plots |
| INTER_TUSSOCK_THAW_DEPTH | CM | Depth to Inter-Tussock permafrost of the plots |
| BARE_SOIL_COVER | % | Percentage of bare soil cover in the plot |
| ROCK_COVER | % | Percentage of rock cover in the plot |
| SOIL_TYPE | Soil units in the plot | |
| SOIL_TYPE_DESC | Description of the soil units within the plot | |
| SOIL_MOISTURE | Soil moisture content within the plots | |
| SOIL_MOISTURE_DESC | Description of the soil moisture content within the plots | |
| LOW_SHRUB_COVER | % | Percentage of low shrub cover in the plot |
| DWARF_SHRUB_COVER | % | Percentage of dwarf shrub cover in the plot |
| MEAN_SHRUB_HEIGHT | CM | Average shrub height within the plot in the plot |
| TUSSOCK_GRAMINOID_COVER | % | Percentage of Tussock graminoid cover in the plot |
| NON_TUSSOCK_GRAMINOID_COVER | % | Percentage of Non-Tussock graminoid cover in the plot |
| FORB_COVER | % | Percentage of forb cover in the plot |
| LICHEN_COVER | % | Percentage of lichen cover in the plot |
| BRYOPHYTE_COVER | % | Percentage of bryophyte cover in the plot |
| HORSETAIL_COVER | % | Percentage of horsetail cover in the plot |
| DISTURBANCE_HUMAN | Disturbance by humans | |
| DISTURBANCE_HUMAN_DESC | Description of disturbance by humans | |
| DISTURBANCE_FOX | Disturbance by fox | |
| DISTURBANCE_FOX_DESC | Description of disturbance by fox | |
| DISTURBANCE_BEAR | Disturbance by bear | |
| DISTURBANCE_BEAR_DESC | Description of disturbance by bear | |
| DISTURBANCE_CARIBOU | Disturbance by caribou | |
| DISTURBANCE_CARIBOU_DESC | Description of disturbance by caribou | |
| DISTURBANCE_SQUIRREL | Disturbance by squirrel | |
| DISTURBANCE_SQUIRREL_DESC | Description of disturbance by squirrel | |
| DISTURBANCE_LEMMING_VOLE | Disturbance by lemming vole | |
| DISTURBANCE_LEMMING_VOLE_DESC | Description of disturbance by lemming vole | |
| DISTURBANCE_MOOSE | Disturbance by moose | |
| DISTURBANCE_MOOSE_DESC | Description of disturbance by moose | |
| DISTURBANCE_BIRD | Disturbance by bird | |
| DISTURBANCE_BIRD_DESC | Description of disturbance by bird | |
| DISTURBANCE_INSECT | Disturbance by insect | |
| DISTURBANCE_INSECT_DESC | Description of disturbance by insect | |
| SOIL_ORGANIC_DEPTH | CM | Depth of soil organic matter |
| HORIZON_AT_10_CM | Soil horizon at 10 cm depth | |
| WET_COLOR_AT_10_CM | MUNSELL | Color of wet soil at 10 cm depth following Munsell System of Color Notation |
| ORGANIC_MATTER_AT_10_CM | % | Soil organic matter at 10 cm depth |
| COARSE_GRAVEL_AT_10_CM | % | Percentage of coarse gravel in the soil at 10 cm depth |
| FINE_GRAVEL_AT_10_CM | % | Percentage of fine gravel in the soil at 10 cm depth |
| SAND_AT_10_CM | % | Percentage of sand in the soil at 10 cm depth |
| SILT_AT_10_CM | % | Percentage of silt in the soil at 10 cm depth |
| CLAY_AT_10_CM | % | Percentage of clay in the soil at 10 cm depth |
| TEXTURE_AT_10_CM | Soil texture at the top of the mineral horizon | |
| SOIL_TEXTURE_TOP_MINERAL_HORIZON | Soil texture at 10 cm depth | |
| HYGROSCOPIC_MOISTURE_AT_10_CM | Hygroscopic moisture at 10 cm depth | |
| BULK_DENSITY_AT_10_CM | G/CC | Bulk density of the soil at 10 cm depth |
| SOIL_PH_AT_10_CM | PH of the soil at 10 cm depth | |
| SOIL_PH_AT_TOP_MINERAL_HORIZON | Soil pH at the top of the mineral horizon | |
| CA_NH4OAC_EXTRACT_AT_10_CM | MEQ/100G | Extractable Ca in the soil at 10 cm depth |
| CA_NH4OAC_EXTRACT_AT_10_CM | MCG/G | Extractable Ca in the soil at 10 cm depth |
| MG_NH4OAC_EXTRACT_AT_10_CM | MEQ/100G | Extractable Mg in the soil at 10 cm depth |
| MG_NH4OAC_EXTRACT_AT_10_CM | MCG/G | Extractable Mg in the soil at 10 cm depth |
| K_NH4OAC_EXTRACT_AT_10_CM | MEQ/100G | Extractable K in the soil at 10 cm depth |
| K_NH4OAC_EXTRACT_AT_10_CM | MCG/G | Extractable K in the soil at 10 cm depth |
| NO3_KCL_EXTRACT_AT_10_CM | MCG/G | Extractable NO3 in the soil at 10 cm depth |
| PLOT_SIZE | Size of each plot | |
| PLOT_SHAPE | Shape of each plots | |
| REMARKS | Remarks |
Table 5. Imnavait_Creek_Species_Data.csv
| Column Numbers | Column Name | Units | Description |
| 1 | PASL_TAXON_SCIENTIFIC_NAME_NO_AUTHORS | Current Taxonomy according to the Panarctic Species List (PASL) | |
| 2 | PASL_TAXON_SCIENTIFIC_NAME_WITH_AUTHOR(S) | Current Taxonomy according to the Panarctic Species List (PASL) including authors names | |
| 3 | DATASET_TAXON | Dataset taxonomy | |
| 4 to 87 | SW01 to SW73 | Column headings are all 84 plot numbers. The data values are Species Cover Classes (Braun-Blanquet cover-abundance scale): where r (rare), + (common, but less than 1 percent cover), 1 (1-5 percent), 2 (6 to 25 percent), 3 (25 to 50 percent), 4 (51 to 75 percent), 5 (76 to 100 percent). |
Companion Files: There are four companion files with this dataset in .pdf format.
Table 6. Companion files
| Companion File Name | Description |
|---|---|
| Imnavait_Creek_Veg_Plots_Report_Walker_1987.pdf | Plot data report (Walker et al., 1987) |
| Imnavait_Creek_Plot_Photos.pdf | This file contains landscape, plot, and soil photos of the Imnavait Creek vegetation plots. |
| Imnavait_Creek_Legend.pdf | This file contains the legend for the environmental parameters of the Imnavait Creek vegetation plots. |
| USFWS_Bioreport_Arctic_Wetland_Soil_Veg_WalkerM_1989.pdf | Summary report of all the data collected, methods of collection, maps/plots etc. for the 84 study plots at the Imnavait Creek research site (Walker et al., 1989) |
Application and Derivation
These data bring together for easy reference all the available information collected from the plots and has been used for the classification, mapping and analysis of the environmental controls in the Imnavait Creek region. Derived regional maps of these data will be used in regional models of fluxes of trace gases, water, and energy from tundra surfaces and provides useful input to several phases of the R4D (Response, Resistance, Resilience and Recovery from Disturbance) research including the landscape ecology, slope modeling, and the primary productivity studies. In addition, a circumpolar vegetation classification resulting from these datasets would be highly desirable to extend the results to the entire arctic region.
Quality Assessment
No specific quality assessment information provided.
Data Acquisition, Materials, and Methods
Imnavait Creek is situated in a shallow basin at the foothills of the central Brooks Range and the Imnavait Creek vegetation area is located near the center of the Upper Kuparuk River region and encloses a 22-km2 area northeast of Toolik Lake, close to the southern foothills of northern Alaska. The Dalton Highway and the trans-Alaska pipeline both pass nearby. The hills near Imnavait Creek rise less than 100 m from the valley bottoms to the crests, and are elongated in SSE to NNW trending ridges. The west-facing aspects of these ridges are much gentler and longer than the east-facing aspects; in fact, over 60% of the terrain has NW/SW-facing aspects. Most hill crests have till at the surface, providing rocky mineral substrate for plant communities, whereas hill slopes and valley bottoms are generally smoothly eroded and covered by colluvium and shallow peat deposits. Imnavait Creek was chosen as a study site as it provides a good representation of the southern foothills of the Brooks Range, a glaciated region characterized by rolling tundra plains interspersed with hills, knobs and low ridges. Data includes the baseline plot information for vegetation, soils, and site factors for the study plots subjectively located in 14 plant communities that occur in 19 broad habitat types across the glaciated landscape.
The eighty-four plots at the Imnavait Creek research site at the foothills of the central Brooks Range (shown in Figure 2) were subjectively located in 14 plant communities and 19 broad habitat types including:
- dry sandstone outcrops (6 plots),
- glacial boulder fields (2 plots),
- dry rocky till (5 plots), hill slope nonsorted stripes (5 plots),
- frost scars on stripes (5),
- areas between nonsorted stripes (3 plots),
- hill slopes between with solifluction (5 plots),
- snowbeds (10 plots),
- water tracks (7 plots),
- margins of water tracks (2 plots),
- hill slopes between water tracks, (12 plots),
- west frost scars (3 plots),
- hummocks and strangs in wet meadows of colluvial basins (3 plots),
- wet tundra between strangs in colluvial basins (6 plots),
- palsas (2 plots),
- stream margins (4 plots),
- stream channels (2 plots),
- and beaded-stream ponds (3 plots)
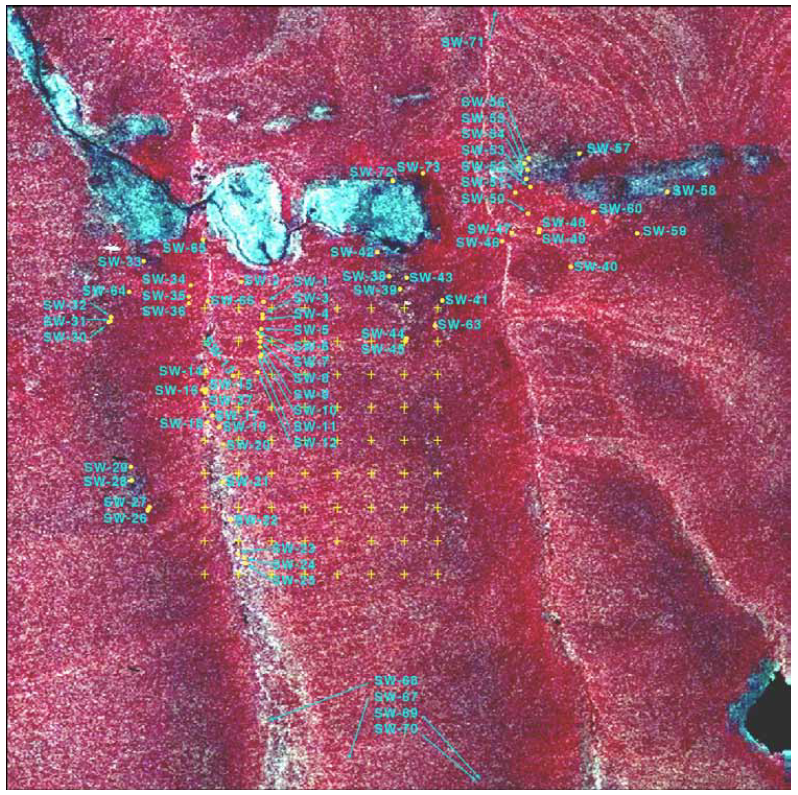
Figure 2. Location map of the 84 Imnavait Creek Permanent Vegetation Plots.
Vegetation Plot Sampling
A formal relevé sampling of the designated plots was done during the period August 1-10, 1984 and August 17-September 4, 1985 to sample the diversity of vegetation types of the region. Each plot was marked with a 1.3 m high wooden lathe in the center of the plot and three short stakes on the perimeter of the plot. An aluminum identification tag was attached to the center stake. The plots had no fixed size in order to obtain a complete species list, however the size of the plots were estimated and are included within these data. For more details see Imnavait_Creek_Veg_Plots_Report_Walker_1987.pdf
Sampling of the plots included:
- Taking photographs of the general site (Figure 1), close-up of vegetation (Figure 3), and close-up of the soil profile (Figure 4). Photos are provided in Imnavait_Creek_Veg_Plots_Report_Walker_1987.pdf and Imnavait_Creek_Plot_Photos.pdf. Within each permanent plot, a smaller 1-m2 photo-plot was marked for periodic close-up photos to record long-term changes due to mortality, recruitment, disturbance, or climate changes. This plot was marked with four wire flags and string around the perimeter of the plot.
- Measuring site factors listed in Table 3 plus measurements of thaw depth, estimates of cover of bare soil, rocks, the height of vegetation and the major plant growth forms as summarized in Table 4
- Field sampling of soils where soil pits were dug adjacent to the plots and described and classified according to the U.S. soil taxonomy [Walker et al., 1987]. Soil samples were collected from each horizon and air dried in the laboratory. Bulk density and soil moisture samples were taken from the sides of the soil pits or from large solid plugs for the wet soils using a 240-ml soil can.
- Laboratory analysis of soil samples included routine analysis on all samples [pH (saturated paste); electric current; NO3-N, (KCL extract); P, K, Zn, Fe, Cu, Mn, (NH4HCO3-DPTA extract); lime estimate, texture estimate (by hand); organic matter (Walkley-Black or ash method); and Sodium Adsorption Ratio]. Selected samples were analyzed for percent sand, percent silt and percent clay; and Ca, Mg, Na, K (NH4OAc extract).
- Estimating vegetation cover using the Braun-Blanquet cover-abundance scale (r = rare; + = common but less than 1 % cover; 1 = 1-5%; 2 = 6-25%; 3 = 25-50%; 4 = 51-75%; 5 = 76-100%). Plant communities were determined and sample plots were marked with stakes. The area surrounding each plot marker was searched until no new species in the plant community being sampled were encountered. Cover abundance values are relatively broad subjective classes, and were determined by estimating cover within the general area of the stake. Voucher collections were made for all vascular plants, bryophytes, and lichens occurring in the relevé.
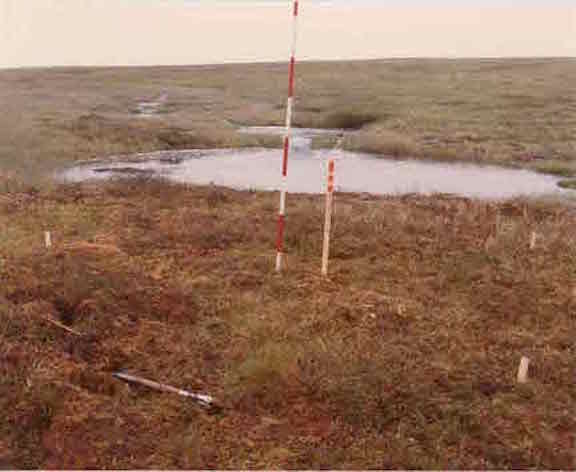
Figure 3: Vegetation at one of the Imnavait Creek permanent plots (Plot SW-15).
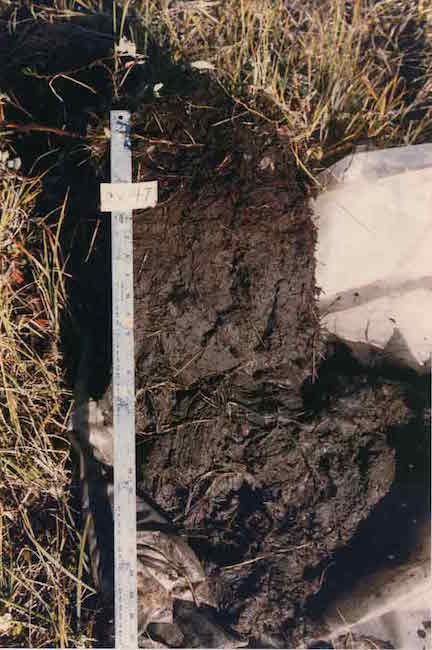
Figure 4: Soil profile at one of the Imnavait Creek permanent plots (Plot SW-47).
Spectral and Biomass Data
NDVI, LAI, iPAR, and above ground biomass measurements were collected for the Imnavait Creek permanent vegetation plots. The results were published in Shippert et al. (1995) and Walker et al. (1995).
Overall 3 random replicates were sampled at each plot between 25 July and 10 August 1993. These measurements are named by the suffix A, B, or C added to the plot ID.
- The NDVI data are derived from field spectroscopy carried out with a ASD PS-II portable field spectrometer. The NDVI values were calculated from reflectances at wavelengths corresponding to the Landsat TM red band (630-690 nm) and the near-infrared band (760-900 nm).
- The LAI was measured with a PCA-2000 plant canopy analyzer by LI-COR Inc.
- IPAR was measured with a LI-1000-line quantum sensor by LI-COR Inc.
- Total biomass was measured by collecting all above-ground organic material at each sample site within a 50x20 cm wire frame centered over the site of reflectance, LAI and iPAR measurements.
Note that the Spectral and Biomass - Imnavait Creek Plot (IMN) numbers correspond to the Imnavait Creek plot numbers established by Walker whose field numbers begin with SW.
Data Access
These data are available through the Oak Ridge National Laboratory (ORNL) Distributed Active Archive Center (DAAC).
Arctic Vegetation Plots at Imnavait Creek, Alaska, 1984-1985
Contact for Data Center Access Information:
- E-mail: uso@daac.ornl.gov
- Telephone: +1 (865) 241-3952
References
Shippert, M. M., D. A. Walker, N. A. Auerbach, and B. E. Lewis. 1995. Biomass and leaf-area index maps derived from SPOT images for Toolik Lake and Imnavait Creek areas, Alaska. Polar Record 31:147–154.
Walker, D. A., F. J. A. Daniëls, I. Alsos, U. S. Bhatt, A. L. Breen, M. Buchhorn, H. Bültmann, L. A. Druckenmiller, M. E. Edwards, D. Ehrich, H. E. Epstein, W. A. Gould, R. A. Ims, M. H, M. K. Raynolds, J. Sibik, and S. S. Talbot. 2016a. Arctic vegetation: A hierarchic review of productivity, biodiversity patterns and an Arctic vegetation archive. Environmental Research Letters
Walker, D. A.; A. L. Breen; L. A. Druckenmiller; L. W. Wirth; W. Fisher; M. K. Raynolds; J. Šibík; M. D. Walker; S. Hennekens; K. Boggs; T. Boucher; M. Buchhorn; H. Bültmann; D. J. Cooper; F. J.A Daniëls; S. J. Davidson; J. J. Ebersole; S. C. Elmendorf; H. E. Epstein; W. A. Gould; R. D. Hollister; C. M. Iversen; M.T. Jorgenson; A. Kade; M. T. Lee; W. H. MacKenzie; R. K. Peet; J. L. Peirce; U. Schickhoff; V. L. Sloan; S. S. Talbot; C. E. Tweedie; S. Villarreal; P. J. Webber; D. Zona. The Alaska Arctic Vegetation Archive. 2016b. Phytocoenologia doi: http://dx.doi.org/10.1127/phyto/2016/0128
Walker, D.A. (Ed). Alaska Arctic Vegetation Archive Workshop, Boulder, Colorado, October 14-16, 2013. CAFF Proceedings Report #11. Akureyri, Iceland. ISBN: 978-9935-431-29-5.
Walker, D. A., N. A. Auerbach, and M. M. Shippert. 1995. NDVI, biomass, and landscape evolution of glaciated terrain in northern Alaska. Polar Record 31:169–178.
Walker, D. A., A. L. Breen, M. K. Raynolds, and M. D. Walker, editors. 2013. Arctic Vegetation Archive Workshop, Krakow, Poland April 14-16, 2013. CAFF Proceedings Report #10. Akureyri, Iceland. ISBN: 978-9935-431-24-0.
Walker, D. A., and M. K. Raynolds. 2011. An International Arctic Vegetation Database: A foundation for panarctic biodiversity studies. CAFF Strategy Series Report nr. 5. Conservation of Arctic Flora and Fauna (CAFF), Akureyri, Iceland.
Walker, M.D., D.A. Walker, and K.R. Everett. 1989. Wetland soils and vegetation, Arctic Foothills, Alaska. U.S. Fish Wildl. Serv. Biol. Rep. 89(7). 89 pp.
Walker, D.A., Lederer, N.D., Walker, M.D. 1987. Permanent vegetation plots (Imnavait Creek): site factors, soil physical and chemical properties, and plant species cover. DOE R4D Program Data Report. 43 pp.