Documentation Revision Date: 2018-12-31
Data Set Version: 1
Summary
The dataset includes three data files in *.csv format and three companion files.
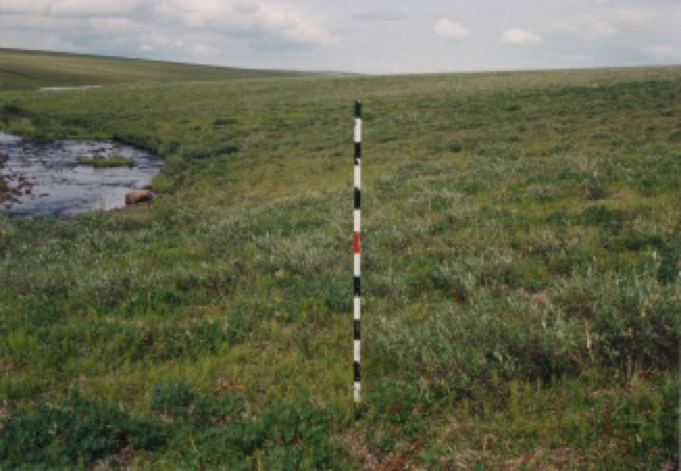
Figure 1. Happy Valley Permanent Vegetation Plot SWT-44.
Citation
Walker, D.A. 2018. Arctic Vegetation Plots at Happy Valley, Alaska, 1994. ORNL DAAC, Oak Ridge, Tennessee, USA. https://doi.org/10.3334/ORNLDAAC/1354
Table of Contents
- Data Set Overview
- Data Characteristics
- Application and Derivation
- Quality Assessment
- Data Acquisition, Materials, and Methods
- Data Access
- References
Data Set Overview
This dataset provides environmental, soil, and vegetation data collected in July 1994 from 56 study plots at the Happy Valley research site, located along the Sagavanirktok River in a glaciated valley of the northern Arctic Foothills of the Brooks Range. Data includes the baseline plot information for vegetation, soils, and site factors for the study plots subjectively located in 17 plant communities that occur in 5 broad habitat types across the glaciated landscape. Specific attributes include: dominant vegetation species, cover, indices, and biomass pools; soil chemistry, physical characteristics, moisture, and organic matter. This product brings together for easy reference all the available information collected from the plots that has been used for the classification, mapping, and analysis of geo-botanical factors in the Happy Valley region and across Alaska.
The Pre-ABoVE vegetation plot datasets were curated to create the Alaska Arctic Vegetation Archive (AVA-AK; Walker et al. 2016b, Walker 2013). The AVA-AK is a regional database that is part of the larger Arctic Vegetation Archive (Walker 2016a, Walker et al. 2013, Walker and Raynolds 2011). The database contains vegetation plots from homogeneous plant communities with tables of cover or cover-abundance scores for all species and accompanying environmental site data. Field data were collected using Braun-Blanquet, US National Vegetation Classification protocols, or comparable methods.
Project: Arctic-Boreal Vulnerability Experiment (ABoVE)
The Arctic-Boreal Vulnerability Experiment (ABoVE) is a NASA Terrestrial Ecology Program field campaign that will take place in Alaska and western Canada between 2016 and 2021. Climate change in the Arctic and Boreal region is unfolding faster than anywhere else on Earth. ABoVE seeks a better understanding of the vulnerability and resilience of ecosystems and society to this changing environment.
Acknowledgements:
These data files were edited by Donald A. Walker, Amy L. Breen and Lisa A. Druckenmiller at the University of Alaska Fairbanks' Alaska Geobotany Center and obtained via the Arctic Geoecological Atlas (http://arcticatlas.geobotany.org/), which provides access to existing Arctic vegetation plot and map data in support of the ABoVE campaign.
Data Characteristics
Spatial Coverage: Happy Valley, Alaska
ABoVE Grid Location: Ah00v01Bh03v00
Spatial Resolution: Point samples
Temporal Coverage: 19940718 to 19940731
Temporal Resolution: Each plot was sampled once
Study Area: (All latitude and longitude given in decimal degrees)
|
Site |
Westernmost Longitude |
Easternmost Longitude |
Northernmost Latitude |
Southernmost Latitude |
|
Happy Valley, Alaska |
-148.8685 |
-148.8205 |
69.1689 |
69.122 |
Data File Information: There are three data files with this dataset in comma-separated (.csv) format.
Table 1. Data files
| Data File Name | Description |
| Happy_Valley_Soil_Data.csv | Soil characterization data for Happy Valley research plots |
| Happy_Valley_Species_Data.csv | Species cover data for Happy Valley research plots |
| Happy_Valley_Environmental_Data.csv | Comprehensive set of environmental characterization data for Happy Valley research plots including the descriptive site factors. Most measurement data have been processed to provide values at a common 10 cm depth. This measurement comparability facilitates analysis of geo-botanical relationships across Alaska. |
Data Descriptions: The column names, their units and descriptions for each of the .csv data files are listed below.
Table 2. Happy_Valley_Soil_Data.csv
| Column Name | Units | Description |
| FIELD PLOT NUMBER | Plot number where the soil sample was collected | |
| SAMPLE ID NUMBER | Soil Sample number | |
| DEPTH | CM | Depth of the soil layer |
| HORIZON | Soil horizon | |
| SOIL_PH | PH of the soil sample | |
| ELECTRICAL_ CONDUCTIVITY | MMHOS/CM | Electrical conductivity of the soil sample |
| LIME | Lime in the soil sample | |
| ORGANIC_MATTER | % | Percentage of organic matter in the soil sample |
| NO3_NH4HCO3_DTPA_EXTRACT | ppm | Extractable NO3-NH4HCO3 in the soil sample |
| P_NH4HCO3_DTPA_EXTRACT | ppm | Extractable P in the soil sample |
| K_NH4HCO3_DTPA_EXTRACT | ppm | Extractable K in the soil sample |
| ZN_NH4HCO3_DTPA_EXTRACT | ppm | Extractable Zn in the soil sample |
| FE_NH4HCO3_DTPA_EXTRACT | ppm | Extractable Fe in the soil sample |
| MN_NH4HCO3_DTPA_EXTRACT | ppm | Extractable Mn in the soil sample |
| CU_NH4HCO3_DTPA_EXTRACT | ppm | Extractable Cu in the soil sample |
| SAND | % | Percentage of sand in the soil sample |
| SILT | % | Percentage of silt in the soil sample |
| CLAY | % | Percentage of clay in the soil sample |
| TEXTURE | Texture of the soil in the soil sample | |
| CA_NH4OAC_EXTRACT | MEQ/L | Extractable Ca in the soil sample |
| MG_NH4OAC_EXTRACT | MEQ/L | Extractable Mg in the soil sample |
| NA_NH4OAC_EXTRACT | MEQ/L | Extractable Na in the soil sample |
| K_NH4OAC_EXTRACT | MEQ/L | Extractable K in the soil sample |
| SODIUM ABSORPTION RATIO | Sodium absorption ratio of the soil sample |
Table 3. Happy_Valley_Environmental_Data.csv
Note: Coded and scalar variables are followed by a description column (e.g. landform and landform_desc). See the companion file Happy_Valley_Env_Legend.pdf for a complete list of coded and scalar variables and their descriptions.
| Column Name | Units | Description |
| FIELD_PLOT_NUMBER | Field plot number | |
| PRINCIPAL_HABITAT | Principal habitat in the plot | |
| PRELIMINARY_COMMUNITY_NAME | Preliminary vegetation type within the plots based on habitat and dominant species | |
| PLANT_COMMUNITY | Primary vegetation types | |
| MICROSITE | Detailed description of microsite within the plots | |
| DATE_SAMPLED | YYYYMMDD | Sampling date |
| LATITUDE | DD | Latitude of the center of the plots |
| LONGITUDE | DD | Longitude of the center of the plots |
| LANDFORM | Landform of the plots | |
| LANDFORM_DESC | Description of landforms of the plots | |
| SURFICIAL_GEOLOGY | Surficial geology of the plots | |
| SURFICIAL_GEOLOGY_DESC | Description of surficial geology of the plots | |
| SURFICIAL_GEOMORPHOLOGY | Surficial geomorphology of the plots | |
| SURFICIAL_GEOMORPHOLOGY_DESC | Description of surficial geomorphology of the plots | |
| MICROSITE_CODE | Microsite of the plots | |
| MICROSITE_DESC | Description of microsite of the plots | |
| GLACIAL_GEOLOGY | Glacial geology of the plots | |
| GLACIAL_GEOLOGY_DESC | Description of glacial geology of the plots | |
| TOPOGRAPHIC_POSITION | Topographic position of the plots | |
| TOPOGRAPHIC_POSITION | Description of the topographic position of the plots | |
| SOIL_UNITS | Soil units in the plot | |
| SOIL_UNITS_DESC | Description of the soil units within the plot | |
| SLOPE | Degrees | Slope of the plots |
| ASPECT | Degrees | Aspect of the plots |
| THAW_DEPTH | CM | Depth to permafrost of the plots |
| THAW_DEPTH_STANDARD_DEVIATION_WHERE_CALCULATED | CM | Standard Deviation in the depth to permafrost of the plots |
| SITE_MOISTURE | Site moisture of the plots | |
| SITE_MOISTURE_DESC | Description of the site moisture of the plots | |
| SOIL_MOISTURE | Soil moisture content within the plots | |
| SOIL_MOISTURE_DESC | Description of the soil moisture content within the plots | |
| EXPOSURE | Exposure of the plots | |
| EXPOSURE_DESC | Description of the exposure of the plots | |
| ESTIMATED_SNOW_DURATION | Estimated snow duration within the plots | |
| ESTIMATED_SNOW_DURATION_DESC | Description of estimated snow duration within the plots | |
| ANIMAL_HUMAN_DISTURBANCE | Amount of animal/human disturbance | |
| ANIMAL_HUMAN_DISTURBANCE_DESC | Description of the amount of animal/human disturbance | |
| STABILITY | Stability of the plots | |
| STABILITY_DESC | Description of stability of the plots | |
| PLOT_SIZE | M x M | Size of each plot |
| COVER_TALL_SHRUBS | % | Percentage of tall shrub cover in the plot |
| COVER_LOW_SHRUBS | % | Percentage of low shrub cover in the plot |
| DWARF_SHRUB_COVER | % | Percentage of dwarf shrub cover in the plot |
| COVER_EVERGREEN_SHRUBS | % | Percentage of evergreen shrub cover in the plot |
| COVER_DECIDUOUS_SHRUBS | % | Percentage of deciduous shrub cover in the plot |
| COVER_FORBS | % | Percentage of forb cover in the plot |
| COVER_HORSETAILS | % | Percentage of horsetail cover in the plot |
| COVER_GRAMINOIDS | % | Percentage of graminoid cover in the plot |
| COVER_LICHENS | % | Percentage of lichen cover in the plot |
| COVER_BRYOPHYTES | % | Percentage of bryophyte cover in the plot |
| COVER_ROCKS | % | Percentage of rock cover in the plot |
| COVER_BARE_SOIL | % | Percentage of bare soil cover in the plot |
| COVER_WATER | % | Percentage of water cover in the plot |
| COVER_FROST_SCARS | % | Percentage of frost scars in the plot |
| COVER_TOTAL_DEAD | % | |
| HEIGHT_OF_VEGETATION | CM | Average vegetation height within the plot |
| ELEVATION_TO_NEAREST_50M | M | Elevation |
| HORIZON_AT_10_CM | Soil horizon at 10 cm depth | |
| ORGANIC_LAYER_DEPTH | CM | Depth of soil organic layer |
| SOIL_PH_AT_10_CM | PH of the soil at 10 cm depth | |
| ELECTRICAL_CONDUCTIVITY_AT_10_CM | MMHOS/CM | Electrical conductivity of the soil at 10 cm depth |
| LIME_AT_10_CM | CACO3 equivalent in the soil at 10 cm depth | |
| ORGANIC_MATTER_AT_10_CM | % | Soil organic matter at 10 cm depth |
| NO3_N_NH4HC3_DTPA_EXTRACT_AT_10_CM | PPM | Extractable NO3-NH4HCO3 in the soil at 10 cm depth |
| P_NH4HC3_DTPA_EXTRACT_AT_10_CM | PPM | Extractable P in the soil at 10 cm depth |
| K_NH4HC3_DTPA_EXTRACT_AT_10_CM | PPM | Extractable K in the soil at 10 cm depth |
| ZN_NH4HC3_DTPA_EXTRACT_AT_10_CM | PPM | Extractable Zn in the soil at 10 cm depth |
| FE_NH4HC3_DTPA_EXTRACT_AT_10_CM | PPM | Extractable Fe in the soil at 10 cm depth |
| MN_NH4HC3_DTPA_EXTRACT_AT_10_CM | PPM | Extractable Mn in the soil at 10 cm depth |
| CU_NH4HC3_DTPA_EXTRACT_AT_10_CM | PPM | Extractable Cu in the soil at 10 cm depth |
| SAND_AT_10_CM | % | Percentage of sand in the soil at 10 cm depth |
| SILT_AT_10_CM | % | Percentage of silt in the soil at 10 cm depth |
| CLAY_AT_10_CM | % | Percentage of clay in the soil at 10 cm depth |
| TEXTURE_AT_10_CM | Texture of the soil at 10 cm depth | |
| TEXTURE_TOP_MINERAL_HORIZON | Soil texture at the top of the mineral horizon | |
| CA_NH4OAC_EXTRACT_AT_10_CM | MEQ/L | Extractable Ca in the soil at 10 cm depth |
| MG_NH4OAC_EXTRACT_AT_10_CM | MEQ/L | Extractable Mg in the soil at 10 cm depth |
| NA_NH4OAC_EXTRACT_AT_10_CM | MEQ/L | Extractable Na in the soil at 10 cm depth |
| K_NH4OAC_EXTRACT_AT_10_CM | MEQ/L | Extractable K in the soil at 10 cm depth |
| SODIUM_ABSORPTION_RATIO | Sodium absorption ratio of the soil within the plot |
Table 4. Happy_Valley_Species_Data.csv
| Column Numbers | Column Name | Units | Description |
| 1 | PASL_TAXON_SCIENTIFIC_NAME_NO_AUTHORS | Current Taxonomy according to the Panarctic Species List (PASL) | |
| 2 | PASL_TAXON_SCIENTIFIC_NAME_WITH_AUTHOR(S) | Current Taxonomy according to the Panarctic Species List (PASL) includng authors names | |
| 3 | DATASET_TAXON | Dataset taxonomy | |
| 4 to 59 | HV1 to HV55 (this includes 42a and 42b) | Column headings are all 56 plot numbers. The data values are Species Cover Classes (Braun-Blanquet cover-abundance scale): where r (rare), + (common, but less than 1 percent cover), 1 (1-5 percent), 2 (6 to 25 percent), 3 (25 to 50 percent), 4 (51 to 75 percent), 5 (76 to 100 percent). |
Companion Files: There are three companion files with this dataset in .pdf format.
Table 5. Companion files
| Companion File Name | Description |
| Happy_Valley_Veg_Plots_Report_Walker_1997.pdf | Summary report of all the data collected, methods of collection, maps/plots etc. for the 56 study plots at the Happy Valley research site (Walker et al., 1997). |
| Happy_Valley_Plot_Photos.pdf | This file contains landscape, plot, and soil photos of the Happy Valley vegetation plots. |
| Happy_Valley_Env_Legend.pdf | This file contains the legend for some of the environmental parameters for the Happy Valley vegetation plots. |
Application and Derivation
These data bring together for easy reference all the available information collected from the plots and that has been used for the classification, mapping and analysis of the geo-botanical factors in the Happy Valley region. Derived regional maps of these data will be used in regional models of fluxes of trace gases, water, and energy from tundra surfaces. In addition, a circumpolar vegetation classification resulting from these datasets would be highly desirable to extend the results to the entire arctic region.
Quality Assessment
No specific quality assessment information provided.
Data Acquisition, Materials, and Methods
The fifty-six study plots at the Happy Valley research site located along the Sagavanirktok River in northern Alaska (shown in Figure 2) were subjectively located in 17 plant communities and 5 broad habitat types including: dry tundra (including river terraces and frost scars) (10 plots), snowbeds (2 plots), moist tundra (including acidic tussock tundra and nonacidic tundra) (14 plots), shrublands (including riparian alders, riparian willow communities, and dwarf-birch shrub tundra) (16 plots), and wet tundra (including fens, poor fens, and aquatic marshes) (14 plots).
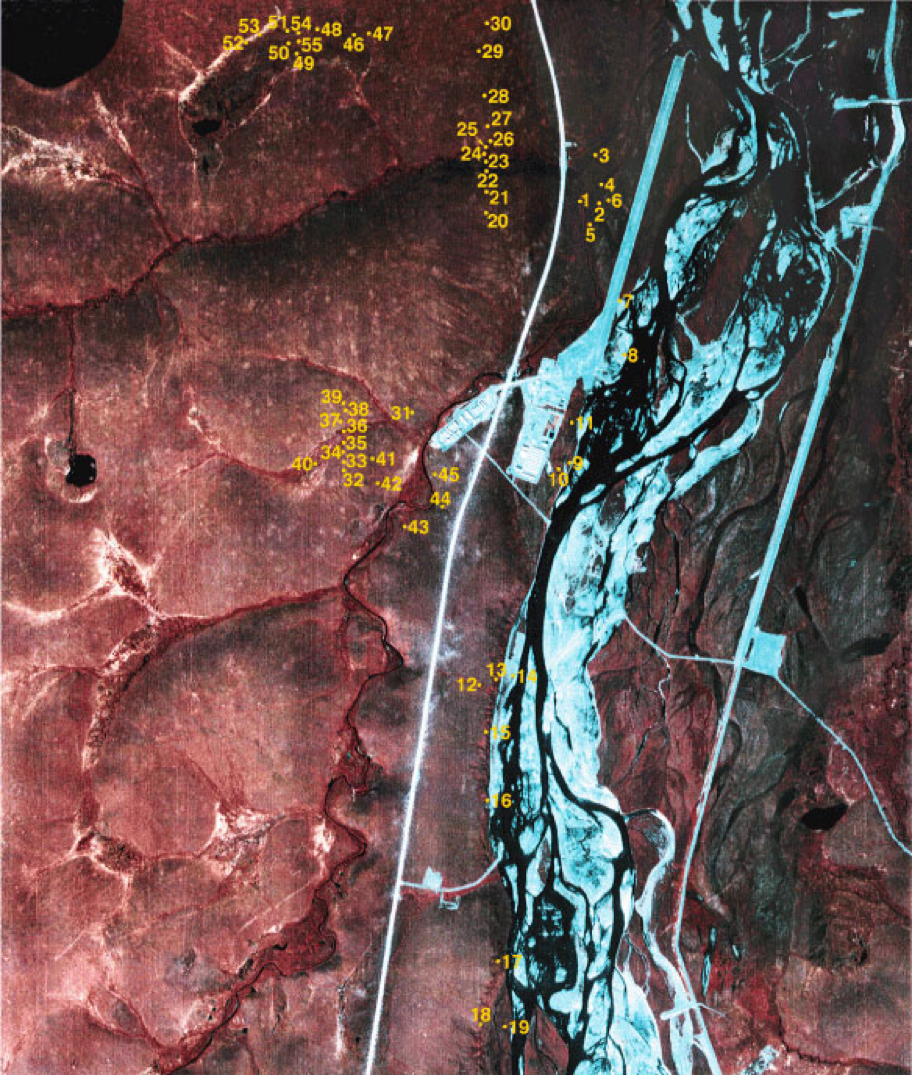
Figure 2. Location map of the 56 Happy Valley Permanent Vegetation Plots.
Vegetation Plot Sampling
A formal relevé sampling of the designated plots was done during the period 18-27 July,1994 to sample the diversity of vegetation types of the region. All the plots were permanently marked with a 4-foot black and white-striped 1-inch PVC pipe with the plot number stamped into an aluminum tag at the top of the post. The plots had no fixed size in order to obtain a complete species list, however the size of the plots were estimated and are included within these data. For more details see Happy_Valley_Veg_Plots_Report_Walker_1997.pdf
Sampling of the plots included:
- Taking photographs of the general site (Figure 1), close-up of vegetation (Figure 3), and close-up of the soil profile (Figure 4). Photos are provided in Happy_Valley_Plot_Photos.pdf and Happy_Valley_Veg_Plots_Report_Walker_1997.pdf.
- Measuring site factors listed in Table 3 plus measurements of thaw depth, estimates of cover of bare soil, rocks, the height of vegetation and the major plant growth forms as summarized in Table 4
- Field sampling of soils where soil pits were dug adjacent to the plots and described and classified according to the U.S. soil taxonomy [Walker et al., 1997]. Soil samples were collected from each horizon and air dried in the laboratory. Bulk density and soil moisture samples were taken from the sides of the soil pits or from large solid plugs for the wet soils using a 240-ml soil can.
- Laboratory analysis of soil samples included routine analysis on all samples [pH (saturated paste); electric current; NO3-N, (KCL extract); P, K, Zn, Fe, Cu, Mn, (NH4HCO3-DPTA extract); lime estimate, texture estimate (by hand); organic matter (Walkley-Black or ash method); and Sodium Adsorption Ratio]. Selected samples were analyzed for percent sand, percent silt and percent clay; and Ca, Mg, Na, K (NH4OAc extract).
- Estimating vegetation cover using the Braun-Blanquet cover-abundance scale (r = rare; + = common but less than 1 % cover; 1 = 1-5%; 2 = 6-25%; 3 = 25-50%; 4 = 51-75%; 5 = 76-100%). Plant communities were determined and sample plots were marked with stakes. The area surrounding each plot marker was searched until no new species in the plant community being sampled were encountered. Cover abundance values are relatively broad subjective classes, and were determined by estimating cover within the general area of the stake. Voucher collections were made for all vascular plants, bryophytes, and lichens occurring in the relevé.
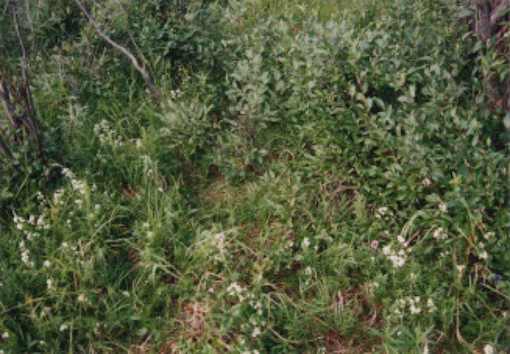
Figure 3: Vegetation at one of the Happy Valley permanent plots (Plot SWT-43).
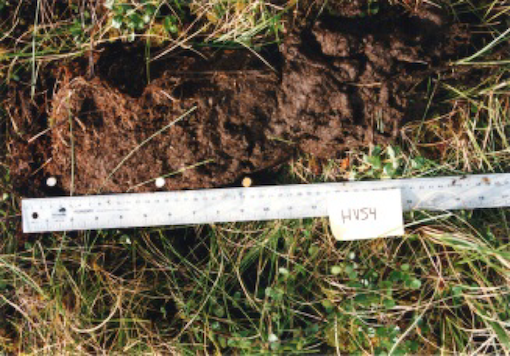
Figure 4: Soil profile at one of the Happy Valley permanent plots (Plot SWT-54).
Data Access
These data are available through the Oak Ridge National Laboratory (ORNL) Distributed Active Archive Center (DAAC).
Arctic Vegetation Plots at Happy Valley, Alaska, 1994
Contact for Data Center Access Information:
- E-mail: uso@daac.ornl.gov
- Telephone: +1 (865) 241-3952
References
Walker, D. A., F. J. A. Daniëls, I. Alsos, U. S. Bhatt, A. L. Breen, M. Buchhorn, H. Bültmann, L. A. Druckenmiller, M. E. Edwards, D. Ehrich, H. E. Epstein, W. A. Gould, R. A. Ims, M. H, M. K. Raynolds, J. Sibik, and S. S. Talbot. 2016a. Arctic vegetation: A hierarchic review of productivity, biodiversity patterns and an Arctic vegetation archive. Environmental Research Letters
Walker, D. A.; A. L. Breen; L. A. Druckenmiller; L. W. Wirth; W. Fisher; M. K. Raynolds; J. Šibík; M. D. Walker; S. Hennekens; K. Boggs; T. Boucher; M. Buchhorn; H. Bültmann; D. J. Cooper; F. J.A Daniëls; S. J. Davidson; J. J. Ebersole; S. C. Elmendorf; H. E. Epstein; W. A. Gould; R. D. Hollister; C. M. Iversen; M.T. Jorgenson; A. Kade; M. T. Lee; W. H. MacKenzie; R. K. Peet; J. L. Peirce; U. Schickhoff; V. L. Sloan; S. S. Talbot; C. E. Tweedie; S. Villarreal; P. J. Webber; D. Zona. The Alaska Arctic Vegetation Archive. 2016b. Phytocoenologia doi: http://dx.doi.org/10.1127/phyto/2016/0128
Walker, D.A. (Ed). Alaska Arctic Vegetation Archive Workshop, Boulder, Colorado, October 14-16, 2013. CAFF Proceedings Report #11. Akureyri, Iceland. ISBN: 978-9935-431-29-5.
Walker, D. A., A. L. Breen, M. K. Raynolds, and M. D. Walker, editors. 2013. Arctic Vegetation Archive Workshop, Krakow, Poland April 14-16, 2013. CAFF Proceedings Report #10. Akureyri, Iceland. ISBN: 978-9935-431-24-0.
Walker, D. A., and M. K. Raynolds. 2011. An International Arctic Vegetation Database: A foundation for panarctic biodiversity studies. CAFF Strategy Series Report nr. 5. Conservation of Arctic Flora and Fauna (CAFF), Akureyri, Iceland.
Walker, D. A., Auerbach, N.A., Nettleton, T.K., Gallant, A., Murphy, S.M. 1997. Happy Valley permanent Veletation plots: site factors,physical and chemical soil properties, plant species cover, photographs, soil descriptions and ordination. Data Report for DOE R4D Program, Institute of Arctic and Alpine Research, University of Boulder, CO.