Documentation Revision Date: 2018-12-31
Data Set Version: 1
Summary
This dataset includes four data files in *.csv format and three companion files in *.pdf format.
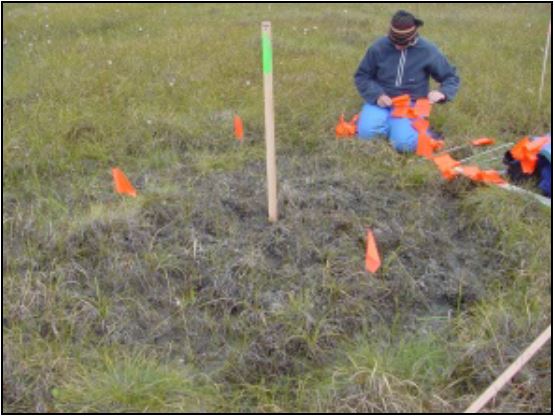
Figure 1. Plot 3 at Franklin Bluffs in northern Alaska
Citation
Kade, A.N. 2018. Arctic Vegetation Plots at Frost Boil Sites, North Slope, Alaska, 2000-2006. ORNL DAAC, Oak Ridge, Tennessee, USA. https://doi.org/10.3334/ORNLDAAC/1361
Table of Contents
- Data Set Overview
- Data Characteristics
- Application and Derivation
- Quality Assessment
- Data Acquisition, Materials, and Methods
- Data Access
- References
Data Set Overview
This dataset describes the environment, soil, and vegetation on nonsorted circles and earth hummocks at seven study sites along a N-S-transect from the Arctic Ocean to the Arctic Foothills, Alaska, based on data collected from 2000 to 2006. These frost-boil features are important landscape components of the arctic tundra. Data includes the baseline plot information for vegetation, soils, and site factors for 117 study plots subjectively located in areas of homogeneous, representative vegetation on frost-heave features surrounding stable tundra. Nine community types were identified in three bioclimate subzones. Vegetation was classified according to the Braun-Blanquet system.
The Pre-ABoVE vegetation plot datasets were curated to create the Alaska Arctic Vegetation Archive (AVA-AK; Walker et al. 2016b, Walker 2013). The AVA-AK is a regional database that is part of the larger Arctic Vegetation Archive (Walker 2016a, Walker et al. 2013, Walker and Raynolds 2011). The database contains vegetation plots from homogeneous plant communities with tables of cover or cover-abundance scores for all species and accompanying environmental site data. Field data were collected using Braun-Blanquet, US National Vegetation Classification protocols, or comparable methods.
Project: Arctic-Boreal Vulnerability Experiment (ABoVE)
The Arctic-Boreal Vulnerability Experiment (ABoVE) iis a NASA Terrestrial Ecology Program field campaign that will take place in Alaska and western Canada between 2016 and 2021. Climate change in the Arctic and Boreal region is unfolding faster than anywhere else on Earth. ABoVE seeks a better understanding of the vulnerability and resilience of ecosystems and society to this changing environment.
Acknowledgements:
These data files were edited by Donald A. Walker, Amy L. Breen and Lisa A. Druckenmiller at the University of Alaska Fairbanks' Alaska Geobotany Center and obtained via the Arctic Geoecological Atlas (http://arcticatlas.geobotany.org/), which provides access to existing Arctic vegetation plot and map data in support of the ABoVE campaign.
Data Characteristics
Spatial Coverage: Frost Boil research sites between the Arctic Ocean and Arctic Foothills, Dalton Highway, Alaska
ABoVE Grid Location: Ah1v0.Bh2v3
Spatial Resolution: Point resolution
Temporal Coverage: 20000816 - 20060730
Temporal Resolution: Each plot was sampled once
Study Area (All latitude and longitude given in decimal degrees)
| Site | Westernmost Longitude | Easternmost Longitude | Northernmost Latitude | Southernmost Latitude |
|
Frost Boil Sites, Alaska |
-148.994 | -147.991 | 70.381 | 69.147 |
Data File Information: There are four data files with this dataset in comma-separated (.csv) format.
Table 1. Data files
| Data File Name | Description |
| Frost_Boils_Soil_Data.csv | Soil characterization data for Frost Boil research plots |
| Frost_Boils_Spectral_Biomass_Data.csv | NDVI and above ground biomass data for Frost Boil research plots |
| Frost_Boils_Environmental_Data.csv | Comprehensive set of environmental characterization data for Frost Boil research plots including the descriptive site factors. |
| Frost_Boils_Species_Data.csv | Species cover data for Frost Boil research plots |
Data Descriptions: The column names, their units, and descriptions for each of the *.csv data files are listed below.
Table 2. Frost_Boils_Soil_Data.csv
| Column Name | Units | Description |
| RELEVE_NUMBER | Releve number | |
| BULK_DENSITY | g/cm3 | Bulk density of the soil sample |
| MOISTURE_GRAVIMETRIC | % | Gravimetric water content in the soil sample |
| MOISTURE_VOLUME | % | Volumetric water content in the soil sample |
| SAND | % | Percentage of sand in the soil sample |
| SILT | % | Percentage of silt in the soil sample |
| CLAY | % | Percentage of clay in the soil sample |
| PH_PASTE | PH of the soil sample | |
| TOTAL_C | % | Percentage of carbon in the soil sample |
| TOTAL_N | % | Percentage of nitrogen in the soil sample |
| C/N | Carbon to nitrogen ratio | |
| K | MEQ/100 G | Extractable K in the soil sample |
| CA | MEQ/100 G | Extractable Ca in the soil sample |
| MG | MEQ/100 G | Extractable Mg in the soil sample |
| NA | MEQ/100 G | Extractable Na in the soil sample |
| DEPTH_LIVE_MOSS | cm | Depth of live moss in the soil sample |
| DEPTH_O_HORIZON | cm | Depth of O horizon in soil profile |
| DEPTH_A_HORIZON | cm | Depth of A horizon in soil profile |
Table 3. Frost_Boils_Spectral_Biomass_Data.csv
| Column Name | Units | Description |
| PLOT | Plot identifier | |
| NDVI | Normalized Difference Vegetation Index | |
| DECIDUOUS_STEM | g/m2 | Amount of deciduous stem |
| DECIDUOUS_LEAF_LIVE | g/m2 | Amount of live deciduous leaf |
| DECIDUOUS_LEAF_DEAD | g/m2 | Amount of dead deciduous leaf |
| DECIDUOUS_FLOWER_FRUIT | g/m2 | Amount of deciduous flower fruit |
| EVERGREEN_STEM | g/m2 | Amount of evergreen stem |
| EVERGREEN_LEAF_LIVE | g/m2 | Amount of live evergreen leaf |
| EVERYGREEN_LEAF_DEAD | g/m2 | Amount of dead evergreen leaf |
| EVERGREEN_FLOWER_FRUIT | g/m2 | Amount of evergreen flower fruit |
| GRAMINOID_LIVE | g/m2 | Amount of live graminoid |
| GRAMINOID_DEAD | g/m2 | Amount of dead graminoid |
| FORB | g/m2 | Amount of forb |
| HORSETAIL | g/m2 | Amount of horsetail |
| LICHEN | g/m2 | Amount of lichen |
| MOSS | g/m2 | Amount of moss |
| ALGAE | g/m2 | Amount of algae |
| TOTAL_ABOVEGROUND_PHYTOMASS | g/m2 | Total amount of aboveground phytomass |
Table 4. Frost_Boils_Environmental_Data.csv
NOTE: Coded and scalar variables are followed by a description column (e.g. MICROSITE & MICROSITE_DESC). See legend companion file for complete list of coded and scalar variables and their descriptions.
| Column Name | Units | Description |
| FIELD_RELEVE_NUMBER | Field plot number | |
| ERECT_DWARF_SHRUB_COVER | % | Percentage of erect dwarf shrub cover in the plot |
| PROSTRATE_DWARF_SHRUB_COVER | % | Percentage of prostrate dwarf shrub cover in the plot |
| EVERGREEN_SHRUB_COVER | % | Percentage of evergreen shrub cover in the plot |
| DECIDUOUS_SHRUB_COVER | % | Percentage of deciduous shrub cover in the plot |
| ERECT_FORB_COVER | % | Percentage of erect forb cover in the plot |
| MATTED_FORB_COVER | % | Percentage of matted forb cover in the plot |
| NON.TUSSOCK_GRAMINOID_COVER | % | Percentage of non-tussock graminoid cover in the plot |
| TUSSOCK_GRAMINOID_COVER | % | Percentage of tussock graminoid cover in the plot |
| FOLIOSE_LICHEN_COVER | % | Percentage of foliose lichen cover in the plot |
| FRUTICOSE_LICHEN_COVER | % | Percentage of fruticose lichen cover in the plot |
| CRUSTOSE_LICHEN_COVER | % | Percentage of crustose lichen cover in the plot |
| PLEUROCARPOUS_MOSS_COVER | % | Percentage of pleurocarpous moss cover in the plot |
| ACROCARPOUS_MOSS_COVER | % | Percentage of acrocarpous moss cover in the plot |
| LIVERWORT_COVER | % | Percentage of liverwort cover in the plot |
| HORSETAIL_COVER | % | Percentage of horsetail cover in the plot |
| ALGAE_COVER | % | Percentage of algae cover in the plot |
| TYPE_OF_FROST_BOIL | Frost boil type | |
| CHARACTERISTIC_SPECIES_ABBREVIATED | Primary species in the plot | |
| DATE | YYYYMMDD | Date of plot observation |
| PLOT_SIZE | m2 | Plot size |
| ELEVATION | m | Elevation of the plot |
| ROCK_COVER | % | Percentage of rock cover in the plot |
| BARE_SOIL_COVER | % | Percentage of bare soil cover in the plot |
| SALT_CRUST_COVER | % | Percentage of salt crust cover in the plot |
| STANDING_WATER_COVER | % | Percentage of standing water cover in the plot |
| DEAD_VEGETATION | % | Percentage of dead vegetation cover in the plot |
| TOTAL_VEGETATION_COVER | % | Percentage of total vegetation cover in the plot |
| VEGETATION_HEIGHT | cm | Vegetation height within the plot |
| MICRORELIEF_HEIGHT | cm | Microrelief height of the plots |
| MICROSITE | Microsite code | |
| MICROSITE_DESC | Description of microsite within the plots | |
| SITE_MOISTURE | Site moisture of the plots | |
| SITE_MOISTURE_DESC | Description of the site moisture of the plots | |
| SOIL_MOISTURE | Site moisture of the plots | |
| SOIL_MOISTURE_DESC | Description of the site moisture of the plots | |
| GLACIAL_GEOLOGY | Glacial geology of the plots | |
| GLACIAL_GEOLOGY_DESC | Description of glacial geology of the plots | |
| TOPOGRAPHY | Topographic position of the plots | |
| TOPOGRAPHY_DESC | Description of the topographic position of the plots | |
| SNOW_DURATION | Estimated snow duration within the plots | |
| SNOW_DURATION_DESC | Description of estimated snow duration within the plots | |
| DISTURBANCE_DEGREE | Degree of disturbance within the plots | |
| DISTURBANCE_DEGREE_DESC | Description of the degree of disturbance within the plots | |
| STABILITY | Stability of the plots | |
| STABILITY_DESC | Description of stability of the plots | |
| EXPOSURE | Exposure of the plots | |
| EXPOSURE_DESC | Description of the exposure of the plots | |
| LOCATION | Location of the plot | |
| SAND | % | Percentage of sand content of the plot soil |
| CLAY | % | Percentage of clay content of the plot soil |
| SILT | % | Percentage of silt content of the plot soil |
| SOIL_PH | pH of the soil in the plot | |
| MEAN_MOSS_LAYER_HEIGHT | cm | Average height of moss layer |
| SOILS.DEPTH_OF_ORGANIC_HORIZON | cm | Depth of organic horizon |
| SOILS.DEPTH_OF_A_HORIZON | cm | Depth of A horizon |
| LATITUDE | decimal degrees | Plot latitude |
| LONGITUDE | decimal degrees | Plot longitude |
| FROST_SCAR_COVER | % | Percentage of frost scar cover in the plots |
| MEAN_THAW_DEPTH | cm | Average depth to permafrost of the plots |
| LANDFORM | Landform of the plots | |
| LANDFORM_DESC | Description of landform of the plots | |
| SURFICIAL_GEOLOGY | Surficial geology of the plots | |
| SURFICIAL_GEOLOGY_DESC | Description of surficial geology of the plots | |
| SURFICIAL_GEOMORPHOLOGY | Surficial geomorphology of the plots | |
| SURFICIAL_GEOMORPHOLOGY_DESC | Description of surficial geomorphology of the plots | |
| SOIL_UNITS | Soil units in the plot | |
| DISTURBANCE_TYPE | Disturbance type in the plots | |
| SLOPE | degrees | Slope of the plots |
| ASPECT | degrees | Aspect of the plots |
| PLANT_COMMUNITY_NAME | Primary vegetation types | |
| LATITUDE_WGS_84 | decimal degrees | Latitude of the plots in WGS 84 |
| LONGITUDE_WGS_84 | decimal degrees | Longitude of the plots in WGS 84 |
| SOIL_TEXTURE | Soil texture of the plots | |
| ALL_FORB_COVER | % | Percentage of forb cover in the plots |
| TOTAL_GRAMINOID_COVER | % | Percentage of graminoid cover in the plots |
| FOLIOSE_AND_FRUTICOSE_LICHEN_COVER | % | Percentage of foliose and fruticose lichen cover in the plots |
| BRYOPHYTES_COVER | % | Percentage of bryophytes cover in the plots |
| MOSS_AND_LIVERWORT_COVER | % | Percentage of moss and liverwort cover in the plots |
| MEAN_CANOPY_COVER | % | Percentage of canopy cover in the plots |
Table 5. Frost_Boils_Species_Data.csv
| Column Numbers | Column Name | Units | Description |
| 1 | PASL_TAXON_SCIENTIFIC_NAME_NO_AUTHORS | Current taxonomy according to the Panarctic Species List (PASL) | |
| 2 | PASL_TAXON_SCIENTIFIC_NAME_WITH_AUTHORS | Current taxonomy according to the Panarctic Species List (PASL) including authors names | |
| 3 | DATASET_TAXON | Dataset taxonomy | |
| 4 to 118 | DATASET_PLOT_NUMBER | Column headings are all 117 plot numbers. The data values are Species Cover Classes (Braun-Blanquet cover-abundance scale): where r (rare), + (common, but less than 1 percent cover), 1 (1-5 percent), 2 (6 to 25 percent), 3 (25 to 50 percent), 4 (51 to 75 percent), 5 (76 to 100 percent). |
Companion Files: There are three companion files with this dataset in .pdf format.
Table 6. Companion files
| Companion Files | Description |
| Frost_Boils_Env_Legend.pdf | List of coded and scalar variables and their descriptions (Frost_Boils_Environmental_Data.csv) |
| Frost_Boils_barredaj2006_Report.pdf | Summary report of all the data collected, methods of collection, maps/plots etc. for the study plots. Barreda et al. 2006. |
| Frost_Boils_Plot_Photos.pdf | Plot photos |
Application and Derivation
Derived regional maps of these data will be used in regional models of fluxes of trace gases, water, and energy from tundra surfaces. In addition, a circumpolar vegetation classification resulting from these datasets would be highly desirable to extend the results to the entire arctic region.
Quality Assessment
No specific quality assessment information provided.
Data Acquisition, Materials, and Methods
The vegetation associated with cryoturbated frost-heave features on the North Slope, Alaska was described by Kade et al. (2005) as part of the "Biocomplexity associated with biogeochemical cycles in arctic frost-boil ecosystems" project (NSF grant #0PP-0120736) from 2002 to 2006. The study sites spanned a latitudinal gradient from the Arctic Ocean (bioclimate subzone C) and Coastal Plain (bioclimate subzone D) to the Arctic Foothills (bioclimate subzone E) of Alaska. Bioclimate subzones and plot locations are depicted in Figure 2.
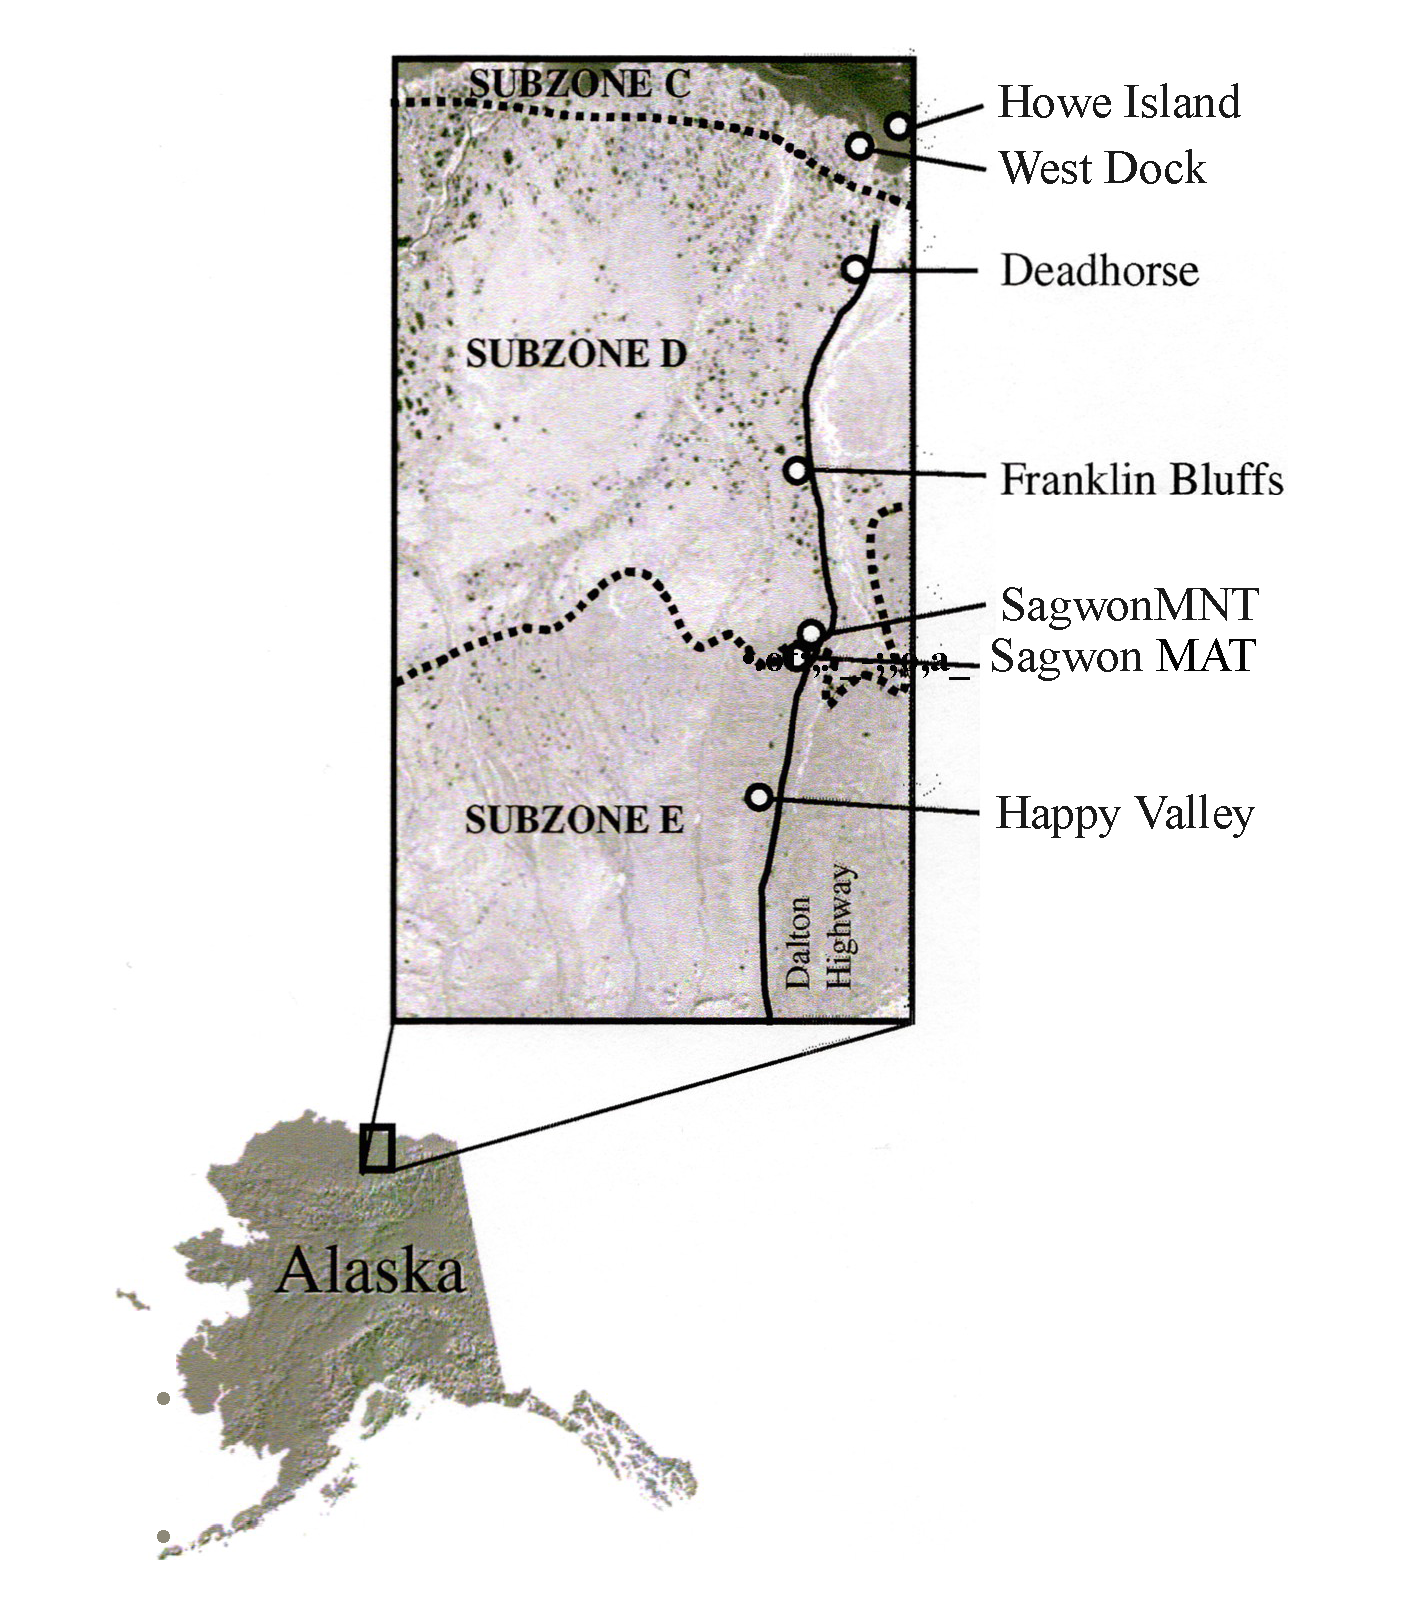
Figure 2. Location of the three climatic subzones and the seven study sites examined by Kade et al. (2005)
Seven study sites were established along a N-S-transect, with a total of 117 relevé plots on frost-heave features and surrounding stable tundra. Nine community types were identified in three bioclimatic subzones: dry nonacidic nonsorted circles (10 plots), dry nonacidic dwarf-shrub tundra (5 plots) and coastal nonacidic willow-sedge tundra (5 plots) in the bioclimate subzone C; moist nonacidic nonsorted circles (42 plots), moist nonacidic dwarf shrub-sedge tundra (20 plots) and wet nonacidic sedge tundra (5 plots) in bioclimate subzone D; and moist acidic lichen- and shrub-rich nonsorted circles and earth hummocks (15 plots), moist acidic tussock tundra (10 plots) and wet acidic nonsorted circles (5 plots) in bioclimate subzone E.
The study plots were chosen subjectively in areas of homogeneous, representative vegetation, permanently marked and geo-referenced. For each plant community, the minimum sampling area was determined. At each study plot, the site variables were recorded and a soil sample of the upper 10 cm of the mineral horizon was collected. The raw environmental data were published in a data report (Barreda et al. 2006). The vegetation data were analyzed using the Braun-Blanquet approach, and the plant community types, including three new associations, were published in Kade et al. (2005).
Species Data
Vegetation sampling was conducted during the summer periods of 2000 through 2003 using the centralized replicate sampling procedure (Mueller-Dombois and Ellenberg 1974). The minimum sampling area of the releves was 1 m2 per plot. Cover abundance as well as the cover of plant functional types and the average vegetation height were estimated.
Species cover data are published in Kade et al. 2005. Species cover classes are coded according to the old Braun-Blanquet cover-abundance scale: r (rare), + (common, but less than 1 percent), 1 (1 to 5 percent), 2 (6 to 25 percent), 3 (26 to 50 percent), 4 (51 to 75 percent), and 5 (76 to 100 percent). Taxa are listed in alphabetical order. Both the dataset author determinations and the current nomenclature according to the Panarctic Species List (PASL) are listed.
In ten instances, taxa were lumped into a single taxon in the PASL:
1) Cetraria islandica (Cetraria islandica and Cetraria islandica s. crispiformis),
2) Cladonia gracilis s. lat. (Cladonia gracilis and Cladonia gracilis s. elongata),
3) Dicranum spadiceum (Dicranum spadiceum and Dicranum angustum),
4) Pedicularis albolabiata (Pedicularis neoalaskanum and Pedicularis sudetica and Pedicularis sudetica s. albolobiata),
5) Polytrichastrum alpinum (Polytrichastrum alpinum v. alpinum and Polytrichastrum alpinum v. fragile),
6) Pseudolophozia sudetica (Lophozia sudetica v. anomala and Lophozia sudetica v. sudetica),
7) Sphenolobus minutus (Sphenolobus minutus and Anastrophyllum minutum),
8) Stellaria longipes (Stellaria longipes s. longipes and Stellaria longipes s. l.),
9) Tortella tortuosa (Tortella tortuosa and Tortella arctica),
10) Tritomaria quinquedentata (Tritomaria quinquedentata and Lophozia collaris).
Environmental Data
The source of these data is the Biocomplexity of Patterned Ground Data Report (Barreda et al., 2006). The plot numbers in the source data are the author's. The main plot numbers in the Turboveg database are accession numbers and will differ. The author's plot numbers are retained in the FIELD_RELEVE_NUMBER field in the Turboveg database.
At each releve, the following site information was recorded: percent bare soil, percent salt crust cover, cover of standing water, site moisture, glacial history, topography, site stability, and elevation. The maximum snow depths in mid-April 2002 to 2004 and maximum thaw depths in late August 2002 to 2004 were measured using a metal probe.
Spectral and Biomass Data
Hyperspectral data were collected between July 19-30, 2006 using a handheld spectraI device. Data were collected preferentially during clear sky conditions and close to midday (10AM-3PM). Collection and processing of the data is detailed in Walker (2011).
Above-ground biomass clippings were also taken at each sample location. These samples were sorted by plant functional type, dried at 50 °C, and the dry weight was measured and recorded for each sample. Vascular plants were clipped at the top of the moss layer or at the bottom of the green shoot. Mosses were clipped at the base of the green moss.
Soils Data
The soils data for the Frost Boils permanent vegetation plots are modified from the data report in Barreda et al. (2006).
At each releve site, the depth of the organic horizon was measured and soil samples of the upper 10 cm of the mineral horizon were collected. Calculation of bulk density and volumetric soil moisture was accomplished by drying field samples at 105º C for 72 hours and determining percentage weight loss. All other analyses were completed on air-dried samples. Particle size was determined using the hydrometer method. Soil pH values were measured using the saturated paste method with a glass electrode pH meter. Total carbon and nitrogen were determined by dry combustion (Robertson et al. 1999). The availability of cations (K+, Na+, Ca2+, Mg2+) was determined with Mehlich-3 extractions (Mehlich 1984).
Data Access
These data are available through the Oak Ridge National Laboratory (ORNL) Distributed Active Archive Center (DAAC).
Arctic Vegetation Plots at Frost Boil Sites, North Slope, Alaska, 2000-2006
Contact for Data Center Access Information:
- E-mail: uso@daac.ornl.gov
- Telephone: +1 (865) 241-3952
References
Barreda, J.E., J.A. Knudson, D.A. Walker, M.K. Raynolds, A.N. Kade, and C.A. Munger. 2006. Biocomplexity of patterned ground, Dalton Highway, 2001-2005. Data Report, Alaska Geobotany Center, University of Alaska Fairbanks. 252 pp.
Kade, A., D.A. Walker, and M.K. Raynolds. 2005. Plant communities and soils in cryoturbated tundra along a bioclimate gradient in the Low Arctic, Alaska. Phytocoenologia 35:761-820.
Mehlich, A. 1984. Mehlich No. 3 extractant: a modification of Mehlich No. 2 extractant. Commun. Soil Sci. and Plant Analysis 5: 409-416.
Mueller-Dombois, D. and H. Ellenberg. 1974: Aims and Methods of Vegetation Ecology. New York: John Wiley and Sons.
Robertson, G.P., D.C. Coleman, C.S. Bledsoe, and P. Sollins (eds.): Standard soil methods for long-term ecological research. New York: Oxford University Press. 89-05.
Walker, D. A., F. J. A. Daniëls, I. Alsos, U. S. Bhatt, A. L. Breen, M. Buchhorn, H. Bültmann, L. A. Druckenmiller, M. E. Edwards, D. Ehrich, H. E. Epstein, W. A. Gould, R. A. Ims, M. H, M. K. Raynolds, J. Sibik, and S. S. Talbot. 2016a. Arctic vegetation: A hierarchic review of productivity, biodiversity patterns and an Arctic vegetation archive. Environmental Research Letters
Walker, D. A.; A. L. Breen; L. A. Druckenmiller; L. W. Wirth; W. Fisher; M. K. Raynolds; J. Šibík; M. D. Walker; S. Hennekens; K. Boggs; T. Boucher; M. Buchhorn; H. Bültmann; D. J. Cooper; F. J.A Daniëls; S. J. Davidson; J. J. Ebersole; S. C. Elmendorf; H. E. Epstein; W. A. Gould; R. D. Hollister; C. M. Iversen; M.T. Jorgenson; A. Kade; M. T. Lee; W. H. MacKenzie; R. K. Peet; J. L. Peirce; U. Schickhoff; V. L. Sloan; S. S. Talbot; C. E. Tweedie; S. Villarreal; P. J. Webber; D. Zona. The Alaska Arctic Vegetation Archive. 2016b. Phytocoenologia doi: http://dx.doi.org/10.1127/phyto/2016/0128
Walker, D.A. (Ed). Alaska Arctic Vegetation Archive Workshop, Boulder, Colorado, October 14-16, 2013. CAFF Proceedings Report #11. Akureyri, Iceland. ISBN: 978-9935-431-29-5.
Walker, D. A., A. L. Breen, M. K. Raynolds, and M. D. Walker, editors. 2013. Arctic Vegetation Archive Workshop, Krakow, Poland April 14-16, 2013. CAFF Proceedings Report #10. Akureyri, Iceland. ISBN: 978-9935-431-24-0.
Walker, D. A., and M. K. Raynolds. 2011. An International Arctic Vegetation Database: A foundation for panarctic biodiversity studies. CAFF Strategy Series Report nr. 5. Conservation of Arctic Flora and Fauna (CAFF), Akureyri, Iceland.
Walker, D. A., Kuss, H. P., Epstein, H. E., Kade, A. N., Vonlanthen, C., Raynolds, M. K., and Daniëls, F. J. A. 2011. Vegetation of zonal patterned-ground ecosystems along the North American Arctic Transect. Applied Vegetation Science 14:440-463.