Documentation Revision Date: 2018-01-10
Data Set Version: 1
Summary
A total of ~15 km of ALT measurements were made using 500 MHz GPR and ~1.5 km of probing data at the four sites. The four sites were selected as they represent a range of environmental conditions commonly observed in the Barrow area. Data were collected in August to approximate the time of year when the active layer would be at its maximum thickness. GPR was ideal for acquiring ALT at very high spatial density over the long distances.
Mechanical probing was used roughly every kilometer to calibrate the GPR wave velocity used to convert the two way transit time to ALT. For each calibration probe the average of three probe measurements were made adjacent to the GPR antenna. In addition, a 100-m survey line was laid along segments of the GPR track and a mechanical probe was used to make a single ALT measurement every meter. The high-density probe measurements were used to calibrate the average wave velocity and standard deviations at each study site. Uncertainty was estimated in GPR ALT due to soil water variability by propagating the standard deviation of wave velocity through the calculation of ALT from the transit time.
There are five data files with this data set which includes three files in comma-separated format (.csv) and two shapefiles (.shp). There are also companion files included with this data set: the shapefiles provided in .kmz format for viewing in GoogleEarth, and raw GPR instrument readings.
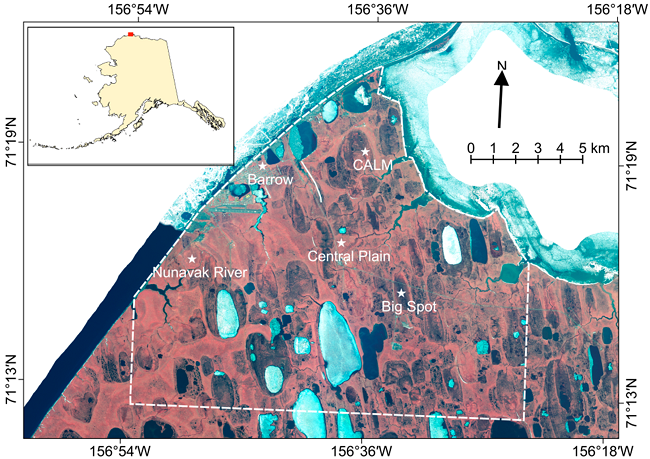
Figure 1. Google Earth Image of the locations of the four sites around Barrow, Alaska (from Fig. 1 in Schaefer et al., 2015).
Citation
Jafarov, E., A. Parsekian, K. Schaefer, L. Liu, A. Chen, S.K. Panda, and T. Zhang. 2018. Pre-ABoVE: Active Layer Thickness and Soil Water Content, Barrow, Alaska, 2013. ORNL DAAC, Oak Ridge, Tennessee, USA. https://doi.org/10.3334/ORNLDAAC/1355
Table of Contents
- Data Set Overview
- Data Characteristics
- Application and Derivation
- Quality Assessment
- Data Acquisition, Materials, and Methods
- Data Access
- References
Data Set Overview
Permafrost active layer thickness (ALT) is an important parameter for studying surface energy balance, ecosystems, and hydrological processes in cold regions. In August of 2013, ALT was estimated at four sites around Barrow, Alaska, using a ground-penetrating radar (GPR) system and mechanical probing. GPR measurements were taken along four transects of varying length (approx. 1 to 7 km). Traditional ALT estimates from mechanical probing included several high-density surveys (every 1 m within 100-m survey line) along each GPR transect. In addition, VWC of the active layer soil was calculated at 3-8 calibration points per site where the probe measurement was exactly co-located with a GPR trace.
A total of ~15 km of ALT measurements were made using 500 MHz GPR and ~1.5 km of probing data at the four sites. Data were collected in August to approximate the time of year when the active layer would be at its maximum thickness. GPR was ideal for acquiring ALT at very high spatial density over the long distances.
Mechanical probing was used roughly every kilometer to calibrate the GPR wave velocity used to convert the two way transit time to ALT. For each calibration probe the average of three probe measurements were made adjacent to the GPR antenna. In addition, a 100-m survey line was laid along segments of the GPR track and a mechanical probe was used to make a single ALT measurement every meter. The high-density probe measurements were used to calibrate the average wave velocity and standard deviations at each study site. Uncertainty was estimated in GPR ALT due to soil water variability by propagating the standard deviation of wave velocity through the calculation of ALT from the transit time.
Project: Arctic-Boreal Vulnerability Experiment (ABoVE)
The Arctic-Boreal Vulnerability Experiment (ABoVE) is a NASA Terrestrial Ecology Program field campaign that will take place in Alaska and western Canada between 2016 and 2021. Climate change in the Arctic and Boreal region is unfolding faster than anywhere else on Earth. ABoVE seeks a better understanding of the vulnerability and resilience of ecosystems and society to this changing environment.
Related Publication:
Jafarov, E. E., Parsekian, A. D., Schaefer, K., Liu, L., Chen, A. C., Panda, S. K. and Zhang, T. (2018), Estimating active layer thickness and volumetric water content from ground penetrating radar measurements in Barrow, Alaska. Geosci. Data J.. doi:10.1002/gdj3.49
Related Data Sets:
Chen, A., A. Parsekian, K. Schaefer, E. Jafarov, S.K. Panda, L. Liu, T. Zhang, and H.A. Zebker. 2015. Pre-ABoVE: Ground-penetrating Radar Measurements of ALT on the Alaska North Slope. ORNL DAAC, Oak Ridge, Tennessee, USA. http://dx.doi.org/10.3334/ORNLDAAC/1265.
Liu, L., K. Schaefer, A. Chen, A. Gusmeroli, E. Jafarov, S. Panda, A. Parsekian, T. Schaefer, H. A. Zebker, T. Zhang. 2015. Pre-ABoVE: Remotely Sensed Active Layer Thickness, Barrow, Alaska, 2006-2011. Data set. Available on-line [http://daac.ornl.gov] from Oak Ridge National Laboratory Distributed Active Archive Center, Oak Ridge, Tennessee, USA. http://dx.doi.org/10.3334/ORNLDAAC/1266
Data Characteristics
Spatial Coverage: Data were collected at four sites around Barrow, Alaska, USA.
ABoVE Site Designation:
Domain: Core ABoVE region
State/territory: Alaska (study sites around Barrow)
Grid cells: Ahh1Avv0Bh2Bv1
Spatial Resolution: GPR measurements were taken along 4 transects of varying length (approx. 1 to 7 km), approximately .5 m between traces. Mechanical probing included several high-density surveys (every 1 m within 100-m survey line) along each transect.
Temporal Coverage: 2013-08-10 to 2013-08-15
Temporal Resolution: 0.5 seconds between GPR traces.
Study Area: (all latitudes and longitudes given in decimal degrees)
| Site | Westernmost Longitude | Easternmost Longitude | Northernmost Latitude | Southernmost Latitude |
|---|---|---|---|---|
| Barrow, Alaska, USA | -156.820302 | -156.557655 | 71.312020 | 71.252975 |
Data File Information:
There are five data files with this data set which includes three files in comma-separated format (*.csv) and two shapefiles (*.zip). Four companion files are also provided and are described at the end of this section.
| File name | Description |
|---|---|
| lvl1_gpr_alt.csv | ALT and uncertainty derived from GPR |
| lvl1_gpr_alt.zip | ALT and uncertainty derived from GPR. When unzipped, this file provides a shapefile (.shp) file. This file contains the same variables as the corresponding .csv . This file is also provided as a companion file in .kmz format for viewing in Google Earth |
| prb_gpr_alt_hd.csv | ALT and uncertainties from probe measurements and from GPR |
| prb_gpr_alt_hd.zip | ALT and uncertainties from probe measurements and from GPR. When unzipped, this file provides a shapefile (.shp) file. This file contains the same variables as the corresponding .csv. This file is also provided as a companion file in .kmz format for viewing in Google Earth |
| probe_data.csv | ALT estimates from mechanical probing at four sites every 1 m within 100-m survey line along each transect |
Variables in the data files
Table 1. Variables in the files lvl1_gpr_alt.csv and lvl1_gpr_alt.zip
There are no missing values in the data file.
| Variable name (.csv files) | Variable name (.shp files) | Units/format | Description |
|---|---|---|---|
| site_ID | site_ID | Sites where ground measurements were made: CP (Central Plain), BS (Big Spot), CL (CALM), and UNB (Upper Nunavak Bay) | |
| lat_gpr | lat_gpr | Decimal degrees | Latitude of point where GPR measurements were made |
| lon_gpr | lon_gpr | Decimal degrees | Longitude of point where GPR measurements were made |
| alt_gpr | alt_gpr | m | ALT determined using GPR |
| unc_alt_gpr | unc_alt_gp | m | The corresponding uncertainty in calculated ALT determined using GPR |
Table 2. Variables in the files prb_gpr_alt_hd.csv and prb_gpr_alt_hd.zip. HD in the file names represents high-density 100-m surveys. Missing data are represented as -999.
| Variable name (.csv files) | Variable name (.shp files) | Units/format | Description |
|---|---|---|---|
| site_ID | site_ID | Sites where ground measurements were made: CP (Central Plain), BS (Big Spot), or CL (CALM) | |
| lat_prb | lat_prb | Decimal degrees | Latitude of point where probe measurements were made |
| lon_prb | lon_prb | Decimal degrees | Longitude of point where probe measurements were made |
| alt_prb | alt_prb | m | ALT determined using probe |
| unc_alt_prb | unc_alt_pr | m | The corresponding uncertainty in calculated ALT with a probe |
| lat_gpr | lat_gpr | Decimal degrees | Latitude of point where GPR measurements were made determined with a handheld Global Positioning System (GPS) unit linked to the system |
| lon_gpr | lon_gpr | Decimal degrees | Longitude of point where GPR measurements were made determined with a handheld Global Positioning System (GPS) unit linked to the system |
| owtt | owtt | ns [nano seconds] | One-way GPR wave transit time. The unit was a Malå CUII GPR unit with a 500 MHz shielded antenna. A Global Positioning System (GPS) unit was attached to the system to record the location of each trace. |
| velocity | velocity | m/ns | GPR wave velocity |
| unc_vel | unc_vel | m/ns | Uncertainty, GPR wave velocity |
| cv_vel | cv_vel | m/ns | Covariance coefficient of velocity (m/nano seconds) |
| alt_gpr | alt_gpr | m | ALT determined using GPR |
| unc_alt_gpr | unc_alt_gp | m | The corresponding uncertainty in calculated ALT determined using GPR |
| vwc | vwc | fraction of 1 | VWC of the active layer soil calculated at 3 to 8 calibration points per site where the probe measurement was exactly co-located with a GPR trace. |
| unc_vwc | unc_vwc | fraction of 1 | Uncertainty of the volumetric water content (VWC) |
Table 3. Variables in the file probe_data.csv
ALT determined at the four study sites using traditional mechanical probing. HD in the variable names represents high-density 100-m surveys. All measurements were made between August 10, 2013 and August 15, 2013. Refer to Table 4 below for probing time and location information. Missing data are represented as -999.
|
Column(s) |
Variable name |
Units/format |
Description |
|
1 |
Distance |
m |
Distance along survey, 1 - 100 m |
|
2 - 3 |
UNB_HD_1 and UNB_HD_2 |
cm |
ALT measurements at site UNB |
|
4 - 9 |
BS_HD_x Where x is 1 – 5, 7 |
cm |
ALT measurements at site BS |
|
10 |
CP_HD_1 |
cm |
ALT measurements at site CP |
|
11-16 |
CL_HD_x Where x is 1 - 6 |
cm |
ALT measurements at site CL |
Table 4. Active layer thickness mechanical probe survey time and locations of the start and end points. High density data measured by ground penetrating radar are missing from the UNB surveys.
| Num | Code | Date | Start | Lat | Lon | End | Lat | Lon |
|---|---|---|---|---|---|---|---|---|
| 1 | UNB_1 | 2013-08-10 | 3:45 | 71.26644444 | -156.82070830 | 4:36 | 71.26555556 | -156.82041670 |
| 2 | UNB_2 | 2013-08-10 | 5:22 | 71.26275000 | -156.80930560 | 5:45 | 71.26336111 | -156.81108330 |
| 3 | BS_1 | 2013-08-11 | 9:40 | 71.26152778 | -156.61797222 | 10:27 | 71.26161111 | -156.61533333 |
| 4 | BS_2 | 2013-08-11 | 11:00 | 71.25977778 | -156.59388889 | 11:38 | 71.25902778 | -156.59338889 |
| 5 | BS_3 | 2013-08-11 | 12:55 | 71.25708333 | -156.56508333 | 1:23 | 71.25661111 | -156.56283333 |
| 6 | BS_4 | 2013-08-11 | 2:05 | 71.25566667 | -156.55086111 | 2:36 | 71.25536111 | -156.54836111 |
| 7 | BS_5 | 2013-08-12 | 1:15 | 71.25583333 | -156.55372222 | 1:37 | 71.25492222 | -156.55313889 |
| 8 | BS_7 | 2013-08-12 | 2:35 | 71.24638889 | -156.55869444 | 3:11 | 71.24666667 | -156.56113889 |
| 9 | CP_1 | 2013-08-12 | 11:13 | 71.27336111 | -156.63983333 | 11:58 | 71.27380556 | -156.63794444 |
| 10 | CL_1 | 2013-08-14 | 9:55 | 71.32127778 | -156.61750000 | 10:26 | 71.32072222 | -156.61952778 |
| 11 | CL_2 | 2013-08-14 | 11:30 | 71.31127778 | -156.63036111 | 11:52 | 71.31063889 | -156.62900000 |
| 12 | CL_3 | 2013-08-14 | 1:11 | 71.30433333 | -156.61033333 | 1:36 | 71.30513889 | -156.61147222 |
| 13 | CL_4 | 2013-08-14 | 2:41 | 71.31540000 | -156.61094444 | 3:12 | 71.31622222 | -156.61347222 |
| 14 | CL_5 | 2013-08-15 | 11:09 | 71.31492000 | -156.59113000 | 11:32 | 71.31434000 | -156.58940000 |
| 15 | CL_6 | 2013-08-15 | 1:25 | 71.31026000 | -156.58823000 | 1:46 | 71.31112000 | -156.58922000 |
Companion files
Four companion files are provided with this data set: two *.kmz files, a compressed (*.zip) directory containing raw GPR instrument readings from the study, and a document (.pdf) describing this raw GPR data.
|
File name |
Description |
|
lvl1_gpr_alt.kmz |
ALT and uncertainty derived from GPR. This file contains the same data as the corresponding shapefile and is provided for viewing in Google Earth |
|
prb_gpr_alt_hd.kmz |
ALT and uncertainties from probe measurements and from GPR. This file contains the same data as the corresponding shapefile and is provided for viewing in Google Earth |
|
Raw_GPR_Data_Barrow_2013 |
Raw GPR data. There are five folders of data. |
|
ALT_GPR_Barrow.pdf |
A pdf of this document |
Application and Derivation
ALT is a critical parameter for monitoring the status of permafrost that is typically measured at specific locations using probing, in situ temperature sensors, or other ground-based observations. These data are useful for comparing the accuracy of ground-penetrating radar (GPR) as a method of estimating permafrost ALT.
Quality Assessment
The uncertainty sources are independent of one another, so the total uncertainty in the GPR ALT values is the wave velocity and time-average uncertainty added in quadrature. Covariance coefficients were calculated for two way travel time and velocities by dividing the corresponding standard deviations over means (Jafarov et al., 2016, in review). The corresponding uncertainty is provided for every measured and derived parameter in the calibrated data set using Gaussian error propagation.
Missing GPS data prevented the calibration of the GPR data using all probe points at Nunavak River, resulting in a high uncertainty and a probable bias towards wetter conditions (Jafarov et al., 2016, in review). Good GPR data at two HD surveys were not collected at the UNB due to gravel type soil texture.
Differences in ALT at sites could be attributed to the positioning error between GPR track and probe line. Even a slight deviation from the GPR track could create a mismatch between the ALT GPR and probe data (Jafarov et al., 2016, in review).
Data Acquisition, Materials, and Methods
This data set provides permafrost ALT and calculated uncertainties determined using a ground-penetrating radar (GPR) system in the field in August 2013 at Barrow, Alaska. GPR measurements were taken along 4 transects of varying length (approx. 1 to 7 km). Traditional ALT estimates from mechanical probing include several high-density surveys (every 1 m within 100-m survey line) along each transect.
The GPR and probe data were collected in the field in August 2013. The four sites were selected as they represent a range of environmental conditions commonly observed in the Barrow area.
Study sites
The four study sites included:
Big Spot (BS): This site is a series of drained thermokarst lake basins (DTLBs) of varying ages. This site was chosen because it represented conditions typical of DTLBs around Barrow.
The CALM site (CL): This site has two large DTLBs separated by a narrow strip of undisturbed tundra. This site was chosen to evaluate conditions within and outside of large DTLBs and because of the availability of long-term measurements of ALT at the two Barrow sites in the CALM network, U1 and U2. U1 consists of a 1-km square grid of measurement sites, called nodes, placed 100 m apart where ALT has been measured using probing since 1995. U2, also known as the Cold Regions Research and Engineering Laboratory (CRREL) site, consists of a 10-m square plot of 320 randomly placed probe measurements.
The Central Plain site (CP): This site is a matrix of high-center polygons with fully saturated soil and standing water over the ice wedges. This site was chosen because it represented typical undisturbed tundra around Barrow.
The Upper Nunavak Bay (UNB): This site covers the upper portion of the Nunavak drainage basin, just south of the Barrow airport. The site consists of undisturbed tundra surrounded on three sides by the Nunavak River and its tributaries. The undisturbed tundra consists of a matrix of high-centered polygons similar to Central Plain, but with less standing water over the ice wedges. The elevation drops 3-4 m near the Nunavak River, with fully saturated soils and no polygons. This site was chosen because a mix of saturated and unsaturated soil conditions were expected.
In summary, the four sites represented typical undisturbed tundra conditions (Central Plain), drained soils (Nunavak River), the largest and typical DTLB conditions (Big Spot), and large DTLBs with the greatest amount of historical ALT observations (CALM) (Jafarov et al., 2016, in review; Schafer et al., 2015).
Ground Penetrating Radar (GPR)
A total of ~15 km of ALT measurements were made using 500 MHz GPR at the four validation sites in August of 2013. August was chosen to approximate the time of year when the active layer would be at its maximum thickness. GPR uses pulsed radio-frequency electromagnetic waves to noninvasively image the subsurface. Energy emitted from a transmitting antenna travels into the ground and some of the energy is reflected back towards the receiving antenna at the surface, which records the travel time. The digitized record of reflected energy, known as a trace, is made at regular time intervals as the GPR unit is pulled along the ground and the graphic representation of a series of traces is a radargram.
The GPR unit was a Malå CUII with a 500-MHz shielded antenna mounted in a box for protection and stability. A Garmin GPS 18 unit was on top of the box to record the location of the GPR. The reflection at the bottom of the active layer was clearly visible in the raw data, so data filters were not required. Instead, the standard time-zero correction was applied by setting the position of the first arrival as time-zero for each trace and the unambiguous reflection event was digitized directly from the radargrams by hand. The radar reflections were manually digitized, commonly known as picking, as a quality control measure to verify the signals and reduce interpretation errors due to spurious reflections. The GPR traces represent ALT values for a footprint of less than 0.15 m2, based on the antenna frequency and physical properties of the active layer (Jafarov et al., 2016, in review; Schafer et al., 2015).
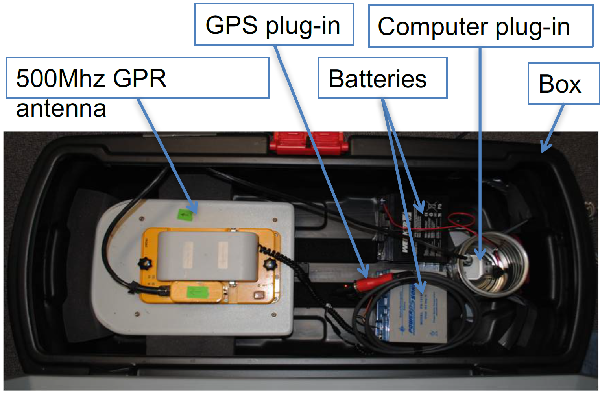
Figure 2. A photo of the GPR unit setup (Jafarov et al., 2016, in review).
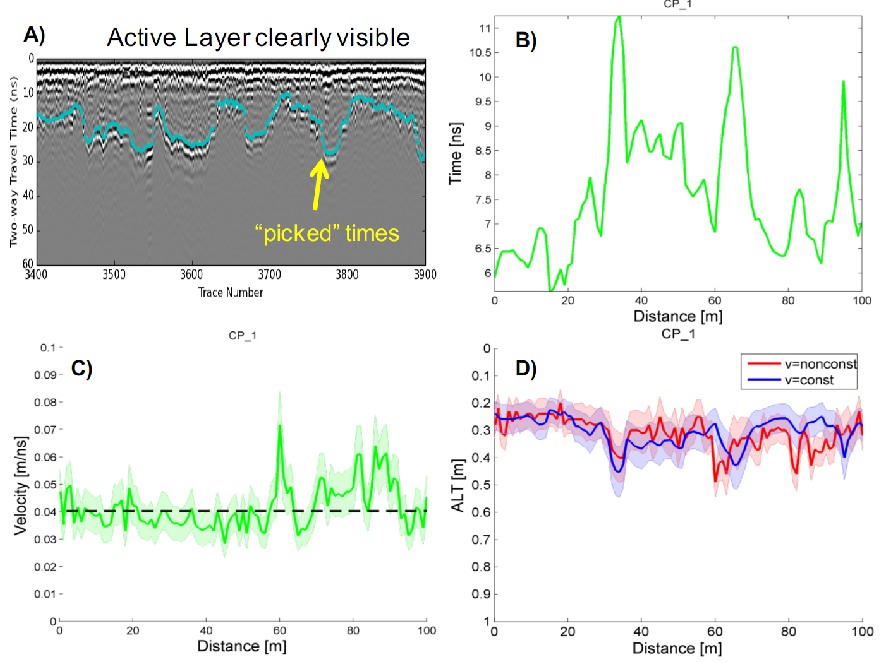
Figure 3. The GPR signal processing workflow: A) picking of the visible GPR travel time, B) one way travel time, C) velocity calculated from probed active layer thickness (ALT) and one way travel time, D) ALT calculated using constant and non-constant velocities (Jafarov et al., 2016 in review).
Mechanical probing
Mechanical probing was used roughly every kilometer to calibrate the GPR wave velocity used to convert the two way transit time to ALT. For each calibration probe we took the average of three probe measurements adjacent to the GPR antenna. In addition, a 100-m survey line was laid along segments of the GPR track and used a mechanical probe to make a single ALT measurement every meter. These high-density probe measurements were used to calibrate the average wave velocity and standard deviations at each study site. Uncertainty was estimated in GPR ALT due to soil water variability by propagating the standard deviation of wave velocity through the calculation of ALT from the transit time (Jafarov et al., 2016, in review; Schafer et al., 2015).
Soil volumetric water content (VWC)
VWC of the active layer soil was calculated at 3-8 calibration points per site where the probe measurement was exactly co-located with a GPR trace. The Engstrom et al.2005 empirical VWC model developed for active layer soils in Barrow was used for most calibration points. To get the most reliable results, only probe locations were used where a GPR trace was available. The one-way travel time was extracted from the raw GPR data for the traces where probe measurements were made within ~20 cm of the GPR antenna based on the recorded “GPR time” that provided the exact trace of interest. The 90% threshold was selected for the calculated VWC. Everything greater than the assigned threshold is associated with pure water and not included in the calibrated data set (Jafarov et al., 2016, in review).
Data Access
These data are available through the Oak Ridge National Laboratory (ORNL) Distributed Active Archive Center (DAAC).
Pre-ABoVE: Active Layer Thickness and Soil Water Content, Barrow, Alaska, 2013
Contact for Data Center Access Information:
- E-mail: uso@daac.ornl.gov
- Telephone: +1 (865) 241-3952
References
Jafarov, E. E., Parsekian, A. D., Schaefer, K., Liu, L., Chen, A. C., Panda, S. K. and Zhang, T. (2018), Estimating active layer thickness and volumetric water content from ground penetrating radar measurements in Barrow, Alaska. Geosci. Data J.. doi:10.1002/gdj3.49
Engstrom, R.; Hope, A.; Kwon, H.; Stow, D.; Zamolodchikov, D. Spatial distribution of near surface soil moisture and its relationship to microtopography in the Alaskan Arctic coastal plain. Nordic Hydrol. 2005, 36, 219–234.
Schaefer, K., L. Liu, A. Parsekian, E. Jafarov, A. Chen, T. Zhang, A. Gusmeroli, S. Panda, H.A. Zebker, and T. Schaefer. 2015. Remotely Sensed Active Layer Thickness (ReSALT) at Barrow, Alaska using Interferometric Synthetic Aperture Radar. Remote Sens. 2015, 7(4), 3735-3759; doi:10.3390/rs70403735