Get Data
NPP Tropical Forest: John Crow Ridge, Jamaica, 1974-1978
Summary:
This data set contains five NPP data files and three climate data files (ASCII .txt format). There is one NPP file for each of the five sub-types of upper montane tropical forest located along John Crow Ridge in the Blue Mountains of Jamaica. Biomass, productivity, tree mortality, standing crop of litter, LAI, and nutrient content of leaf fall were measured from 1974 to 1978. Long-term climate data are available from Cinchona Botanic Gardens, approximately 3 km south of the John Crow Ridge study area and at similar elevation.
The John Crow Ridge study areas (18.08 N 76.65 W) consist of 8 to 10 contiguous 10 m x 10 m permanent plots. The forests are of low stature and appear to be completely undisturbed. The forest floor at one sub-site (Mor Ridge) was overlain by a 30-50 cm layer of mor humus with a high C/N ratio.
ANPP was estimated to be between 654-997 g/m2/year (sum of litterfall and trunk/branch increment), or 854-1,057 g/m2/year (including tree mortality). These figures are lower than for lowland tropical forests with greater leaf turnover and reflect the relatively low stature of the upper montane forest plots. Above-ground biomass was estimated by both destructive methods and nondestructive regression analysis. Values ranged from 23,000 to 34,000 g/m2. Below-ground biomass (5,370 g/m2) was determined for one site by harvesting roots to a depth of 50 cm. LAI for trees plus understory, where measured, was 5.5-5.7 m2/m2.
Revision Notes:Only the documentation for this data set has been modified. The data files have been checked for accuracy and are identical to those originally published in 1999.
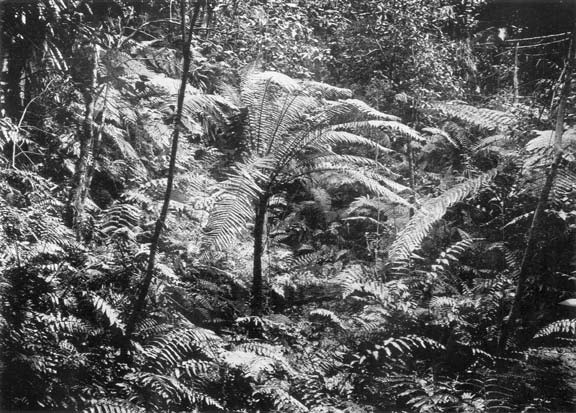
Figure 1. Tropical montane forest near Morce's Gap, close to the John Crow Ridge study site, Jamaica - as it appeared in the early 20th century. In the center is the tree-fern Cyathea pubescens; in the foreground Diplazium cenltidifolium and Diplazium altissimum. (Photograph taken about 1912 by Forrest Shreve. From Shreve, F., 1914. A Montane Rain Forest. Reproduced by kind permission of the Carnegie Institution of Washington). (JHN-1.jpg)
Additional Documentation:
The Net Primary Productivity (NPP) data collection contains field measurements of biomass, estimated NPP, and climate data for terrestrial grassland, tropical forest, boreal forest, and tundra sites worldwide. Data were compiled from the published literature for intensively studied and well-documented individual field sites and from a number of previously compiled multi-site, multi-biome data sets of georeferenced NPP estimates. The principal compilation effort (Olson et al., 2001) was sponsored by the NASA Terrestrial Ecology Program. For more information, please visit the NPP web site at http://daac.ornl.gov/NPP/npp_home.html.
Data Citation:
Cite this data set as follows:
Tanner, E.V.J., and P.J. Grubb. 2013. NPP Tropical Forest: John Crow Ridge, Jamaica, 1974-1978, R1. Data set. Available on-line [http://daac.ornl.gov] from Oak Ridge National Laboratory Distributed Active Archive Center, Oak Ridge, Tennessee, U.S.A. doi:10.3334/ORNLDAAC/475
This data set was originally published as:
Tanner, E.V.J., and P.J. Grubb. 1999. NPP Tropical
Forest: John Crow Ridge, Jamaica, 1974-1978. Data set. Available
on-line [http://daac.ornl.gov] from Oak Ridge National Laboratory
Distributed Active Archive Center, Oak Ridge, Tennessee, U.S.A.
Table of Contents:
- 1 Data Set Overview
- 2 Data Description
- 3 Applications and Derivation
- 4 Quality Assessment
- 5 Acquisition Materials and Methods
- 6 Data Access
- 7 References
1. Data Set Overview:
Project: Net Primary Productivity (NPP)
The above-ground net primary productivity (ANPP) measurements presented here are the sum of total litterfall and wood production for five contrasting upper montane tropical forests located along John Crow Ridge in the Blue Mountains of Jamaica. Mortality was also estimated for some of the sub-sites.
The John Crow Ridge study area (18.08 N 76.65 W) is located on the Grand Ridge of the western Blue Mountains, between Morce's Gap and John Crow Peak. Each sub-site consists of 8 or 10 contiguous permanent plots, each 10 m x 10 m. The forest is of low stature, and appeared to be completely undisturbed at the commencement of the study. The forest floor at one sub-site (Mor Ridge) was overlain by a 30-50 cm layer of mor humus with a high C/N ratio.
Biomass and productivity were determined for the five forests from 1974 to 1978. These measurements formed part of a study of nutrient cycling carried out in collaboration with the University of the West Indies. More recent studies have covered regrowth after hurricane damage and regeneration on landslides.
ANPP was estimated to be in the range of 654 (Mull Ridge) to 997 g/m2/year (Gap Forest) based on the sum of litterfall and trunk/branch increment. When tree mortality is added, ANPP ranges from 854 (Mull Ridge) to 1,057 g/m2/year (Gap Forest). These figures are lower than for lowland tropical forests, with a greater proportion accounted for by leaf turnover. This is reflected by the relatively low stature of the upper montane forest.
Estimates of ANPP, BNPP, and TNPP reported in Scurlock and Olson (2012), Olson et al. (2012a, b), and Clark et al. (2001a, b) differ from the values reported herein because they are derived from different calculation methods (Table 1).
Table 1. ANPP, BNPP, and TNPP values reported by various published data sources
| File Name or Description | Data Source(s) | Sub-Site | ANPP | BNPP | TNPP |
|---|---|---|---|---|---|
| gC/m2/year | |||||
| jhn1_npp.txt | Tanner (1980)1
|
jhn1 jhn Morridge |
345 | NA | NA |
| jhn2_npp.txt | jhn2 jhn Mulridge
|
327 | NA | NA |
340 | NA | NA |
| jhn3_npp.txt | jhn3 jhn Wetslope |
378 | NA | NA |
|
| jhn4_npp.txt | jhn4 jhn Gap |
499 | NA | NA |
|
| jhn5_npp.txt | jhn5 jhn WDMulridge (Well-developed Mull Ridge)2 |
265 | NA | NA |
|
NPP_Multibiome_EnvReview | Scurlock and Olson (2012) based on Tanner (1980)3 |
jhn (average of the three sub-sites Mull Ridge, Wet Slope & Gap Forest) |
494 | NA | NA |
ods_xls.csv | Esser (1998) based on Tanner (1980)1 |
1285 (Mor Ridge) |
345 | NA | NA |
1284 (Mull Ridge) |
325 | NA | NA |
||
1282 (Wet Slope) |
380 | NA | NA |
||
1286 (Gap Forest) |
495 | NA | NA |
||
1283 (Mull Ridge) |
340 | NA | NA |
||
| GPPDI_ClassB_NPP_2363_R2.csv | Olson et al. (2012a) from Esser (1998) based on Tanner (1980)3 |
Class B 117 (MI 206) (Mor Ridge) |
330 | NA | NA |
Class B 117 (MI 205) (Mull Ridge) |
310 | NA | NA |
||
Class B 117 (MI 204) (Wet Slope) |
360 | NA | NA |
||
Class B 117 (MI 207) (Gap Forest) |
470 | NA | NA |
||
| GPPDI_ClassB_NPP_2363_R2.csv | Olson et al. (2012a) based on ORNL |
Class B 117 (MI 209) (Mor Ridge) |
270 | 190 | 470 |
Class B 117 (MI 208) (Mull Ridge) |
240 | 170 | 410 |
||
Class B 117 (MI 210) (Gap Forest) |
270 | 190 | 450 |
||
Olson et al. (2012a) based on Tanner (1980) |
Class B 117 (MI 211) (average of the three sub-sites Mull Ridge, Wet Slope & Gap Forest) |
450 | NA | NA |
|
| EMDI_ClassB_NPP_933_v2.csv | Olson et al. (2012b) based on Esser (1998)3 |
Class B 117 (average of the three sub-sites Mull Ridge, Wet Slope & Gap Forest) |
460 | NA | NA |
| Table 1 in Clark et al. (2001a) | Clark et al. (2001a)4 |
Blue Mtn. Mor Ridge |
580 | 120-690 (av 405) | 690-1,270 (av 980) |
Blue Mtn. Mull Ridge |
500 | 100-600 (av 350) | 600-1,100 (av 850) |
||
Blue Mtn. Wet Slope |
500 | 100-600 (av 350) | 600-1,100 (av 850) |
||
Blue Mtn. Gap Forest |
560 | 110-670 (av 390) | 670-1,240 (av 955) |
||
| Appendix A in Clark et al. (2001a) | Clark et al. (2001a) based on Tanner (1980)5 |
Blue Mtn. #2 (Mor Ridge) |
350 | NA | NA |
Blue Mtn. #3 (Mull Ridge) |
330 | NA | NA |
||
Blue Mtn. #4 (Wet Slope) |
280 | NA | NA |
||
Blue Mtn. #1 (Gap Forest) |
490 | NA | NA |
||
| Appendix A in Clark et al. (2001a) | Clark et al. (2001a)4 |
Blue Mtn. #2 (Mor Ridge) |
NA | NA |
690-1,270 (av 980) |
Blue Mtn. #3 (Mull Ridge) |
NA | NA |
600-1,100 (av 850) |
||
Blue Mtn. #4 (Wet Slope) |
NA | NA |
600-1,100 (av 850) |
||
Blue Mtn. #1 (Gap Forest) |
NA | NA |
670-1,240 (av 955) |
||
| tropfornpp.csv | Clark et al. (2001b)6 based on Tanner (1977; 1980a, b; 1985) |
Jamaica - Blue Mtn. Mor Ridge |
356 | NA | NA |
Jamaica - Blue Mtn. Mull Ridge |
334 | NA | NA |
||
Jamaica - Blue Mtn. Wet Slope |
378 | NA | NA |
||
Jamaica - Blue Mtn. Gap Forest |
499 | NA | NA |
||
Notes: NA = Not available. MI = Measurement ID number. The differences in NPP values reported in this table are mainly due to differences in calculation methods, as explained in these notes. Please consult original references for details. Revised data sets (R1, R2, etc) are accompanied by ORNL DAAC Data Set Change Information files. Please see the corresponding documentation for reasons why the data values were revised. 1For this table, NPP data from the original data source were converted from grams of dry weight per meter square per year to grams of carbon per meter square per year using a conversion factor of 0.5. The ANPP estimate is based on field measurement of total litterfall accumulation + trunk and branch biomass increment, giving a minimum estimate of NPP. 2Based on litterfall accumulation only. 3Based on field measurement of total litterfall accumulation + trunk and branch biomass increment + mortality. Note that ANPP estimates reported in the individual site data files do not include mortality. 4Clark et al. (2001a) used a different approach to calculate net primary production values. ANPP was calculated by summing reported above-ground biomass increment + reported fine litterfall + estimated losses to consumers + estimated VOC emissions. BNPP was calculated by summing 0.2 x estimated ANPP for a low BNPP estimate + 1.2 x estimated ANPP for a high BNPP estimate. TNPP was calculated as the range between the low and high values of ANPP + BNPP. Average BNPP and TNPP estimates were also calculated. See Clark et al. (2001a) for a discussion of calculation methods, including how unmeasured components of ANPP were estimated and the basis for setting bounds on BNPP. 5Clark et al. (2001a) converted NPP data from the original data source from grams of dry weight per meter square per year to grams of carbon per meter square per year using a conversion factor of 0.475. 6The Clark et al. (2001b) ANPP estimate is based on field measurement of total litterfall accumulation + trunk and branch biomass increment. In this table, NPP data from Clark et al. (2001b) were converted from megagrams of dry weight per hectare per year to grams of carbon per meter square per year using a carbon conversion factor of 0.5.
2. Data Description:
Spatial Coverage
Site: John Crow Ridge, Jamaica
Site Boundaries: (All latitude and longitude given in decimal degrees)
| Site (Region) | Westernmost Longitude | Easternmost Longitude | Northernmost Latitude | Southernmost Latitude | Elevation (m) |
|---|---|---|---|---|---|
| John Crow Ridge, Jamaica | -76.65 | -76.65 | 18.08 | 18.08 | 1,530-1,615 |
Site Information
The study area consists of five sub-sites located at c. 1,530-1,615 m elevation on a ridge between John Crow Peak and Morce's Gap in the Blue Mountains of Jamaica (Figure 2). The five sub-sites represent the five forest types listed in Table 2. The whole forest along the ridge studied was either completely undisturbed or had not been disturbed for many years. The trees in all the forest types are relatively small; there is a gradation in canopy height from 5-7 m in the Mor Ridge forest to 8-13 m in the Mull Ridge and Wet Slope forests, and to 12-16 m in the Gap Forest.
The Jamaican forest types are different from lowland and well-developed lower montane rainforests in that the scale of the regeneration pattern in the forests is smaller. The Mor Ridge, Mull Ridge and Wet Slope forests are typical of upper montane rainforests in not having tree-falls that cause large gaps and give rise to a large-scale mosaic in the forest. When trees die, they either fall but cause little damage because they are small or of similar size to surrounding trees and not linked to other trees by lianas, or the trees disintegrate over a number of years in situ. The Gap Forest is different in that it does have a more noticeable regeneration pattern due to larger trees which cause gaps when they fall. In this respect, the Gap Forest is more like a typical lower montane rainforest.
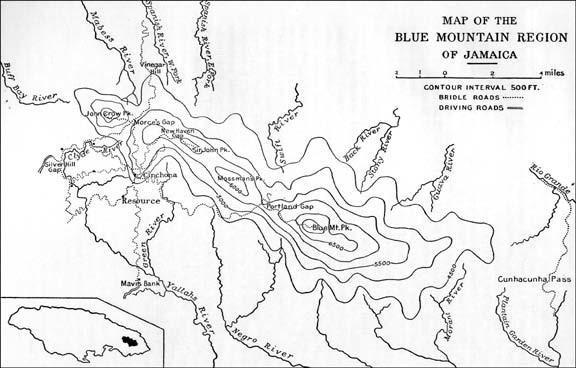
Figure 2. Map showing location of the John Crow Ridge tropical forest study site, at the western end of the Blue Mountains, between John Crow Peak and Morce's Gap. (Map from Shreve, F., 1914. A Montane Rain Forest. Reproduced by kind permission of the Carnegie Institution of Washington). (JHN-2.jpg)
Table 2. John Crow Ridge Sub-Sites
| Sub-Sites | Elevation (m) | Mean Annual Precipitation (mm) | Forest Association |
|---|---|---|---|
| Mor Ridge | 1,615 | 2,230 | Chaetocarpus globosus - Clusia cf. havetioides - Lyonia cf. octandra association |
| Mull Ridge | 1,600 | 2,230 | Dendropanax pendulus - Hedyosmum arborescens - Podocarpus urbanii association |
| Wet Slope | 1,555-1,590 | 2,230 | Dendropanax pendulus - Hedyosmum arborescens - Podocarpus urbanii association |
| Gap Forest | 1,590 | 2,230 | Cyathea pubescens - Meriania purpurea - Solanum punctulatum association |
| Well-developed Mull Ridge | 1,530 | 2,230 | Cyrilla racemiflora - Clethra occidentalis (dominant species) |
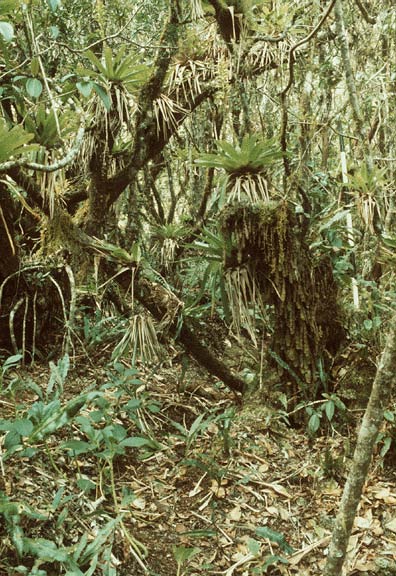
Figure 3. Mor Ridge sub-site at the John Crow Ridge tropical forest site, Jamaica. (Leaning tree in foreground is Clusia cf. havetioides; bromeliads are Tillandsia complanata and Vriesia sintenisii; herbs at ground level are Elaphoglossum latifolium and Peperomia clusiifolia. Photograph taken February 1975 by Dr. E. V. J. Tanner, Cambridge University, UK). (JHN-3.jpg)
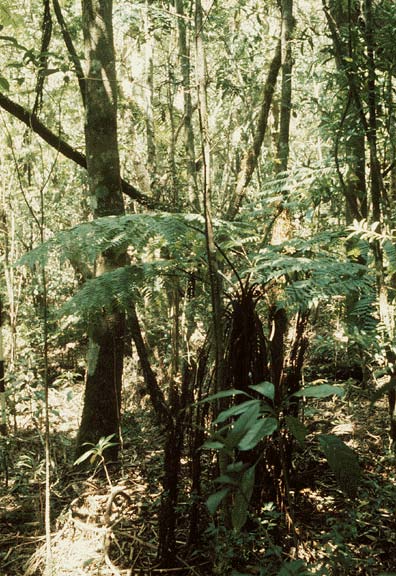
Figure 4. Mull Ridge sub-site at the John Crow Ridge tropical forest site, Jamaica. (Species include Clethra occidentalis, which has contributed most of the fresh litter; Hedyosmum arborescens and Podocarpous urbanii. Photograph taken February 1975 by Dr. E. V. J. Tanner, Cambridge University, UK). (JHN-4.jpg)
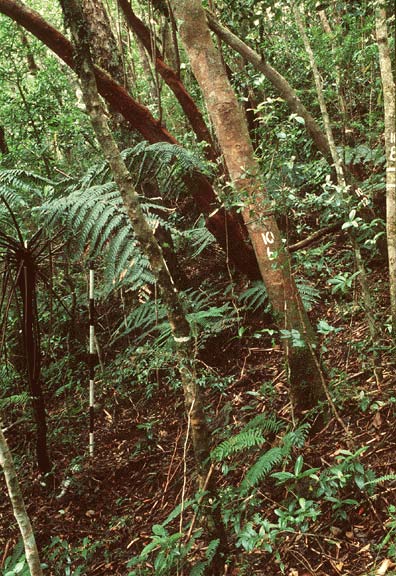
Figure 5. Wet Slope sub-site at the John Crow Ridge tropical forest site, Jamaica. (Species include Clethra occidentalis, Hedyosmum arborescens, Cyrilla racemiflora and Cyathea pubescens, which was always short-stemmed on the Wet Slope. Photograph taken February 1975 by Dr. E. V. J. Tanner, Cambridge University, UK). (JHN-5.jpg)
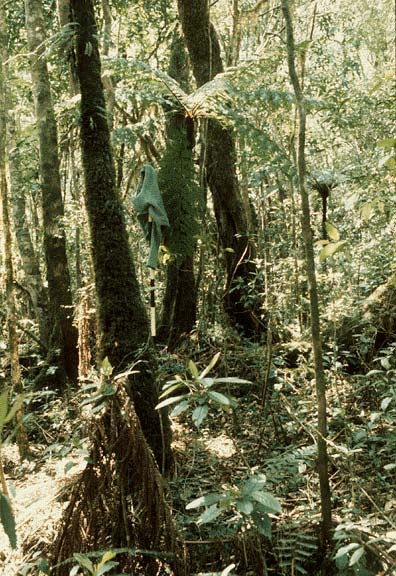
Figure 6. Gap Forest sub-site at the John Crow Ridge tropical forest site, Jamaica. (Species include Cyathea pubescens, Cyathea furfuracea and Hedyosmum arborescens. Photograph taken February 1975 by Dr. E. V. J. Tanner, Cambridge University, UK). (JHN-6.jpg)
Spatial Resolution
The forest plots for biomass estimation by destructive methods at Mor Ridge and well-developed Mull Ridge sites were 10 x 10 m in size. Herbs were harvested from 2 m2 sub-plots at Mor Ridge and from 1 m2 sub-plots at well-developed Mull Ridge. Tree seedlings and saplings were harvested from 1 m2 sub-plots at both sites. The distribution of seedlings and saplings in 100 sub-plots of 1 m2 was recorded in one plot of 10 x 10 m at the Mor Ridge forest before harvest. Roots were excavated from pits 3.5 x 5 m in size to a depth of 50 cm at the Mor Ridge site. Above-ground biomass wa s estimated by regression analysis at the other three sites. Litter traps at all five sub-sites were 1 m2 in size. Large material (branches and tree fern leaves) was collected separately. The sample area for estimating the standing crop of leaf litter at the sub-sites was 281 cm2.
Temporal Coverage
Forest vegetation species were inventoried and measured at the Mor Ridge site in January and February 1974. Above- and below-ground biomass was measured by destructive harvest at the Mor Ridge site in January 1975. Above-ground biomass was harvested at the well-developed Mull Ridge site in September 1977; roots were not sampled. Element concentrations in leaves were analyzed from samples taken from Mor Ridge in 1975 and 1976. LAI measurements were made at Mor Ridge in January 1975 and at the well-developed Mull Ridge site in September 1977. Standing crop of leaf litter was measured on three occasions in 1974 at the Mor Ridge, Mull Ridge, Wet Slope, and Gap Forest sites: February 20, July 5, and November 23. Litterfall was measured from March 7, 1974 to March 7, 1975 at these same sites, and again from April 17, 1977 to April 17, 1978 at the Mull Ridge site. Litterfall was measured at the well-developed Mull Ridge site in 1976-77. Changes in tree biomass were measured from February 1974 to April 1978 at the Mor Ridge, Mull Ridge, Wet Slope, and Gap Forest sites. Tree mortality was recorded in 1977-78 at Mull Ridge, Wet Slope, and Gap Forest sites, three to four years after the biomass enumeration surveys at these sites. Temperature, rainfall, throughfall, relative humidity, litterfall and water content of the trapped litter were studied at the sites for varying lengths of time.
Long term climate data are available from the weather station at Cinchona Botanic Gardens near John Crow Ridge, Jamaica for four different periods: 1871-1909 (mean monthly and annual precipitation); 1891-1905 (mean monthly and annual maximum/minimum temperature); 1951-1980 (mean monthly and annual precipitation and maximum/minimum temperature); and 1901-1983 (monthly and annual precipitation).
Temporal Resolution
Biomass and LAI measurements were made once. Litter on the forest floor was collected on three occasions, 4-5 months apart. Litterfall was collected approximately every 2 weeks (1974-1975) and monthly (1977-1978). Dendrometer readings were made intermittently over the 1974-78 period. All NPP estimates are based on plant dry matter accumulation, expressed as g/m2 (dry matter weight).
Climate data are expressed as monthly and annual precipitation amounts (mm) and monthly and annual average maximum/minimum temperature (C). Monthly and annual climatic means are also provided.
Data File Information
Table 3. Data files in this data set archive
FILE NAME |
FILE SIZE |
TEMPORAL COVERAGE | FILE CONTENTS |
jhn1_npp.txt |
5.0 KB |
1974/02/20-1975/03/07 | Biomass, litterfall, LAI, and ANPP data for Mor Ridge site at at John Crow Ridge, Jamaica |
jhn2_npp.txt |
5.1 KB |
1974/02/20-1978/04/17 | Biomass, litterfall, tree mortality, and ANPP data for Mull Ridge site at at John Crow Ridge, Jamaica |
jhn3_npp.txt |
3.8 KB |
1974/02/20-1975/03/07 | Biomass, litterfall, tree mortality, and ANPP data for Wet Slope site at at John Crow Ridge, Jamaica |
jhn4_npp.txt |
3.7 KB |
1974/02/20-1975/03/07 | Biomass, litterfall, tree mortality, and ANPP data for Gap Forest site at at John Crow Ridge, Jamaica |
jhn5_npp.txt |
1.8 KB |
1976/01/01-1977/12/31 | Biomass, litterfall, and ANPP data for Well-developed Mull Ridge site at at John Crow Ridge, Jamaica |
jhn1_cli.txt |
4 KB
|
1891/01/01-1905/12/31 | Mean (based on all years) monthly and annual maximum/minimum temperature data from weather station at Cinchona Botanic Gardens near John Crow Ridge, Jamaica |
| 1871/01/01-1909/12/31 | Mean (based on all years) monthly and annual precipitation data from weather station at Cinchona Botanic Gardens near John Crow Ridge, Jamaica |
||
jhn2_cli.txt |
4 KB |
1951/01/01-1980/12/31 | Mean (based on all years) monthly and annual precipitation and maximum/minimum temperature data from weather station at Cinchona Botanic Gardens near John Crow Ridge, Jamaica |
jhn3_cli.txt |
12 KB |
1901/01/01-1983/03/31 | Mean monthly and annual precipitation data from weather station at Cinchona Botanic Gardens near John Crow Ridge, Jamaica |
NPP Data. NPP estimates for the John Crow Ridge site are provided in five files, one for each study site (Table 3). The data sets are ASCII files (.txt format). The variable values are delimited by semi-colons. The first 18 lines are metadata; data records begin on line 19. The value -999.9 is used to denote missing values. Biomass and NPP units are in g/m2 and g/m2/year (dry matter weight), respectively.
Table 4. Column headings in NPP files
COLUMN HEADINGS |
DEFINITION |
UNITS |
Site |
Site where data were gathered (code refers to site identification) | Text |
Treatmt |
Study area or forest subsystem type where measurements were made | Text |
Year |
Year in which data were collected | Numeric |
Month |
Month in which data were collected | |
Day |
Day on which data were collected | |
parameter |
Parameters measured (see definitions in Table 4) | Text |
amount |
Data values | Numeric |
| units | Unit of measure | Text |
| Comments | Explanatory comments | Text |
Table 5. Parameter definitions in NPP files
PARAMETER |
DEFINITION |
UNITS |
SOURCE |
height |
Forest canopy height | m |
Table 11 |
litter |
Leaf litter standing crop at different times of the year | g/m2 |
Table 32 |
leaves |
Total tree leaf biomass | g/m2 |
Tables 1 & 21 |
trunks+branches |
Tree trunk and branch biomass | g/m2 |
Table 21 |
climbers+epiphytes |
Biomass of bromeliads, hemi-parasites, and other epiphytes | ||
Undstory |
Sum of seedlings and sapling biomass + tree fern biomass + herb biomass | ||
AGbiomass |
Total above-ground biomass | g/m2 |
by addition |
Stdead |
Biomass of standing dead branches and trees | g/m2 |
Table 21 |
branchlitter |
Biomass of dead wood on the ground | ||
roots<2cm |
Biomass of roots < 2 cm diameter | ||
roots2-10cm |
Biomass of roots 2-10 cm diameter | ||
roots>10cm |
Biomass of roots > 10 cm diameter | ||
Totroots |
Total root biomass | ||
LAI_trees |
Leaf area index for trees | m2/m2 |
p. 583, Tanner (1980a) |
LAI_other |
Leaf area index for bromeliads + tree saplings and seedlings + herbs | ||
LAI |
Total leaf area index | by addition |
|
leaflittfall |
Litterfall biomass of leaves and other material (mainly leaves) | g/m2/year |
Table 23 |
woodlittfall |
Litterfall biomass of woody material | ||
otherlittfall |
Litterfall biomass of epiphytic material (mainly bromeliads) | ||
Totlittfall |
Total litterfall biomass | ||
trunk+branch_incr |
Estimate of wood production | g/m2/year |
Table 63 |
ANPP |
Above-ground net primary production (sum of total litterfall + wood production) | g/m2/year |
Table 63 |
mortality |
Loss of live above-ground biomass due to trunk deaths | g/m2/year |
p. 584, Tanner (1980a) |
litterfall |
Mean litterfall in the four forest sites at each collection (1974-1975) | g/m2 | Appendix 13 |
litterfall |
Mean litterfall in the Mull Ridge site at each collection (1977-1978) | g/m2 |
Appendix 13 |
leaves-N |
Mean foliar concentration of nitrogen in leaves | percent |
Table 164 |
leaves-P |
Mean foliar concentration of phosphorus in leaves | ||
leaves-K |
Mean foliar concentration of potassium in leaves |
Notes: Some of the data files do not contain all of the parameters listed in this table. 1Tanner (1980a). 2Tanner (1981). 3Tanner (1980b). 4Tanner (1977).
Sample NPP Data Record <jhn1_npp.txt>
Site; Treatmt; Year; Month; Day; parameter; amount; units; Comments jhn; Morridge; 1974-75; -999.9; -999.9; height; 5-8; m jhn; Morridge; 1974; 2; 20; litter; 1010; g/m2 jhn; Morridge; 1975; 1; -999.9; leaves; 790; g/m2 |
Sample NPP Data Record <jhn2_npp.txt>
Site; Treatmt; Year; Month; Day; parameter; amount; units jhn; Mulridge; 1974-75; -999.9; -999.9; height; 8-13; m jhn; Mulridge; 1974; 2; 20; litter; 1070; g/m2 jhn; Mulridge; 1974-75; -999.9; -999.9; leaflittfall; 532; g/m2/year |
Sample NPP Data Record <jhn3_npp.txt>
Site; Treatmt; Year; Month; Day; parameter; amount; units jhn; Wetslope; 1974-75; -999.9; -999.9; height; 8-13; m jhn; Wetslope; 1974; 2; 20; litter; 1200; g/m2 jhn; Wetslope; 1974-75; -999.9; -999.9; leaflittfall; 436; g/m2/year |
Sample NPP Data Record <jhn4_npp.txt>
Site; Treatmt; Year; Month; Day; parameter; amount; units jhn; Gap; 1974-75; -999.9; -999.9; height; 12-16; m jhn; Gap; 1974; 2; 20; litter; 700; g/m2 jhn; Gap; 1974-75; -999.9; -999.9; leaflittfall; 550; g/m2/year |
Sample NPP Data Record <jhn5_npp.txt>
Site; Treatmt; Year; Month; Day; parameter; amount; units; Comments jhn; WDMulrdg; 1976-77; -999.9; -999.9; height; 15?; m jhn; WDMulrdg; 1977; 9; -999.9; leaves; 640; g/m2 |
Climate Data. The climate data for John Crow ridge are provided in three ASCII files (.txt format). The first 18 lines are metadata; data records begin on line 19. The variable values are delimited by semi-colons. The value -999.9 is used to denote missing values.
Sample Climate Data Record <jhn1_cli.txt>
Site;Temp;Parm; Jan; Feb; Mar; Apr; May; Jun; Jul; Aug; Sep; Oct; Nov; Dec; Year jhn ;mean;prec; 179.8; 101.9; 132.8; 156.5; 271.3; 206.0; 96.5; 204.2; 247.1; 454.9; 363.0; 270.8; 2684.8 Where, |
Sample Climate Data Record <jhn2_cli.txt>
Site;Temp;Parm; Jan; Feb; Mar; Apr; May; Jun; Jul; Aug; Sep; Oct; Nov; Dec; Year jhn ;mean;prec; 126; 116; 103; 172; 219; 141; 79; 179; 226; 343; 396; 235; 2335 Where, |
Sample Climate Data Record <jhn3_cli.txt>
Site;Temp;Parm; Jan; Feb; Mar; Apr; May; Jun; Jul; Aug; Sep; Oct; Nov; Dec; Year jhn ;mean;prec; 138.8; 116.0; 91.7; 134.5; 214.8; 156.3; 82.1; 187.9; 227.5; 363.8; 429.6; 224.4; 2366.3 Where, |
3. Data Application and Derivation:
Tanner (1977; 1980a, b; and 1981) investigated the controlling factors which produce forests that are relatively poor in species composition and low in stature on mountains in the tropics. In particular, he wanted to find out why such low-stature forests occur at lower altitudes and in compressed vegetation zones on small tropical wet mountains (compared to large tropical wet mountains) -- the tropical Massenerhebung effect of Richards (1952) and Grubb (1974).
The tropical forest biomass dynamics data for the John Crow Ridge sites are provided for comparison with models and estimation of NPP. Climate data are provided for use in driving ecosystem/NPP models.
4. Quality Assessment:
Comparisons of the five Jamaican montane forest types were made by Tanner (1977; 1980a, b; and 1981) with forests elsewhere in the tropics. Tanner's studies considered various aspects of the forests, including above- and below-ground biomass, litterfall, leaf structure and mineral content, litter on the forest floor, wood production, and tree mortality.
Sources of Error
Information not available.
5. Data Acquisition Materials and Methods:
Forest Structure. In January-February 1974, eight contiguous plots of 10 x 10 m in two rows were marked out at the Mor Ridge forest site, and ten such plots were established at each of the other sites (Mull Ridge, Wet Slope and Gap Forest). All stems > 10 cm dbh were measured and the species recorded. Tree-ferns were measured in the same way as angiosperm trees. The distribution of seedlings and saplings in 100 sub-plots of 1 m2 was recorded in one plot of 10 x 10 m in the Mor Ridge forest.
Biomass. In January 1975 one square plot, 10 x 10 m in size, at the Mor Ridge site was selected for biomass estimation from the eight Mor Ridge forest plots. All herbs (mainly Elaphoglossum latifolium and Peperomia clusiifolia) were removed and weighed separately for each 2 m2 sub-plot. Tree seedlings and saplings (< 10 cm dbh) in each 1 m2 were classified into those < 1 m tall and those > 1 m tall; both classes were removed and weighed. The trees ( > 10 cm dbh) that branched below breast height (1.3 m) were treated as separate trees, and those that branched between ground level and 1.3 m were harvested as one tree. Trees were cut and weighed after dividing the above-ground part into trunk, branches, leafy twigs, bromeliads, hemi-parasites, and other epiphytes.
Roots were dug from a rectangular area 3.5 x 5.0 m in size to a depth of 50 cm, and weighed in three diameter size-classes: < 2 cm; 2-10 cm; and > 10 cm. All material was weighed fresh in the forest, and samples were taken of every category of every individual to determine dry-weight conversion factors.
In order to obtain an indication as to whether the regression for the Mor Ridge forest could be applied to the other forest-types, two trees in the Gap Forest site (including one of the largest trees at the site) and four in the Mull Ridge forest site, or close to it, were felled and weighed.
In September 1977, a 10 x 10 m plot was established at the well-developed Mull Ridge forest for biomass estimation, on the basis of being near the mean for total basal area for the original Mull Ridge forest plots. Herbs were uncommon in this plot (a feature typical of Mull Ridge, Wet Slope and Gap Forest sites); those present (mainly the orchids Erythrodes plantaginea and Prescottia stachyodes, and the fern Polypodium loreum) were removed and weighed separately for each 1 m2 sub-plot. Tree seedlings and saplings (< 10 cm dbh) were divided into three categories: < 1 m tall; > 1 m tall but < 2.5 m tall; and those > 2.5 m tall. Seedlings and saplings were removed from 1 m2 sub-plots and weighed. The trees ( > 10 cm dbh) were harvested. Roots were not sampled. Climbers were divided into woody axes and leafy shoots before being weighed and subsampled. All material was weighed fresh in the forest. Subsamples were taken of every category of every individual to determine dry-weight conversion factors
LAI. Specific leaf area was measured for all the trees, bromeliads, saplings and seedlings, and ground vegetation harvested and sampled at Mor Ridge and well-developed Mull Ridge sites. Leaves were wetted for c. 24 h before pressing them flat and determining their area by a Lambda leaf-area meter, model LI-3000.
Changes in the Biomass. In February 1974, dendrometers were fitted at a height of 1.3 m on 69 trees scattered through the Mor Ridge, Mull Ridge, Wet Slope and Gap Forest sites. The dendrometers, accurate to 0.1 mm diameter, were read intermittently until April 1978. The biomass increment (from basal area and regression equations) was calculated for each tree. The mean for the trees in each forest-site (18 in Mor Ridge forest; 19 in Mull Ridge forest; 10 in Wet Slope forest, and 13 in Gap Forest) was used to calculate the increment for each forest site.
Mortality. Twenty-three of the plots enumerated in 1974 at Mull Ridge, Wet Slope, and Gap Forest sites were re-checked in 1977-78, and the trunks which had died were recorded.
Litterfall. Litterfall was measured for the 12-month period 7 March 1974 to 7 March 1975 in the Mor Ridge, Mull Ridge, Wet Slope, and Gap Forest sites, and again from 17 April 1977 to 17 April 1978 in the Mull Ridge site.
- 1974-1975. Litterfall was studied at two plots at each site chosen because their basal area (and therefore biomass) was similar to the mean basal area for their forest site. Ten 1 m2 litter traps were placed at random in each forest-type. Each trap was made of 2-mm-mesh nylon, suspended from galvanized wire supported by four bamboo poles at a height of 50 cm, and allowed to droop to a depth of c. 25 cm; each was weighted with a piece of wood to prevent it blowing inside out. Litter was collected from the traps into self-seal polythene bags approximately every 2 weeks; large material (branches and tree fern leaves) was collected separately. The litter was taken to Kingston to be fresh weighed, and then dried at c. 60 C and reweighed. All litter collected in this way was brought to Cambridge, England, where a correction factor for drying at 100 C was determined on sixteen samples. The litter from three collections (those of 19 March 1974, 8 August 1974, and 7 March 1975) was bulked into twelve samples, one per site per collection. Each of these twelve samples was sorted into woody material, epiphytic material and other material (mainly leaves). Mean results for the composition of these collections were used as an estimate of the composition of all other litter collected, except the collection of 8 September 1974. This was sorted separately because it was largely the result of a hurricane which passed near the island during the preceding collection period; due to the high winds, woody and epiphytic material were present in greater proportions than usual.
- 1977-1978. Litterfall was studied in ten enumerated plots in the Mull Ridge forest site. Thirty-eight litter traps, made of 2-mm-mesh nylon supported by an equilateral triangular frame of spring steel, of side 76 cm (area 0.29 m2), c. 50 cm off the ground at the edges and c. 25 cm deep, were set up on a stratified-random basis. Litter was collected from the traps into self-seal polythene bags approximately every month; it was taken to Kingston where it was fresh weighed, dried at 100 C and reweighed.
Standing Crop of Leaf Litter. The standing crop was determined in 1974 on 20 February, 5 July and 23 November. Ten random samples (each 281 cm2) were collected from each site on each occasion. All woody material was removed from the samples at the time of collection; the remainder of the sample is considered to be the standing crop of leaf litter.
Foliar Analyses. Element concentrations in tree leaves from the Mor Ridge, Mull Ridge, Wet Slope, and Gap Forest sites were analyzed using standard laboratory methods described in Tanner (1977).
Climate. Long term climate was monitored at the Cinchona Botanic Gardens, approximately 3 km south of the John Crow Ridge study area and at similar elevation (1,525 m).
Soil Profiles. Methods are described in Tanner (1977). Data are not included in this data set.
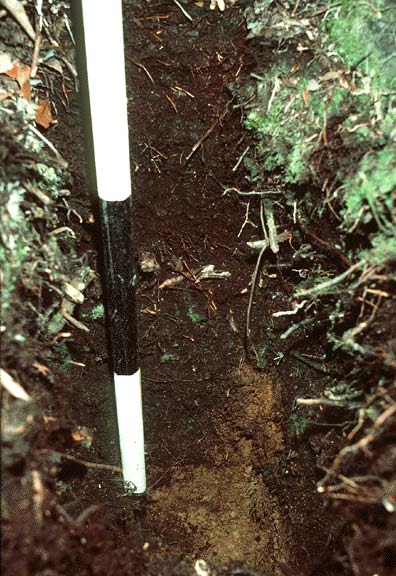
Figure 7. Soil profile at the Mor Ridge sub-site, John Crow Ridge tropical forest site, Jamaica. (Note 40-50 cm of mor humus ['duff' in USA]. Scale pole divisions are 12 inches [305 mm]. Photograph taken February 1975 by Dr. E. V. J. Tanner, Cambridge University, UK). (JHN-7.jpg)
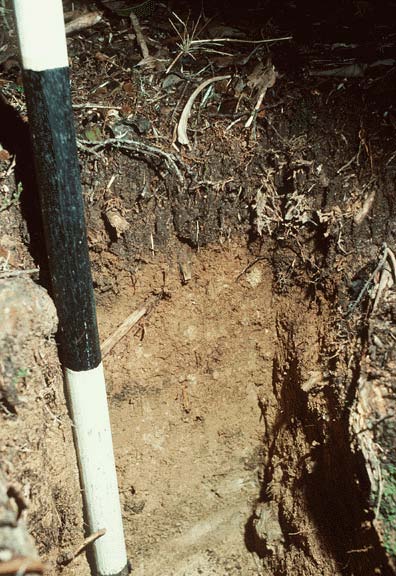
Figure 8. Soil profile at the Mull Ridge sub-site, John Crow Ridge tropical forest site, Jamaica. (Scale pole divisions are 12 inches [305 mm]. Photograph taken February 1975 by Dr. E. V. J. Tanner, Cambridge University, UK). (JHN-8.jpg)
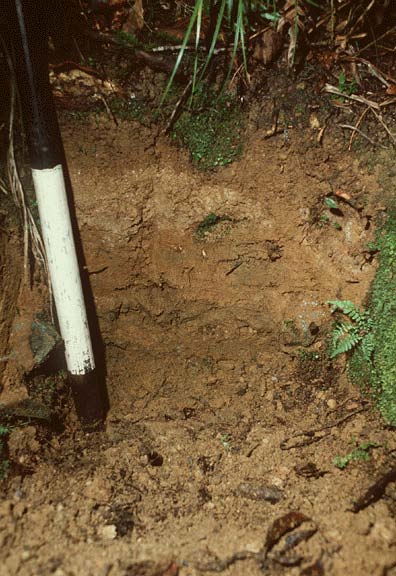
Figure 9. Soil profile at the Wet Slope sub-site, John Crow Ridge tropical forest site, Jamaica. (Note that weathering rock fragments at about 30 cm depth prevent further penetration with a spade. Scale pole divisions are 12 inches [305 mm]. Photograph taken February 1975 by Dr. E. V. J. Tanner, Cambridge University, UK). (JHN-9.jpg)
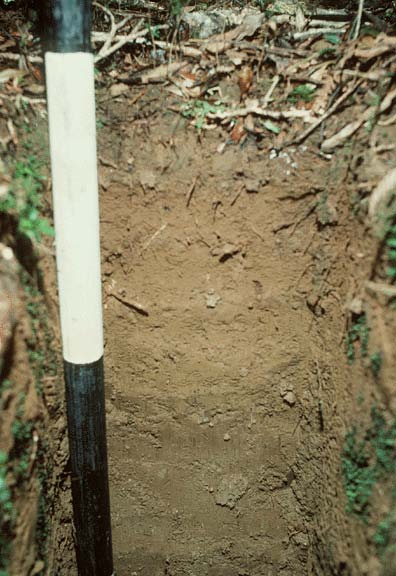
Figure 10. Soil profile at the Gap Forest sub-site, John Crow Ridge tropical forest site, Jamaica. (In the upper part of the profile, note the absence of mor humus, and relatively little dark brown staining by mull humus, compared to Mor Ridge soil and Mull ridge soil, respectively. This is despite the fact that total litterfall rates are rather similar at all three sub-sites [661 g/m2/yr Mor; 554-580 g/m2/yr Mull; 647 g/m2/yr Gap Forest]. Scale pole divisions are 12 inches [305 mm]. Photograph taken February 1975 by Dr. E .V. J. Tanner, Cambridge University, UK). (JHN-10.jpg)
6. Data Access:
This data set is available through the Oak Ridge National Laboratory (ORNL) Distributed Active Archive Center (DAAC).
Data Archive:
Web Site: http://daac.ornl.gov
Contact for Data Center Access Information:
E-mail: uso@daac.ornl.gov
Telephone: +1 (865) 241-3952
7. References:
Olson, R.J., K.R. Johnson, D.L. Zheng, and J.M.O. Scurlock. 2001. Global and Regional Ecosystem Modeling: Databases of Model Drivers and Validation Measurements. ORNL Technical Memorandum TM-2001/196. Oak Ridge National Laboratory, Oak Ridge, Tennessee, U.S.A.
Tanner, E.V.J. 1977. Four montane rain forests of Jamaica: a quantitative characterization of the floristics, the soils and the foliar mineral levels, and a discussion of the interrelations. Journal of Ecology 65: 883-918.
Tanner, E.V.J. 1980a. Studies on the biomass and productivity in a series of montane rain forests of Jamaica. Journal of Ecology 68: 573-588.
Tanner, E.V.J. 1980b. Litterfall in montane rain forests of Jamaica and its relation to climate. Journal of Ecology 68: 833-848.
Tanner, E.V.J. 1981. The decomposition of leaf litter in Jamaican montane rain forests. Journal of Ecology 69: 263-275.
Additional Sources of Information:
Clark, D.A., S. Brown, D.W. Kicklighter, J Q. Chambers, J R. Thomlinson, J. Ni, and E. A. Holland. 2001a. Net primary production in tropical forests: an evaluation and synthesis of existing field data. Ecological Applications, 11(2): 371-384.
Clark, D.A., S. Brown, D.W. Kicklighter, J.Q. Chambers, J.R. Thomlinson, J. Ni, and E.A. Holland. 2001b. NPP Tropical Forest: Consistent Worldwide Site Estimates, 1967-1999. Data set. Available on-line [http://daac.ornl.gov] from the Oak Ridge National Laboratory Distributed Active Archive Center, Oak Ridge, Tennessee, U.S.A. doi:10.3334/ORNLDAAC/616
Esser, G. 1998. NPP Multi-Biome: Global Osnabruck Data, 1937-1981. Data set. Available on-line [http://daac.ornl.gov] from Oak Ridge National Laboratory Distributed Active Archive Center, Oak Ridge, Tennessee, U.S.A. doi:10.3334/ORNLDAAC/214
Grubb, P. J. 1974. Factors controlling the distribution of forest-types on tropical mountains: new facts and a new perspective. Altitudinal Zonation in Malesia (Ed. by J. R. Flenley), Trans. 3rd Aberdeen-Hull Symp. Males. Ecol. Univ. Hull Geogr. Dept Miscell. Sere 16, 13-46.
Grubb, P. J. and Tanner, E. V. J. 1976. The montane forests and soils of Jamaica: a re-assessment. J. Arnold Arb. 57: 313-68.
Olson, R.J., J.M.O. Scurlock, S.D. Prince, D.L. Zheng, and K.R. Johnson (eds.). 2012a. NPP Multi-Biome: Global Primary Production Data Initiative Products, R2. Data set. Available on-line [http://daac.ornl.gov] from the Oak Ridge National Laboratory Distributed Active Archive Center, Oak Ridge, Tennessee, U.S.A. doi:10.3334/ORNLDAAC/617
Olson, R.J., J.M.O. Scurlock, S.D. Prince, D.L. Zheng, and K.R. Johnson (eds.). 2012b. NPP Multi-Biome: NPP and Driver Data for Ecosystem Model-Data Intercomparison, R2. Data set. Available on-line [http://daac.ornl.gov] from the Oak Ridge National Laboratory Distributed Active Archive Center, Oak Ridge, Tennessee, U.S.A. doi:10.3334/ORNLDAAC/615
Richards P.W. 1952. The Tropical Rain Forest. Cambridge University Press, London.
Scurlock, J.M.O., and R.J. Olson. 2002. Terrestrial net primary productivity - A brief history and a new worldwide database. Environ. Rev. 10(2): 91-109. doi:10.1139/a02-002
Scurlock, J.M.O., and R.J. Olson. 2012. NPP Multi-Biome: Grassland, Boreal Forest, and Tropical Forest Sites, 1939-1996, R1. Data set. Available on-line [http://daac.ornl.gov] from Oak Ridge National Laboratory Distributed Active Archive Center, Oak Ridge, Tennessee, U.S.A. doi:10.3334/ORNLDAAC/653