Get Data
Summary:
This data set contains daily Moderate Resolution Imaging Spectroradiometer (MODIS) land incident photosynthetically active radiation (PAR) images over North America for the years 2003 - 2005 and was created to fill the need for daily PAR estimates. Incident PAR is the solar radiation in the range of 400 to 700 nm reaching the earth's surface and plays an important role in modeling terrestrial ecosystem productivity.
The daily images were derived by integrating MODIS/Terra and MODIS/Aqua instantaneous PAR data where the instantaneous PAR data is estimated directly from Terra or Aqua MODIS 5-min L1b swath data (Liang et al., 2006 and Wang et al., 2010).
The spatial distribution of this data set includes the MODIS tile subsets covering North America, Central America, portions of South America, and Greenland, available for the years 2003 - 2005. There are 45,376 *.hdf files with a spatial resolution of 4 km x 4 km in sinusoidal projection distributed by year in three compressed data files: 2003.zip, 2004.zip, and 2005.zip. Contained within each daily file are 4 separate image files: DirectPar, DiffusePAR, TotalPAR, and Observation Count. There are 46 MODIS tiles that cover the study area extent.
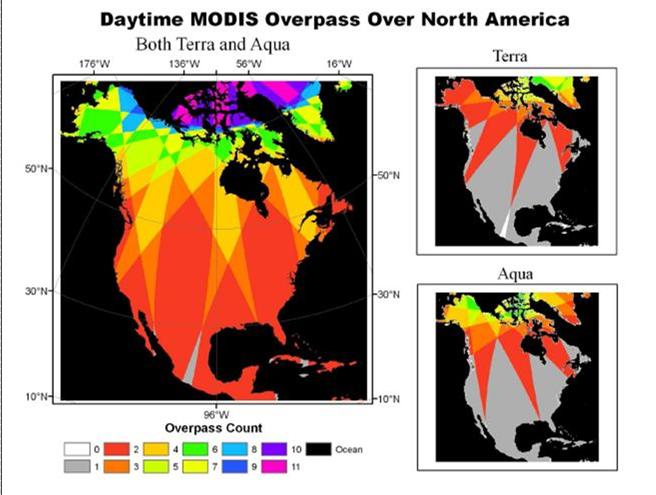
MODIS overpass of North America based on the Terra and Aqua orbital simulation from GMT 12:00 to 24:00, June 16, 2006. From Wang et al. (2010).
Data Citation:
Cite this data set as follows:
Liang, S. and D. Wang. 2012. NACP: MODIS Daily Land Incident 4-km PAR Images for North America, 2003-2005. Data set. Available on-line [http://daac.ornl.gov] from Oak Ridge National Laboratory Distributed Active Archive Center, Oak Ridge, Tennessee, U.S.A. http://dx.doi.org/10.3334/ORNLDAAC/1140
Table of Contents:
- 1 Data Set Overview
- 2 Data Characteristics
- 3 Applications and Derivation
- 4 Quality Assessment
- 5 Acquisition Materials and Methods
- 6 Data Access
- 7 References
1. Data Set Overview:
This data set contains daily Moderate Resolution Imaging Spectroradiometer (MODIS) land incident photosynthetically active radiation (PAR) images over North America for the years 2003 - 2005 and was created to fill the need for daily PAR estimates. Incident PAR is the solar radiation in the range of 400 to 700 nm reaching the earth's surface and plays an important role in modeling terrestrial ecosystem productivity.
The daily images were derived by integrating MODIS/Terra and MODIS/Aqua instantaneous PAR data where the instantaneous PAR data is estimated directly from Terra or Aqua MODIS 5-min L1b swath data (Liang et al., 2006 and Wang et al., 2010).
The spatial distribution of this data set includes the MODIS tile subsets covering North America, Central America, portions of South America, and Greenland, available for the years 2003 - 2005. There are 45,376 *.hdf files with a spatial resolution of 4 km x 4 km in sinusoidal projection distributed by year in three compressed data files: 2003.zip, 2004.zip, and 2005.zip. Contained within each daily file are 4 separate image files: DirectPar, DiffusePAR, TotalPAR, and Observation Count. There are 46 MODIS tiles that cover the study area extent.
2. Data Characteristics:
File Organization
There are 45,376 *.hdf files with a spatial resolution of 4 km x 4 km distributed by year in three compressed data files:
2003.zip: contains 15,027 *.hdf files
2004.zip: contains 14,634 *.hdf files
2005.zip: contains 15,715 *.hdf files
Contained within each daily file are 4 separate image files: DirectPar, DiffusePAR, TotalPAR, and Observation Count. There are 46 MODIS tiles that cover the study area extent.
Within these yearly .zip files, the MODIS_PAR files are arranged by MODIS TileID. Each .hdf file contains 4 bands as described below.
File Format
MODIS land incident PAR images are stored in the HDF-4 file format, which can be opened by most commercial Remote Sensing software packages (such as: ENVI, ERDAS, PCI).
File Naming Conventions
The daily MODIS Land Incident PAR Images files are named as follows:
DailyPAR.AYYYYDDD.HMMVNN.hdf
Where, YYYY is the year and DDD is the day of the year; MM is the H number of MODIS tile system and NN is the V number.
For example, DailyPAR.A2003001.H070V6.hdf means this is the daily-integrated PAR of the first day of 2003, covering MODIS tile H07V06.
Bands
Each daily-integrated PAR image has four bands:
DirectPAR, 16 bit signed integer, the direct part of the daily-integrated PAR value
DiffusePAR, 16 bit signed integer, the diffuse part of the daily-integrated PAR value
TotalPAR, 16 bit signed integer, the total daily-integrated PAR value
ObservationCount, 8 bit signed integer, referring to how many instantaneous PAR values are used to estimate the daily-integrated value.
The units for the first three bands are kJ/m2/day, and the fill value is 32767.
Projection
The MODIS PAR products are projected into the MODIS sinusoidal projection.
The parameters of the sinusoidal projection are:
Radius of reference sphere: 6371007.181 m
Longitude of the central meridian: 0.0
False easting: 0.0
False northing: 0.0
Pixel size: 3706.50173222 m (~ 4-km)
The MODIS_PAR files are distributed as tiles according to the MODIS tiling system. Each tile has 300*300 pixels.
The following tiles cover North American land areas (also depicted in the image below):
H7V6, H8V4, H8V5, H8V6, H8V7, H9V2, H9V3, H9V4,
H9V5, H9V6,
H9V7, H9V8, H10V2, H10V3, H10V4, H10V5,
H10V6, H10V7, H10V8, H11V2, H11V3,
H11V4, H11V5, H11V7,
H12V1, H12V2, H12V3, H12V4, H12V5, H13V1, H13V2,
H13V3,
H13V4, H14V1, H14V2, H14V3, H14V4, H15V0, H15V1, H15V2,
H16V0,
H16V1, H16V2, H17V0, H17V1, H17V2
MODIS Sinusoidal Tile Grid
Tiles are 10 degrees by 10 degrees at the equator. The tile coordinate system starts at (0,0) (horizontal tile number, vertical tile number) in the upper left corner and proceeds right (horizontal) and downward (vertical). The tile in the bottom right corner is (35,17).
Companion Metadata Files
There is one companion file, spatial_metadata_txt.zip, which contains 46 text files (.txt), which provides spatial information for each of the 46 MODIS tiles.
Sample metadata file: spatial.meta.h10v2.txt
| Projection=sinusoidal Reference_sphere_radius=6371007.181000m Central_meridian_longitude=0.0 False_easting=0.0 False_northing=0.0 Pixel_size=3706.501732m Upperleft_point_coordinate(meter)=(-8895604.166673,7783663.637665) Lowerright_point_coordinate(meter)=(-7783653.647007,6671713.117999) |
Assessing HDF-4 Files
The C language library and other software to operate on HDF-4 files can be found at http://www.hdfgroup.org/products/hdf4/.
Visualization
HDF Explorer (http://www.space-research.org/index.html) is a data visualization program that reads the HDF-4, HDF-5 and netCDF data file formats. HDF Explorer runs in the Microsoft Windows operating systems.
Site boundaries: (All latitude and longitude given in decimal degrees)
| Site (Region) | Westernmost Longitude | Easternmost Longitude | Northernmost Latitude | Southernmost Latitude |
|---|---|---|---|---|
| MODIS_PAR North America | -180.0 | 0.024 | 90.00 | 0.0 |
Tile boundaries: (All latitude and longitude given in decimal degrees)
| Site (Region) | Westernmost Longitude | Easternmost Longitude | Northernmost Latitude | Southernmost Latitude |
|---|---|---|---|---|
| MODIS Tile H7 V6 | -127.0171 | -106.4089 | 20.000 | 30.000 |
| MODIS Tile H8 V4 | -155.5724 | -117.4758 | 40.0000 | 50.0000 |
| MODIS Tile H8 V5 | -130.5407 | -103.9134 | 30.0000 | 40.0000 |
| MODIS Tile H8 V6 | -115.4701 | -95.7671 | 20.0000 | 30.0000 |
| MODIS Tile H8 V7 | -106.4178 | -91.3799 | 10.0000 | 20.0000 |
| MODIS Tile H9 V2 | -180.0000 | -159.9833 | 60.0000 | 63.6167 |
| MODIS Tile H9 V3 | -180.0000 | -124.4449 | 50.0000 | 60.0000 |
| MODIS Tile H9 V4 | -140.0151 | -104.4217 | 40.0000 | 50.0000 |
| MODIS Tile H9 V5 | -117.4867 | -92.3664 | 30.0000 | 40.0000 |
| MODIS Tile H9 V6 | -103.9230 | -85.1254 | 20.0000 | 30.0000 |
| MODIS Tile H9 V7 | -95.7760 | -81.2257 | 10.0000 | 20.0000 |
| MODIS Tile H9 V8 | -91.3884 | -79.9917 | -0.0000 | 10.0000 |
| MODIS Tile H10 V2 | -180.0000 | -139.9833 | 60.0000 | 67.1167 |
| MODIS Tile H10 V3 | -160.0000 | -108.8877 | 50.0000 | 60.0000 |
| MODIS Tile H10 V4 | -124.4579 | -91.3676 | 40.0000 | 50.0000 |
| MODIS Tile H10 V5 | -104.4326 | -80.8194 | 30.0000 | 40.0000 |
| MODIS Tile H10 V6 | -92.3760 | -74.4836 | 20.0000 | 30.0000 |
| MODIS Tile H10 V7 | -85.1342 | -71.0714 | 10.0000 | 20.0000 |
| MODIS Tile H10 V8 | -81.2341 | -69.9917 | -0.0000 | 10.0000 |
| MODIS Tile H11 V2 | -180.0000 | -119.9833 | 60.0000 | 70.0000 |
| MODIS Tile H11 V3 | -140.0000 | -93.3305 | 50.0000 | 60.0000 |
| MODIS Tile H11 V4 | -108.9007 | -78.3136 | 40.0000 | 50.0000 |
| MODIS Tile H11 V5 | -91.3785 | -69.2724 | 30.0000 | 40.0000 |
| MODIS Tile H11 V7 | -74.4924 | -60.9171 | 10.0000 | 20.0000 |
| MODIS Tile H12 V1 | -180.000 | -146.1659 | 70.0000 | 73.8750 |
| MODIS Tile H12 V2 | -175.4283 | -99.9833 | 60.0000 | 70.0000 |
| MODIS Tile H12 V3 | -120.0000 | -77.7732 | 50.0000 | 60.0000 |
| MODIS Tile H12 V4 | -93.3434 | -65.2595 | 40.0000 | 50.0000 |
| MODIS Tile H12 V5 | -78.3244 | -57.7254 | 30.0000 | 40.0000 |
| MODIS Tile H13 V1 | -180.0000 | -116.9278 | 70.0000 | 77.1667 |
| MODIS Tile H13 V2 | -146.1902 | -79.9833 | 60.0000 | 70.0000 |
| MODIS Tile H13 V3 | -100.0000 | -62.2160 | 50.0000 | 60.0000 |
| MODIS Tile H13 V4 | -77.7862 | -52.2054 | 40.0000 | 50.0000 |
| MODIS Tile H14 V1 | -180.0000 | -87.6898 | 70.0000 | 80.0000 |
| MODIS Tile H14 V2 | -116.9522 | -59.9833 | 60.0000 | 70.0000 |
| MODIS Tile H14 V3 | -80.0000 | -46.6588 | 50.0000 | 60.0000 |
| MODIS Tile H14 V4 | -62.2290 | -39.1513 | 40.0000 | 50.0000 |
| MODIS Tile H15 V0 | -180.0000 | -115.1274 | 80.0000 | 83.6250 |
| MODIS Tile H15 V1 | -172.7631 | -58.4517 | 70.0000 | 80.0000 |
| MODIS Tile H15 V2 | -87.7141 | -39.9833 | 60.0000 | 70.0000 |
| MODIS Tile H16 V0 | -180.0000 | -57.5397 | 80.0000 | 86.8167 |
| MODIS Tile H16 V1 | -115.1754 | -29.2137 | 70.0000 | 80.0000 |
| MODIS Tile H16 V2 | -58.4761 | -19.9833 | 60.0000 | 70.0000 |
| MODIS Tile H17 V0 | -180.0000 | 57.2957 | 80.0000 | 90.0000 |
| MODIS Tile H17 V1 | -57.5877 | 0.0480 | 70.0000 | 80.0000 |
| MODIS Tile H17 V2 | -29.2380 | 0.0244 | 60.0000 | 70.0000 |
Time period:
- The data set covers the period 2003/01/01 to 2005/12/31.
3. Data Application and Derivation:
Incident PAR is a key variable needed by almost all terrestrial ecosystem models. Current incident PAR products estimated from remotely sensed data at spatial and temporal resolutions are not sufficient for carbon cycle modeling and various applications. In this study, the authors developed a new method based on the look-up table approach for estimating instantaneous incident PAR from MODIS data (Liang et al. 2006).
4. Quality Assessment:
Ground measurements from seven FLUXNET sites were used for validating the algorithm. The results indicated that this approach can produce reasonable PAR product at 1 km resolution and is suitable for global applications, although more quantitative validation activities are still needed (Liang et al. 2006).
The released version is version 1.5 and last modified on May 20, 2008. The integration method is the adjusted sinusoidal model, which may produce slight biases in some cases.
5. Data Acquisition Materials and Methods:
Instantaneous PAR can be used to simulate photosynthesis in many ecosystem models. However, many models require a daily time step and thus the daily PAR product is more desirable.
The daily PAR is calculated from two instantaneous PAR products (MODIS/Terra (AM) and MODIS/Aqua (PM)) (Liang et al. 2006 and Wang et al., 2010). Experiments show that the diurnal cycle can be approximated by cosine function of the local solar zenith angle (e.g., Tarpley, 1979). Following the same logic, the morning and afternoon diurnal cycles are expressed by two different functions. Specifically, MODIS/Terra instantaneous PAR values are used for determining the coefficient of the morning function, and MODIS/Aqua instantaneous PAR values are used for determining the afternoon function. The daily PAR is simply the integration of these two functions.
6. Data Access:
This data is available through the Oak Ridge National Laboratory (ORNL) Distributed Active Archive Center (DAAC).
Data Archive Center:
Contact for Data Center Access Information:
E-mail: uso@daac.ornl.gov
Telephone:
+1 (865) 241-3952
7. References:
Liang, S., Zheng, T., et al. (2006). Estimation of incident photosynthetically active radiation from Moderate Resolution Imaging Spectrometer data. Journal of Geophysical Research-Atmospheres 111(D15).
Tarpley, J. D. (1979), Estimating incident solar radiation at the surface from geostationary satellite data, J. Appl. Meteorol., 18, 1172– 1181.
Wang, D., S. Liang, R. Liu, and T. Zheng. (2010). Estimation of
daily-integrated PAR from sparse satellite observations: Comparison of temporal
scaling methods, International Journal of Remote Sensing. 31:6,
1661-1677.