Get Data
Summary:
This data set reports phosphorus (P), carbon (C), and nitrogen (N) nutrient pool concentrations for forest soils and roots and P pool concentrations for forest floor litter, soil solutions, and microbial extracts. Soils samples were also extracted using the Hedley sequential fractionation method and the extracts analyzed for P. Nutrient pool concentrations are presented on an areal basis of 1 hectare to a depth of 10 cm, as calculated from soil bulk densities and respective pool biomass quantities. There is one comma-delimited ASCII file with this data set.
These measurements were made during a soil P addition fertilization experiment conducted at the km 83 site, Tapajos National Forest, Para, Brazil. Control and fertilized plots were established in both sandy loam and clay soils. Soil cores were collected every 4 months from August 1999 through April 2000 (McGroddy et al. 2008).
Data Citation:
Cite this data set as follows:
McGroddy, M.E. 2012. LBA-ECO TG-07 Forest Soil P, C, and N Pools, km 83 Site, Tapajos National Forest. Data set. Available on-line [http://daac.ornl.gov] from Oak Ridge National Laboratory Distributed Active Archive Center, Oak Ridge, Tennessee, U.S.A .http://dx.doi.org/10.3334/ORNLDAAC/1085
Implementation of the LBA Data and Publication Policy by Data Users:
The LBA Data and Publication Policy [http://daac.ornl.gov/LBA/lba_data_policy.html] is in effect for a period of five (5) years from the date of archiving and should be followed by data users who have obtained LBA data sets from the ORNL DAAC. Users who download LBA data in the five years after data have been archived must contact the investigators who collected the data, per provisions 6 and 7 in the Policy.
This data set was archived in May of 2012. Users who download the data between May 2012 and April 2017 must comply with the LBA Data and Publication Policy.
Data users should use the investigator contact information in this document to communicate with the data provider. Alternatively, the LBA website [http://lba.inpa.gov.br/lba/] in Brazil will have current contact information.
Data users should use the Data Set Citation and other applicable references provided in this document to acknowledge use of the data.
Table of Contents:
- 1 Data Set Overview
- 2 Data Characteristics
- 3 Applications and Derivation
- 4 Quality Assessment
- 5 Acquisition Materials and Methods
- 6 Data Access
- 7 References
1. Data Set Overview:
Project: LBA (Large-Scale Biosphere-Atmosphere Experiment in the Amazon)
Activity: LBA-ECO
LBA Science Component: Trace Gas and Aerosol Fluxes
Team ID: TG-07 (Keller / de Mello)
The investigator was McGroddy, Megan. You may contact McGroddy, Megan (mcgroddy@gmail.com).
LBA Data Set Inventory ID: TG07_Soil_Nutrients
This data set reports phosphorus (P), carbon (C), and nitrogen (N) nutrient pool concentrations for forest soils and roots and P pool concentrations for forest floor litter, soil solutions, and microbial extracts. Soils samples were also extracted using the Hedley sequential fractionation method and the extracts analyzed for P. Nutrient pool concentrations are presented on an areal basis of 1 hectare to a depth of 10 cm, as calculated from soil bulk densities and respective pool biomass quantities.
These measurements were made during a soil P addition fertilization experiment conducted at the km 83 site, Tapajos National Forest, Para, Brazil, between April 1999 and April 2000 (McGroddy et al. 2008). Control and fertilized plots were established in both sandy loam and clay soils. Soil cores were collected every 4 months from August 1999 through April 2000.
Related Data Set
- LBA-ECO TG-07 Litter Decomposition, Tapajos National Forest, Para, Brazil: 2000-2001 (leaf litter decomposition study done in the same research plots)
2. Data Characteristics:
Data are presented in one comma-delimited ASCII file: TG07_km83_Tapajos_P_fertilization.csv| Column | Heading | Units/format | Description |
|---|---|---|---|
| 1 | collection | month from the initial collection and start of fertilization treatment : 0 (pre-fertilization),4,8,12 | |
| 2 | collection_date | collection date is represented as yyyymmdd | |
| 3 | core_type | cores were either incubation cores (soil collected in April 1999 and packed into plastic mesh cores which were placed back in the sample location) or direct cores ( soil cores collected on the collection date with no prior manipulation other than fertilzation treatment where appropriate) | |
| 4 | soil | soil class determined by texture: clay or sandy loam (sand) | |
| 5 | treatment | 1 means fertilized with 137 kg P per hectare per year, 0 means no fertilizer added: the initial collection was done prior to fertilzer addition so treatment is used to indicate cores in the plots that later received fertilizer | |
| 6 | bulk_density | Mg per ha | bulk density to a 10 cm depth data reported is a mean of 3 samples |
| 7 | P_resin | kg per ha | water extractable P: collected on anion exchange resin: Hedley P fraction*: data reported is a mean of 3 samples for direct cores and a mean of 6 samples for incubation cores |
| 8 | P_NaHCO3 | kg per ha | 0.5M NaHCO3 extractable P; Hedley P fraction:* data reported is a mean of 3 samples for direct cores and a mean of 6 samples for incubation cores |
| 9 | P_NaOH | kg per ha | 0.5M NaOH extractable P; Hedley P fraction*: data reported is a mean of 3 samples for direct cores and a mean of 6 samples for incubation cores |
| 10 | P_1M_HCl | kg per ha | 1M HCl extractable P; Hedley P fraction*: data reported is a mean of 3 samples for direct cores and a mean of 6 samples for incubation cores |
| 11 | P_conc_HCl | kg per ha | concentrated HCl extractable P; Hedley P fraction:* data reported is a mean of 3 samples for direct cores and a mean of 6 samples for incubation cores |
| 12 | P_H2SO4 | kg per ha | residual P; extracted with a H2SO4 digest; Hedley P fraction*: data reported is a mean of 3 samples for direct cores and a mean of 6 samples for incubation cores |
| 13 | digest_P | mg per kg soil | total soil P measured by modified Kjeldhal digest: data reported is a mean of 3 samples for direct cores and a mean of 6 samples for incubation cores |
| 14 | soil_N | percent | total soil N measured by dry combustion: data reported is a mean of 3 samples for direct cores and a mean of 6 samples for incubation cores |
| 15 | soil_C | percent | total soil C measured by dry combustion: data reported is a mean of 3 samples for direct cores and a mean of 6 samples for incubation cores |
| 16 | dead_rt_mass | kg per ha | dead root biomass to 10 cm depth roots; 65 degree dry wt: data reported is a mean of 3 samples for both direct cores and incubation cores |
| 17 | total_rt_mass | kg per ha | total root biomass to 10 cm depth roots; 65 degree dry wt: data reported is a mean of 3 samples for both direct cores and incubation cores |
| 18 | dead_rt_P | kg per ha | P pool in dead root tissue; from a Kjeldhal digest; analyzed on an ICP: data reported is a mean of 3 samples for both direct cores and incubation cores |
| 19 | total_rt_P | kg per ha | P pool in total root tissue; from a Kjeldhal digest; analyzed on an ICP1/30/2012 data reported is a mean of 3 samples for both direct cores and incubation cores |
| 20 | dead_rt_N | kg per ha | dead root tissue N pool measured by dry combustion: data reported is a mean of 3 samples for both direct cores and incubation cores |
| 21 | total_rt_N | kg per ha | total root tissue N pool measured by dry combustion: data reported is a mean of 3 samples for both direct cores and incubation cores |
| 22 | dead_rt_C | kg per ha | dead root tissue C pool measured by dry combustion: data reported is a mean of 3 samples for both direct cores and incubation cores |
| 23 | total_rt_C | kg per ha | total root tissue C pool measured by dry combustion: data reported is a mean of 3 samples for both direct cores and incubation cores |
| 24 | forest_floor_mass | Mg per ha | forest floor litter mass 65 degree dry wt: data reported is a mean of 5 samples per plot |
| 25 | forest_floor_P | kg per ha | forest floor litter P pool measured by modified Kjeldhal digest; analyzed on an ICP: data reported is a mean of 5 samples per plot |
| 26 | microbial_P | kg per ha | microbial biomass P determined by chloroform fumigation direct extraction method and measured colormetrically no correction for efficiency used : data reported is a mean of 3 samples for direct cores and a mean of 6 samples for incubation cores |
| 27 | leachate_P | kg per ha | inorganic P in soil solution leached from the bottom of the root ingrowth cores captured by anion exchange resins and measured colormetrically: data reported is a mean of 6 per plot |
| *Hedley P sequential fractionation method (Frizano et al. 2002) | |||
| missing data are represented by -9999 | |||
Example data records:
|
collection,collection_date,core_type,soil,treatment,bulk_density,P_resin,P_NaHCO3,P_NaOH,P_1M_HCl,P_conc_HCl,P_H2SO4,digest_P,soil_N,soil_C ,dead_rt_mass,total_rt_mass,dead_rt_P,total_rt_P,dead_rt_N,total_rt_N,dead_rt_C,total_rt_C,forest_floor_mass,forest_floor_P,microbial_P,leachate_P
0,19990429,direct,clay,0,1150,0,28,61,3,51,29,58,0.17,1.89,-9999,-9999,-9999,-9999,-9999,-9999,-9999,-9999,4.08,1.51,-9999,-9999 0,19990429,direct,clay,0,1007,1,30,48,2,41,13,36,0.24,2.66,-9999,-9999,-9999,-9999,-9999,-9999,-9999,-9999,5.53,3,-9999,-9999 ... 4,19990731,direct,sand,0,1596,2,1,16,1,53,23,69,0.06,0.82,2300.1,2537.1,1,1,49.1,52.7,1079.5,1196,5.93,6.02,3.1,-9999 4,19990731,direct,sand,0,1598,1,9,15,1,32,39,93,0.08,0.9,2665.7,2902.7,0.9,0.9,70,73.6,1224.2,1340.7,3.57,2.58,7.2,-9999 ... 12,20000419,direct,sand,1,1391,0,31,47,2,32,11,157,0.09,1.21,2197.7,2725.2,1.6,2.2,52.2,62.8,989.8,1251.8,7.91,6.76,0.3,-9999 12,20000419,direct,sand,1,1296,0,41,37,1,17,10,91,0.07,1.01,4176.3,4607.5,2.4,2.6,77.6,83.9,2016.8,2224.1,5.66,2.91,11.5,-9999 |
Site boundaries: (All latitude and longitude given in decimal degrees)
| Site (Region) | Westernmost Longitude | Easternmost Longitude | Northernmost Latitude | Southernmost Latitude | Geodetic Datum |
|---|---|---|---|---|---|
| Para Western (Santarem) - km 83 Logged Forest Tower (Para Western (Santarem)) | -54.9707 | -54.9707 | -3.017 | -3.017 | World Geodetic System, 1984 (WGS-84) |
Time period:
- The data set covers the period 1999/04/20 to 2000/04/20
- Temporal Resolution: Quarterly
Platform/Sensor/Parameters measured include:
- FIELD INVESTIGATION / ANALYSIS / BIOGEOCHEMICAL CYCLES
- FIELD INVESTIGATION / WEIGHING BALANCE / SOIL BULK DENSITY
- FIELD INVESTIGATION / CARBON ANALYZER / CARBON
- FIELD INVESTIGATION / KJELDAHL DIGESTION / NITROGEN
- FIELD INVESTIGATION / COLORIMETERS / PHOSPHORUS
- FIELD INVESTIGATION / COLORIMETERS / PHOSPHORUS
- FIELD INVESTIGATION / WEIGHING BALANCE / BIOMASS
3. Data Application and Derivation:
In addition to its role limiting primary productivity, work has suggested that soil P is linked to soil C sequestration capacity in highly weathered soils (Giardina et al., 2004; Li et al., 2006) although the relationship is not well understood. Our ability to predict the C fluxes in tropical forest ecosystems under changing climate conditions depends on our understanding of the interaction among soil P pools as well as the regulation of these pools and their relative size by soil environment.
4. Quality Assessment:
Forest Floor and Roots:
- For C and N analyses, acetanilide (10.36 % N and 71.09 % C) was used as a reference standard. Samples were analyzed in duplicate and rejection criterion was set at > 10% variance between duplicates.
- Total P was determined after a H2O2 predigest and modified Kjeldhal digest of ground plant tissue (J.Tilley pers. comm.). NIST apple leaves were used as a reference standard and acheived a 98 (+/- 2) % recovery.
Soil P Pools:
Total P soil was calculated as the sum of the measured sequential fractions of pools in the Hedley Fractionation and compared to:
- Total P measured by Kjeldhal digest method
- The NIST San Joaqin standard soils
- Total P measured by HF digestion at the Dept. de Geoquimica at the Universidade Federal Fluminense. Due to the cost and risk associated with the HF analyses only 12 samples were included
Confidence Level or Accuracy Judgment:
The total soil P values by summation of fractions was comparable to the measurements by the HF method (estimated method precision of + 25%), but regression analysis suggested that summing of fractions slightly overestimated total P at higher concentrations and underestimated P at lower concentrations.
Measurement Error and Detection Limits:
- Balances for mass measurements + 0.01g
- C and N analyses + 0.01 % for both
- ICP for P in digest solutions detection limit 2 ug per liter which translates into a detection limit of approximately 120 P ug per kg soil
- For the colorimeter method, the P detection limit was higher, approximately 0.1 mg per liter or approximately 5 mg P per kg soil. Strong coloration of the inorganic extracts made colorimetric analyzes imprecise so only total pools are reported
5. Data Acquisition Materials and Methods:
Study Site
The study was conducted in the Tapajos National Forest, 83 km south of Santarem, Para, Brazil (2 degrees 64 minutes S and 54 degrees 59 minutes W). For additional site description see Silver et al. (2000), Keller et al. (2001) and McGroddy et al. (2004). The planalto area south of Santarem is dominated by well-drained dystrophic yellow-brown lateritic Ultisols (Latossolo Amarelo textura muito argilosa in the Brazilian classification system), derived from the sandy-clayey lithography of the Alter do Chao formation (Cretaceous-Tertiary, Irions 1984). In addition to the dominant Ultisols, deep well drained sand/sandy-loam soils (Oxisols, Neossolos Quartzarenicos in the Brazilian soil classification system), developed from sandy sediments deposited during the Quaternary, occur in the same region (Rodrigues et al. 1991).
Experimental Design
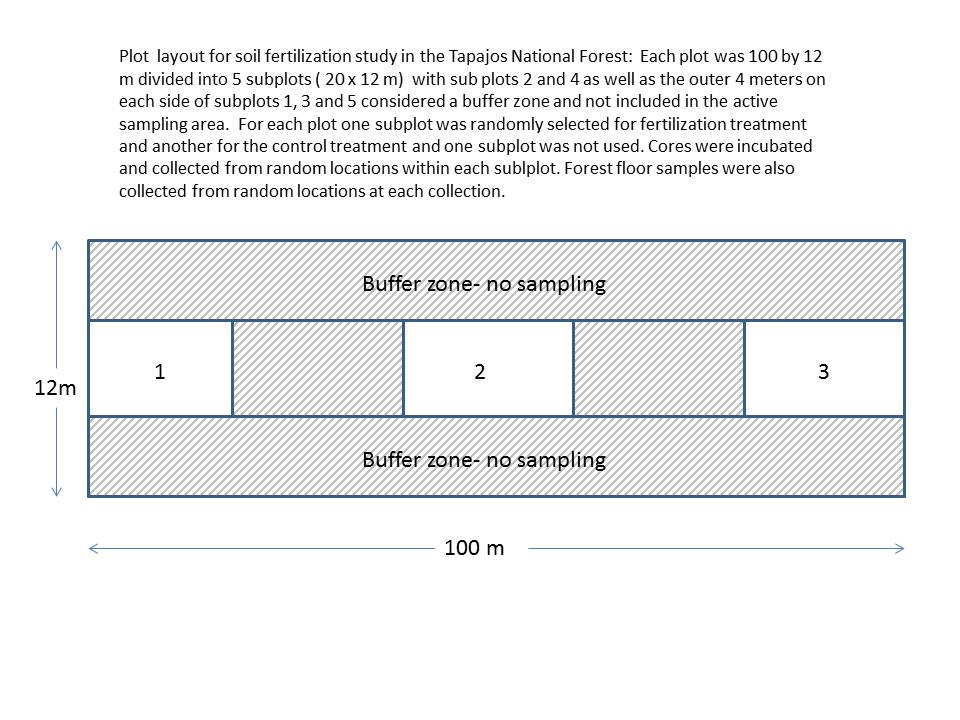
Plots for clay soils were located 250 m south of the southern boundary of the area marked for selective harvesting while the plots on sandy soils were located 350 m east of the eastern boundary of the same area. Three study blocks (12 x 100 m) were established on level terrain in each soil type within the Tapajos National Forest. Blocks were divided into five 12 x 20 m plots with fertilization addition and sampling restricted to the interior 4 x 20 m zone of the first, third and fifth plots, leaving the rest of the area as buffer. Plots were located and incubation cores installed in March 1999. Soil collections began in April 1999 and continued every 4 months afterwards through April 2000. Fertilizer was applied to one randomly selected treatment plot in each study block at three points over the course of the study period (May, August and December of 1999).
Root, microbial and soil P dynamics
Root, microbial and soil P dynamics incubation cores were 10 cm high and 6 cm in diameter and were constructed from plastic canvas (Darice 7 count plastic canvas, 2 x 2 mm mesh). A total of 360 root incubation cores were constructed. We selected 216 cores for inorganic P leachate estimates; the bottom of these cores were fitted with 6 cm dia. silk resin bags containing 3g of Cl charged Biorad AG 85 anion exchange resin beads. For each core a soil sample was taken using a 6 cm diameter soil corer to a depth of 10 cm. Visible roots and large pieces of organic material were removed by hand and the homogenized soil from each sample was packed into a plastic canvas core thus maintaining representative bulk densities. At each of 15 randomly selected locations within the plot a set of three cores was installed to allow for fine root biomass measurements as well as soil and microbial biomass P measurements. All incubation cores (total of 180 sets or 540 cores) were installed in April 1999.
Cores were collected 4, 8, and 12 months after installation (in August and November 1999 and April 2000). At each time point, we collected 5 sets of incubation cores, we also collected 6 bulk soil cores and 5 forest floor samples from each treatment plot for further estimates of soil, root and litter layer P dynamics. Three of the bulk cores were analyzed for fine root biomass and nutrient content and the other three for bulk density and soil and microbial P pools.
Results of measurements of soil nutrient concentrations on 0.5g soil sample extracts are presented on an areal basis (1 hectare to 10 cm depth) calculated by multiplying concentrations by soil bulk density values measured at each plot and collection point using a standard volume soil corer (10 cm high and 6 cm in diameter).
Analytical methods
Soil pH in 2 M KCl was determined on a 1:1 slurry of fresh soils from the initial soil collections done in April 1999. These analyzes were done in at the EMBRAPA analytical labs in Belem, PA, Brazil. All further analyses were done at the University of California, Berkeley. Soil texture was determined for one composite sample from each plot using the Bouyoucos hydrometer method (Gee and Bauder 1976). Total soil C and N were measured on air-dried, ground soils using a dry combustion- reduction method on a CE Instruments NC2500 soil analyzer (CE Instruments Lakewood NJ).
Soil P fractions were determined using the modified Hedley fractionation method (Tiessen and Moir 1993, Frizano et al. 2002) on air-dried soil samples. Phosphorus concentrations of the extractant solutions were determined (1) on a Lachat QuickChem 8000 Automated Ion Analyzer (Lachat Instruments Division of Zellweger Analytics, Inc. Milwaukee WI) or (2) for extractant solutions with strong color on a Thermo Jarrell Ash axial IRIS ICP-AES (Thermo Elemental, Franklin MA). Strong coloration of the inorganic extracts made colorimetric analyzes imprecise so only total pools are reported. The total soil P values by summation corresponded to the measurements by the hydrofluoric acid (HF) digestion method (estimated method precision of + 25%) but regression analysis suggested that summing of fractions slightly overestimated total P at higher concentrations and underestimated P at lower concentrations (McGroddy et al. 2008).
Anion exchange resins
Anion exchange resin bags were stored frozen until they could be analyzed in 2001. Soil and organic matter were washed from the bags with distilled, deionized water, and each bag was extracted with 50 ml of a 0.5 M HCl solution. Bags with holes due to either root or soil fauna activity were re-weighed to get an accurate assessment of mass. Approximately 15 percent of the bags from the final collection point were colonized by root biomass. Plant or fungal uptake of P in the root colonized bags may have caused an underestimation of P captured by the resin and these bags were excluded from the analyzes. Orthophosphate in the extraction solution was determined using a molybdate blue analysis on a Lachat QuickChem 8000 Automated Ion Analyzer.
Microbial Biomass Phosphorus
An index of microbial biomass P pools was determined using the chloroform fumigation direct extraction (CFDE) technique with acidified NH4F as the extraction solution (Brookes et al., 1982; Oberson et al., 1997) on fresh soils. Phosphorus concentrations in the extraction solutions were determined on Thermo Jarrell Ash axial IRIS ICP-AES. CDFE-P was calculated as the difference between the P extracted from the fumigated sample and that from the non-fumigated sample. All data are reported on a 105 degrees C dry weight basis.
Root biomass and nutrient content
Roots were washed through a series of three Nalgene sieves (sieve opening sizes: 2.0, 0.5 and 0.2 mm respectively) to remove soil particles and extraneous organic material. Fine roots (< 2mm diameter), considered most active in nutrient uptake, were sorted into live and dead categories based on appearance and tensile strength (Vogt and Persson 1991), dried at 65 degrees C and weighed to determine mass. Samples from replicate plots were bulked as necessary to provide enough tissue for nutrient analyzes, and ground in a Wiley mill. Total tissue C and N were measured on a CE Instruments NC2500 soil analyzer (CE Instruments Lakewood NJ). Fine root tissue P concentrations were determined on a Thermo Jarrell Ash axial IRIS ICP-AES after a modified Kjeldhal digest (Parkinson and Allen 1975). Recovery of P in NIST apple leaf standard averaged 92 + 1.6 %.
Forest floor phosphorus and soil bulk density, carbon and nitrogen
Forest floor phosphorus and soil bulk density, carbon and nitrogen forest floor samples were dried at 50 degrees C for 3 days and weighed to determine mass. A set of sub-samples was dried at 65 degrees C and a conversion factor was developed to calculate mass on a 65 degrees C dry weight basis. Samples were ground in a Wiley mill and passed through a 40 mesh. A 0.5 g sub-sample was ashed at 550 degrees C for 4 h in order to determine the inorganic composition of each sample. Total P concentrations were determined as described for the root tissue and reported on a 65 degree C dry weight and ash free basis. Bulk density was determined by measuring fresh weight of soil from 3 cores (282.6 cm3 volume, 0-10 cm depth) from each plot and a fresh to oven dry (105 degrees C) conversion developed from a subsample from each core. Air-dried soils from each collection were passed through a 2 mm sieve, ground, and analyzed for total C and N using the methods described for root tissue.
6. Data Access:
This data is available through the Oak Ridge National Laboratory (ORNL) Distributed Active Archive Center (DAAC).
Data Archive Center:
Contact for Data Center Access Information:
E-mail: uso@daac.ornl.gov
Telephone: +1 (865) 241-3952
7. References:
Brookes, P. C., D. S. Powlson, and D. S. Jenkinson (1982), Measurement of microbial biomass phosphorus in soil, Soil Biol. Biochem., 14, 319–329, doi:10.1016/0038-0717(82)90001-3.
Frizano, J., A.H. Johnson, D.R. Vann and F.N. Scatena (2002), Soil phosphorus fractionation during forest development on landslide scars in the Luquillo Mountains, Puerto Rico. Biotropica, 34, 17-26.
Gee, G.W., and J.W. Bauder (1986), Particle-size analysis. In A. Klute (ed) Methods of Soil Analysis. Part I. Physical and Mineralogical Methods. ASA-SSSA, Madison, WI. USA
Giardina, C.P., D. Binkley, M.G. Ryan, J.H. Fownes and R.S. Senock (2004), Belowground carbon cycling in a humid tropical forest decreases with fertilization. Oecol., 139, 545-550.doi:10.1007/s00442-004-1552-0
Irions, G. (1984), Clay minerals of Amazonian soils. In H. Sioli (ed) The Amazon: Limnology and Landscape Ecology of A Mighty Tropical River and Its Basin. Dr. J.W. Junk Publishers, Dordrecht
Keller M., M. Palace and G. Hurtt (2001), Biomass estimation in the Tapajos National Forest, Brazil - Examination of sampling and allometric uncertainties. For. Ecol. Manage., 154, 371-382.doi:10.1016/S0378-1127(01)00509-6
Li, Y., M. Xu, X. Zou. (2006), Effects of nutrient additions on ecosystem carbon cycle in a Puerto Rican tropical wet forest. Glob. Change Biol., 12, 284-293.doi:10.1111/j.1365-2486.2005.01096.x
McGroddy, M., W.L. Silver and R.C. de Oliveira Jr. (2004), The effect of phosphorus additions on decomposition dynamics in a seasonal lowland Amazonian forest. Ecosystems, 7, 172-179. doi:10.1007/s10021-003-0208-y
McGroddy, M.E., W.L. Silver R. C. de Oliveira Jr. W.Z. de Mello, and M. Keller (2008), Retention of phosphorus in highly weathered soils under a lowland Amazonian forest ecosystem. Journal of Geophysical Research - Biogeosciences. doi:10.1029/2008JG000756
Oberson, A., D. K. Friesen, C. Morel, and H. Tiessen (1997), Determination of phosphorus released by chloroform fumigation from microbial biomass in high P sorbing tropical soils, Soil Biol. Biochem., 29, 1579–1583, doi:10.1016/S0038-0717(97)00049-7
Parkinson, J.A. and S.E. Allen (1975), A wet oxidation process suitable for the determination of nitrogen and mineral nutrients in biological materials. Comm. Soil Sci. Plant Anal., 6, 1-11. doi:10.1080/00103627509366539
Rodrigues, T.E., R.C. Oliveira Jr, M.A. Valente et al. (1991), Caracterizacao fisico-hidrica dos principais solos da Amazonia. I. Estado do Para. Convenio EMBRAPA-FAO. Relatorio mimeografado.
Silver W.L., J. Neff, M. McGroddy et al. (2000), Effects of soil texture on belowground carbon and nutrient storage in a lowland Amazonian forest ecosystem. Ecosystems, 3, 193-209.doi:10.1007/s100210000019
Tiessen, H. and J.O. Moir (1993), Characterization of available P by sequential extraction. In: MR Carter (ed) Soil Sampling and Methods of Analysis. Lewis Publishers, Boca Raton.
Vogt, K.A. and H. Persson (1991), Measuring growth and development of roots. In: JP Lassoie and TM Hinkley (eds) Ecophysiology of forest trees: techniques and methodologies. CRC Press, Boca Raton.