Get Data
Summary:
This data set reports the results of a comprehensive study of mound building termites at the Embrapa research station in the Distrito Agropecuario da SUFRAMA, located at km 53 of the federal highway BR 174 outside Manaus, Amazonas, Brazil. Study areas included a primary forest site, an adjacent 7-8 year old secondary forest site, and two abandoned pasture sites which were being used for agroforest purposes.
Reported are (1) the termite species occurrence and areal abundance of mounds, (2) characterization of the mound soil microbiological community, root biomass, seedling emergence success, soil respiration, nitrogen mineralization, and (3) the characterization of the termite mound soil physical, chemical, and hydraulic properties. Analyses were also performed on samples from adjacent control soils for comparison. This data set contains 15 comma-delimited data files.
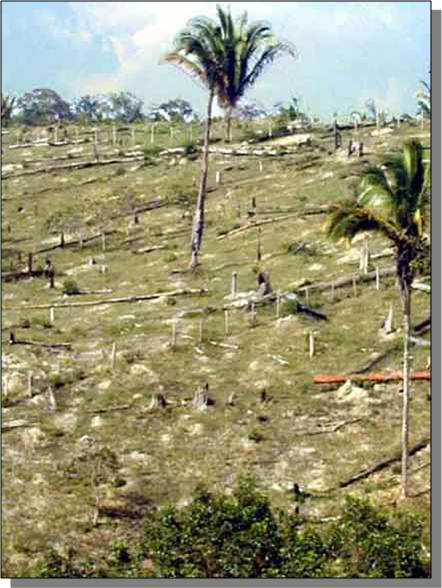
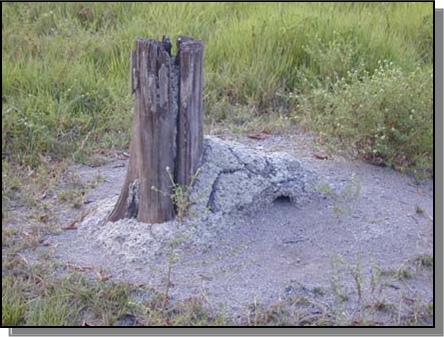
View of a pasture with a high termite mound density and an active termite mound around a pasture stump.
Data Citation:
Cite this data set as follows:
Ackerman, I. 2012. LBA-ECO ND-04 Termite Mound and Soil Characterization, Amazonas, Brazil: 1999-2001. ORNL DAAC, Oak Ridge, Tennessee, USA. http://dx.doi.org/10.3334/ORNLDAAC/1072
Implementation of the LBA Data and Publication Policy by Data Users:
The LBA Data and Publication Policy [http://daac.ornl.gov/LBA/lba_data_policy.html] is in effect for a period of five (5) years from the date of archiving and should be followed by data users who have obtained LBA data sets from the ORNL DAAC. Users who download LBA data in the five years after data have been archived must contact the investigators who collected the data, per provisions 6 and 7 in the Policy.
This data set was archived in March of 2012. Users who download the data between March 2012 and April 2017 must comply with the LBA Data and Publication Policy.
Data users should use the Investigator contact information in this document to communicate with the data provider. Alternatively, the LBA website [http://lba.inpa.gov.br/lba/] in Brazil will have current contact information. Data users should use the Data Set Citation and other applicable references provided in this document to acknowledge use of the data.
Table of Contents:
- 1 Data Set Overview
- 2 Data Characteristics
- 3 Applications and Derivation
- 4 Quality Assessment
- 5 Acquisition Materials and Methods
- 6 Data Access
- 7 References
1. Data Set Overview:
Project: LBA-ECO
Activity: Biogeochemical Cycles in Degraded Lands
LBA Science Component: Nutrient Dynamics
Team ID: ND-04 (Fernandes / Wandelli)
The investigators were Ackerman, Ilse Lieve; Rondon, Marco Antonio; Wandelli, Elisa Vieira; Riha, Susan J. and Fernandes, Erick C.M. You may contact Ackerman, Ilse L. (ila1@cornell.edu).
LBA Data Set Inventory ID: ND04_Termite_Mounds
This data set examines the impact of termite mounds on an array of soil properties at a secondary forest site in Central Amazonia. Soil physical, chemical, hydraulic, and microbiological properties are measured in comparison to adjacent control soil. Comparisons of some measures of carbon and nitrogen cycling are also made. This data set also contains a comparison of the termite species composition of low- and high-diversity agroforestry systems with primary forest.
2. Data Characteristics:
Data are provided in 15 comma-delimited ASCII files. Please refer to the companion file Ackerman_dissertation_2006.pdf for additional information.
File #1: Land_use_species_composition.csv
This data file is a comparison of the termite species composition of low- and high-diversity agroforestry systems with primary forest (Ackerman et al. 2009).
| Column Descriptions | |
| Column 1, Sample_ID: Sample identification composed of a letter code for landuse, the transect identification number ( 1-3) and the transect section number (1-10) | |
| Column 2, Land_use: Dominant land use in the sampling area: Home garden agroforest, Palm-based agroforest or Primary forest | |
| Column 3, Transect_num: Transect identification number within each sampling site | |
| Columns 4 through 70 represent the presence (1) or absence (0) of the termite species named in the column heading | |
| Column | Heading |
|---|---|
| 1 | Sample_ID |
| 2 | Land_use |
| 3 | Transect_num |
| 4 | Agnathotermes_glaber |
| 5 | Amitermes_excellens |
| 6 | Angularitermes_sp |
| 7 | Anhangatermes_macarthuri |
| 8 | Anoplotermes_banksi |
| 9 | Anoplotermes_sp_06 |
| 10 | Anoplotermes_sp_07 |
| 11 | Anoplotermes_sp_09 |
| 12 | Anoplotermes_sp_18 |
| 13 | Armitermes_holmgreni |
| 14 | Atlantitermes_snyderi |
| 15 | Cornicapritermes_mucronatus |
| 16 | Cylindrotermes_parvignathus |
| 17 | Dihoplotermes_sp |
| 18 | Dolichorhinotermes_cf_longilabius |
| 19 | Genuotermes_spinifer |
| 20 | Nasutitermes_sp |
| 21 | Nasutitermes_major |
| 22 | Neocapritermes_talpa |
| 23 | Neocapritermes_unicornis |
| 24 | Orthognathotermes_humilis |
| 25 | Rotunditermes_bragantinus |
| 26 | Ruptitermes_sp_01 |
| 27 | Ruptitermes_sp_02 |
| 28 | Termes_fatalis |
| 29 | Termes_medioculatus |
| 30 | Anoplotermes_sp_05 |
| 31 | Anoplotermes_sp_16 |
| 32 | Embiratermes_cf_brevinasus |
| 33 | Nasutitermes_acangassu |
| 34 | Nasutitermes_guayanae |
| 35 | Nasutitermes_macrocephalus |
| 36 | Rhinotermes_marginalis |
| 37 | Spinitermes_trispinosus |
| 38 | Araujotermes_parvellus |
| 39 | Paraconvexitermes_junceus |
| 40 | Crepititermes_verruculosus |
| 41 | Nasutitermes_surinamensis |
| 42 | Neocapritermes_pumilis |
| 43 | Velocitermes_n_sp |
| 44 | Anoplotermes_sp_15 |
| 45 | Atlantitermes_sp |
| 46 | Coptotermes_testaceus |
| 47 | Labiotermes_pelliceus |
| 48 | Nasutitermes_similis |
| 49 | Neocapritermes_angusticeps |
| 50 | Neocapritermes_braziliensis |
| 51 | Anoplotermes_sp_04 |
| 52 | Anoplotermes_sp_10 |
| 53 | Anoplotermes_sp_13 |
| 54 | Anoplotermes_sp_19 |
| 55 | Anoplotermes_sp_20 |
| 56 | Neocapritermes_taracua |
| 57 | Planicapritermes_planiceps |
| 58 | Cyrilliotermes_angulariceps |
| 59 | Armitermes_peruanus |
| 60 | Orthognathotermes_cf_brevipilosus |
| 61 | Syntermes_molestus |
| 62 | Anoplotermes_sp_12 |
| 63 | Anoplotermes_sp_11 |
| 64 | Anoplotermes_sp_02 |
| 65 | Cornitermes_pugnax |
| 66 | Anoplotermes_sp_01 |
| 67 | Anoplotermes_sp_17 |
| 68 | Anoplotermes_sp_03 |
| 69 | Anoplotermes_sp_14 |
| 70 | Heterotermes_tenuis |
Example data records
|
Sample_ID,Land_use,Transect_num,Agnathotermes_glaber,Amitermes_excellens,Angularitermes_sp,Anhangatermes_macarthuri, Anoplotermes_banksi,Anoplotermes_sp_06,Anoplotermes_sp_07,Anoplotermes_sp_09,Anoplotermes_sp_18,Armitermes_holmgreni,Atlantitermes_snyderi, Cornicapritermes_mucronatus, Cylindrotermes_parvignathus,Dihoplotermes_sp,Dolichorhinotermes_cf_longilabius,Genuotermes_spinifer,Nasutitermes_sp,Nasutitermes_major, Neocapritermes_talpa,Neocapritermes_unicornis,Orthognathotermes_humilis,Rotunditermes_bragantinus,Ruptitermes_sp_01,Ruptitermes_sp_02,Termes_fatalis, Termes_medioculatus,Anoplotermes_sp_05,Anoplotermes_sp_16,Embiratermes_cf_brevinasus,Nasutitermes_acangassu,Nasutitermes_guayanae,Nasutitermes_macrocephalus, Rhinotermes_marginalis,Spinitermes_trispinosus,Araujotermes_parvellus,Paraconvexitermes_junceus,Crepititermes_verruculosus,Nasutitermes_surinamensis, Neocapritermes_pumilis, Velocitermes_n_sp,Anoplotermes_sp_15,Atlantitermes_sp,Coptotermes_testaceus,Labiotermes_pelliceus,Nasutitermes_similis, Neocapritermes_angusticeps, Neocapritermes_braziliensis,Anoplotermes_sp_04,Anoplotermes_sp_10,Anoplotermes_sp_13,Anoplotermes_sp_19,Anoplotermes_sp_20, Neocapritermes_taracua, Planicapritermes_planiceps,Cyrilliotermes_angulariceps,Armitermes_peruanus,Orthognathotermes_cf_brevipilosus, Syntermes_molestus,Anoplotermes_sp_12,Anoplotermes_sp_11, Anoplotermes_sp_02,Cornitermes_pugnax,Anoplotermes_sp_01,Anoplotermes_sp_17, Anoplotermes_sp_03,Anoplotermes_sp_14,Heterotermes_tenuis HGA11,Home garden agroforest,1,0,0,0,0,0,0,0,0,0,0,0, 0,0,0,0,0,0,0,0,0,0,0,0,0,0,0,0,0,0,0,0,0,0,0,0,0,0,0,0,0,0,0,0,0,0,0,0,0,0,0,0,0,1,0,0,0,0,0,0,0,0,0,1,0,0,0,0 ... PBA11,Palm-based agroforest,1,0,0,0,0,0,1,0,0,0,0,0,0,0,0,0,0,0,0,0,0,0,0,0,0,0,0,0,0,0,0,0,0,0,0,0,0,0,0,0,0,0,0,0,0,0,0,0,0,0,0,0,0,1,0,0,0,1,0,0,0,0,0,0,0,0,0,0 ... PF310,Primary forest,3,0,0,0,0,0,1,0,0,0,0,0,0,0,0,0,0,0,0,0,0,0,0,0,0,0,0,0,0,0,0,0,0,0,1,0,0,1,0,0,0,0,0,0,0,0,0,0,0,0,0,0,0,1,0,0,0,1,0,0,0, 0,0,0,0,0,0,1 |
File #2: Termite_mound_area_and_abundance.csv
Termite mound abundance and area covered (density) were determined at the secondary forest site in April of 2000.
| Column | Heading | Units/format | Description |
|---|---|---|---|
| 1 | Land_use | Dominant land use at the sampling site: Secondary forest | |
| 2 | Transect_ID | Transect line identification: transects were line transects, spaced 20 m apart, perpendicular to the access road (Figure 1); transects were varied in length, ending at the edge of the plateau | |
| 3 | Object | Identification of the type of object located along the transect (log, stump, mound, or a combination) | |
| 4 | Label | Unique identification label for each object along the transect | |
| 5 | Distance | m | Distance from the access road in meters (m) |
| 6 | Direction | Location of the object relative to the transect, i.e. East or West of the transect | |
| 7 | Lateral | Distance east or west of the transect line to the highest point of the object in centimeters (cm) | |
| 8 | Shape | Approximate geometric shape of the measured object: circle, cylinder, linear, oval, rectangle, square or triangle | |
| 9 | Length | cm | Measured length of the longest axis of the object in centimeters (cm) |
| 10 | Width | cm | Measured length of the axis perpendicular to the longest axis of the object in centimeters (cm) |
| 11 | Percent_in | % | Percentage of the object's area that falls within the area of the transect |
| 12 | Area_tot | m2 | Total surface area of the object in meters squared (m2) based on the measured axis and estimated geometric shape |
| 13 | Area_in | m2 | Surface area of the object within the transect in meters squared (m2) calculated as the total surface area multiplied by the percent in transect |
| 14 | Mound_type | Primarily an indication of mound color | |
| 15 | Burrows | Number of observed armadillo burrows | |
| 16 | Burnt | Observed indications of burning | |
| 17 | Mound_association | Features associated with the termite mound (log, stump, tree) | |
| Missing data values indicated as -9999 | |||
Example data records
|
Land_use,Transect_ID,Object,Label,Distance,Direction,Lateral,Shape,Length,Width,Percent_in, Area_tot,Area_in,Mound_type,Burrows,Burnt,Mound_association Secondary forest,B,mound,126,10.16,West,46,circle,64,52,100, 0.26,0.26,gray,0,no,burnt stump Secondary forest,B,mound,127,13.38,West,143,rectangle,87,35,50, 0.3,0.15,lt. gray,0,no,burnt log Secondary forest,B,mound,16,18.06,East,83,rectangle,120,48,100, 0.58,0.58,gray,0,no,not recorded ... Secondary forest,E,log,-9999,78.66,West,66,rectangle,568,15,30 ,0.85,0.26,not applicable,-9999,not recorded,not recorded Secondary forest,E,log,mound,173,73.69,East,60.circle,26,22,100, 0.05,0.05,gray,0,no,stump Secondary forest,E,log,-9999,71.65,East,18,rectangle,1627,38,15, 6.18,0.93,not applicable,-9999,not recorded,not recorded ... Secondary forest,I,mound,182,54.7,West,82,oval,185,24,50, 0.44,0.22,-9999,0,no,not recorded Secondary forest,I,mound,183,53.95,East,106,oval,35,28,50 0.1,0.05,-9999,0,yes,stump Secondary forest,I,stump,-9999,6-9999,West,-9999,circle,18,16,100, 0.02,0.02,not applicable,-9999,not recorded,not recorded |
File #3: Termite_mound_N_mineralization.csv
Termite mounds and control sites were sampled at the secondary forest site for nitrogen mineralization determinations.
| Column | Heading | Units/format | Description |
|---|---|---|---|
| 1 | Land_use | Dominant land use at the sampling site: Secondary forest | |
| 2 | Location_ID | Sampling location id | |
| 3 | Field_treatment | Sampling location: Termite mound, Control soil (adjacent to termite mound) | |
| 4 | Soil_moisture | Samples were maintained at field moisture content (Normal) or at 110% of field moisture content (Elevated) over the course of the measurements | |
| 5 | Aggregation | Samples were either left physically Intact or Broken by hand into equal-sized granules | |
| 6 | Day | Day since inception of the experiment | |
| 7 | Total_N | g N/kg | Total soil N measured in grams of nitrogen per kilogram of soil |
| 8 | NO3 | ug NO3/g | Extractable nitrate in the soil measured in micrograms of nitrate per gram of soil (ug NO3 / g soil) on a Skalar continuous flow analyzer after extraction with KCl |
| 9 | NH4 | ug NH4/g | Extractable ammonium in the soil measured in micrograms of ammonium per gram of soil (ug NH4/g ) on a Skalar continuous flow analyzer after extraction with KCl |
| 10 | NO3_min_rate | ug NO3/g N/day | Rate of nitrate mineralization reported over 66 days as micrograms of nitrate mineralized per gram of total soil nitrogen per day (ug NO3 per g N per day) |
| 11 | NH4_min_rate | ug NH/g N/day | Rate of ammonium mineralization reported over 66 days as micrograms of ammonium mineralized per gram of total soil nitrogen per day (ug NH4 per g N per day) |
Example data records
|
Land_use,Location_ID,Field_treatment,Soil_moisture,Aggregation,Day,Total_N,NO3,NH4,NO3_min_rate,NH4_min_rate Secondary forest,6,Termite mound,Normal,Intact,0,2.26,3.06,2.5,1.35,3.38 Secondary forest,6,Termite mound,Normal,Broken,0,2.34,3.88,2.8,1.66,3.5 Secondary forest,6,Termite mound,Elevated,Intact,0,2.22,11.64,1.73,5.25,3.26 ... Secondary forest,174,Termite mound,Normal,Intact,8,3.09,6.41,11.5,2.08,3.6 Secondary forest,174,Termite mound,Normal,Broken,8,3.06,6.41,11.65,2.26,3.64 Secondary forest,174,Termite mound,Normal,Intact,8,2.75,6.1,3.03,2.22,3.19 ... Secondary forest,174,Control soil,Normal,Broken,66,2.72,53.7,3.38,19.72,2.94 Secondary forest,174,Control soil,Elevated,Intact,2.06,51.95,2.22,25.24,2.71 Secondary forest,174,Control soil,Elevated,Broken,2.06,55.09,1.75,26.68,2.46 |
File #4: Termite_mound_root_density.csv
Root biomass samples were collected at the secondary forest site in June 2001.
| Column | Heading | Units/format | Description |
|---|---|---|---|
| 1 | Land_use | Dominant land use at the sampling site: Secondary forest | |
| 2 | Location_ID | Sampling location identification number | |
| 3 | Field_treatment | Sampling location: Termite mound or Control soil (adjacent to termite mound) | |
| 4 | Cylinder_number | Unique soil sample cylinder ID | |
| 5 | Vegetation | Plant ID based on root identification: Vismia or unidentified | |
| 6 | Root_density | g/cm3 | Total root biomass density in grams dried roots per centimeter cubed (g/cm3) measured to a depth of 5 centimeters |
Example data records
|
Land_use,Location_ID,Field_treatment,Cylinder_number,Vegetation,Root_density Secondary forest,105,Termite mound,44,Vismia,0.0006 Secondary forest,108,Termite mound,45,unidentified,0.0004 Secondary forest,116,Termite mound,32,Vismia,0.0002 ... Secondary forest,156,Termite mound,38,unidentified,0.0011 Secondary forest,6,Termite mound,31,Vismia,0.0015 Secondary forest,138,Termite mound,155,Vismia,0.0017 ... Secondary forest,136,Control soil,147,Vismia,0.0043 Secondary forest,134,Control soil,48,Vismia,0.0028 Secondary forest,69,Burnt mound,27,Vismia,0.0003 |
File #5: Termite_mound_seedling_experiment.csv
Soil cores were collected in 100 cm3 stainless steel cylinders from the secondary forest site. The material was ground to a texture favorable to seedling development.
| Column | Heading | Description |
|---|---|---|
| 1 | Experiment_ID | Data from two separate experiments are reported here; each experiment is identified by a label (II or IVE) |
| 2 | Soil_type | Sampling location: Termite mound or Control soil (adjacent to termite mound) |
| 3 | Mechanical_treatment | Soil cores were either Ground or left Intact |
| 4 | Allelopathy_treatment | Treated samples were autoclaved, while control samples were untreated (not autoclaved) |
| 5 | Acidity_treatment | In the treated soils acidity was buffered with a lime addition (20 mg per sample for the ground soils and 12 mg per sample for the intact samples). Control soils were not treated |
| 6 | Rep | Replicate identification number |
| 7 | EVI | Emergence velocity index for the seedlings calculated according to Mendonça (1997) (unitless) |
Example data records
|
Experiment_ID,Soil_type,Mechanical_treatment,Allelopathy_treatment,Acidity_treatment,Rep,EVI II,Termite mound,Intact,autoclaved,treated,1,1.5 II,Termite mound,Intact,autoclaved,treated,2,0.31 II,Termite mound,Intact,autoclaved,treated,3,1.42 ... IVE,Termite mound,Intact,not autoclaved,control,1,0.17 IVE,Termite mound,Intact,not autoclaved,control,2,0.07 IVE,Termite mound,Intact,not autoclaved,control,3,0 ... IVE,Control soil,Ground,not autoclaved,control,18,0.08 IVE,Control soil,Intact,not autoclaved,control,19,0.39 IVE,Control soil,Intact,not autoclaved,control,20,0 |
File 6. Microbial_groups.csv
Termite mounds were randomly selected from the secondary forest site for sampling for microbial group determination.
| Column | Heading | Units/format | Description |
|---|---|---|---|
| 1 | Land_use | Dominant land use in the sampling area: 7-8 year old Secondary forest | |
| 2 | Field_treatment | Sampling location: Termite mound or Control soil (adjacent to termite mound) | |
| 3 | Sample_no | Sample number: 1 - 5 | |
| 4 | Sample_wet_wt | g | Weight of sample at field moisture in grams (g) |
| 5 | Sample_dry_wt | g | Weight of sample after drying in an oven at 105 degrees C in grams (g) |
| 6 | Water_wt | g | Weight of water in sample under field moisture conditions in grams (g) |
| 7 | GWC | % | Gravimetric soil content (%) calculated as water weight divided by sample dry weight |
| 8 | Dilution | Dilution factor of sample in water for analysis | |
| 9 | Lab_rep | Replicate number | |
| 10 | Color | Color of the Sarathchandra's medium after a 5 day incubation | |
| 11 | Ammonifiers | Presence or absence of ammonifiers in the sample: 0 indicates absence and 1 indicates presence | |
| 12 | Cellulose_decomposers | Presence or absence of cellulose decomposers in the sample: 0 indicates absence and 1 indicates presence |
Example data records
|
Land_use,Field_treatment,Sample_no,Sample_wet_wt,Sample_dry_wt,Water_wt,GWC,Dilution,Lab_rep,Color, Ammonifiers,Cellulose_decomposers Secondary forest,Termite mound,1,10,7.599,2.401,0.32,1000,1,pink, 1,1 Secondary forest,Termite mound,1,10,7.599,2.401,0.32,1000,2,yellow, 1,1 Secondary forest,Termite mound,1,10,7.599,2.401,0.32,1000,3,yellow, 1,1 Secondary forest,Termite mound,1,10,7.599,2.401,0.32,10000,1,yellow, ... Secondary forest,Control soil,5,10,7.384,2.616,0.35,10000000,1,gold, 0,0 Secondary forest,Control soil,5,10,7.384,2.616,0.35,10000000,2,gold, 0,0 Secondary forest,Control soil,5,10,7.384,2.616,0.35,10000000,3,rose, 1,0 |
File #7: Soda_lime_data.csv
Termite mounds were selected randomly at the secondary forest study site for soda lime assessment of soil respiration.
| Column | Heading | Units/format | Description |
|---|---|---|---|
| 1 | Land_use | Dominant land use at the sampling site: Pasture or Secondary forest | |
| 2 | Location_ID | Termite mound identfication code: 6, 146, or 178 | |
| 3 | Field_treatment | Sampling location: Termite mound, Control soil (adjacent to termite mound), or "Blank" | |
| 4 | Litter | For the control soil samples, one replicate retained surface litter (1) while the other did not (0) | |
| 5 | Rep | Replicate number: 1 - 8 | |
| 6 | Date_start | yyyymmdd | Date the soda lime was inserted (yyyymmddd) |
| 7 | Time_start | hh:mm | Time of day the soda lime was inserted reported as hh:mm |
| 8 | Date_end | yyyymmdd | Date the soda lime was removed (yyyymmdd) |
| 9 | Time_end | hh:mm | Time of day the soda lime was removed reported as hh:mm |
| 10 | Total_time | days | Total length of time the soda lime was exposed in days |
| 11 | Weight_start | g | Weight of the soda lime prior to exposure reported in grams (g) |
| 12 | Weight_end | g | Weight of the soda lime after exposure reported in grams (g) |
| 13 | CO2_stored_gross | g CO2 | Amount of CO2 stored in the soda lime in grams calculated as the difference between weight start and weight end reported in grams (g) |
| 14 | CO2_stored_corrected | g CO2 | Amount of CO2 stored in the soda lime in grams minus any CO2 stored in the blank reported in grams (g) |
| 15 | CO2_C_stored | g CO2-C | Amount of carbon as CO2 stored in the soda lime based on the blank corrected calculation of CO2 stored reported in grams (g) |
| 16 | CO2_C_water_corrected | g CO2-C | Amount of carbon as CO2 stored in the soda lime corrected with the Grogan correction for water formed reported in grams (g) |
| 17 | CO2_C_emission_chamber | g CO2-C/day | Amount of carbon emitted as CO2 per day in the chamber (g CO2-C/day) |
| 18 | CO2_C_emission_per_m2 | g CO2-C/day/m2 | Amount of carbon emitted as CO2 per day divided by the area of the chamber (g CO2-C/day/m2) |
| Missing data or data not reported are represented by -9999 | |||
Example data records
|
Land_use,Location_ID,Field_treatment,Litter,Rep,Date_start,Time_start,Date_end,Time_end,
Total_time, Weight_start,Weight_end,CO2_stored_gross,CO2_stored_corrected,CO2_C_stored,CO2_C_water_corrected,CO2_C_emission_chamber,CO2_C_emission_per_m2 Secondary forest,-9999,Termite mound,0,1,20020624,14:03,20020625,14:11,1.006, 79.663,81.643,1.98,1.526,0.416,0.703,0.699,22.265 Secondary forest,-9999,Control soil,1,1,20020624,14:06,20020625,14:12,1.004, 82.969,84.834,1.865,1.411,0.385,0.65,0.648,20.615 Secondary forest,-9999,Control soil,0,1,20020624,14:09,20020625,14:12,1.002, 75.743,77.993,2.25,1.796,0.49,0.828,0.826,26.295 ... Secondary forest,6,Termite mound,0,2,20020617,14:24,20020618,14:24,1, 96.02,97.9,1.785,1.724,0.47,0.795,0.795 Secondary forest,6,Control soil,1,2,20020617,14:25,20020618,14:24,0.999, 82.463,84.4,1.842,1.781,0.486,0.821,0.821 Secondary forest,6,Control soil,0,2,20020617,14:26,20020618,14:24,0.999, 81.371,83,1.534,1.473,0.402,0.679,0.68 ... Secondary forest,-9999,Control soil,0,8,20020605,14:25,20020606,13:44,0.972 80.486,81.1,1.762,0.897,0.245,0.413,0.426,13.546 Secondary forest,-9999,Blank,-9999,1,-9999,-9999,-9999,-9999,-9999,-9999,-9999, 79.83,78.1,0.546,-9999,-9999,-9999,-9999,-9999 Secondary forest,-9999,Blank,-9999,2,-9999,-9999,-9999,-9999,-9999,-9999,-9999, 76.478,75.1,0.865,-9999,-9999,-9999,-9999,-9999 |
File #8: Termite_mound_soil_chemistry_and_respiration.csv
The soil chemistry samples were collected in May 2000 at the secondary forest site.
| Column | Heading | Units/format | Description |
|---|---|---|---|
| 1 | Land_use | Dominant land use at the sampling site: Secondary forest | |
| 2 | Field_treatment | Sampling location: Termite mound or Control soil (adjacent to termite mound) | |
| 3 | Replicate | Replicate identification number | |
| 4 | Lab_treatment | Sieved soil (normal) or aggregate | |
| 5 | Basal_respiration | ul/h/g Control soil | Basal respiration rate calculated as ul of CO2 per hour per gram of control soil (adjacent to termite mound) |
| 6 | Basal_resp_C_rate | ul/h/g C | Basal respiration rate calculated as ul of CO2 per hour per gram of carbon in the control soil |
| 7 | SIR | ul/h/g Control soil | Substrate-induced respiration rate calculated as ul of CO2 per hour per gram of control soil |
| 8 | SIR_C_rate | ul/h/g C | Substrate-induced respiration rate calculated as ul of CO2 per hour per gram of carbon in the control soil |
| 9 | Microbial_C | ug C/g Control soil | Microbial biomass carbon pool calculated according to Anderson and Domsch (1978), reported as ug C/g Control soil |
| 10 | Cmic/Corg | Ratio of microbial biomass carbon to total soil organic carbon | |
| 11 | QR | Metabolic quotient calculated as the ratio of basal respiration rate to substrate induced respiration rate | |
| 12 | Q_BR | Metabolic quotient measured as the ratio of basal respiration rate to soil microbial biomass | |
| 13 | Q_SIR | Metabolic quotient measured as the ratio of substrate induced respiration rate to soil microbial biomass | |
| 14 | C_N_soil | Soil carbon to nitrogen ratio calculated on a mass basis | |
| 15 | pH | Soil pH | |
| 16 | P | g/kg | Available soil phosphorus extracted using a double-acid solution of 0.05 N hydrochloric acid and 0.025 N sulfuric acid reported in grams P per kilogram soil (g/kg) |
| 17 | K | g/kg | Available soil potassium extracted using a double-acid solution of 0.05 N hydrochloric acid and 0.025 N sulfuric acid reported in grams K per kilogram soil (g/kg) |
| 18 | Na | g/kg | Exchangeable soil sodium extracted with 1 N potassium chloride measured in grams Na per kilogram soil (g/kg) |
| 19 | Ca | g/kg | Exchangeable soil calcium extracted with 1 N potassium chloride reported in grams Ca per kilogram soil (g/kg) |
| 20 | Mg | g/kg | Exchangeable soil magnesium extracted with 1 N potassium chloride reported in grams Mg per kilogram soil (g/kg) |
| 21 | Al | g/kg | Exchangeable soil aluminum extracted with 1 N potassium chloride reported in grams Al per kilogram soil (g/kg) |
| 22 | H_Al | g/kg | Total soil hydrogen and aluminum ion concentration measured in grams Al + H per kilogram soil (g/kg) |
| 23 | N | g/kg | Total soil nitrogen determined by the Kjeldahl technique reported in grams N per kilogram soil (g/kg) |
| 24 | C | g/kg | Total soil carbon determined by the Walkley-Black method and reported in grams C per kilogram soil (g/kg) |
| 25 | Fe | g/kg | Extractable soil iron extracted with a Mehlich 1 solution in a 1:5 ratio and reported in grams Fe per kilogram soil (g/kg) |
| 26 | Zn | g/kg | Extractable soil zinc extracted with a Mehlich 1 solution in a 1:5 ratio and reported in grams Zn per kilogram soil (g/kg) |
| 27 | Mn | g/kg | Extractable soil manganese extracted with a Mehlich 1 solution in a 1:5 ratio and reported in grams Mn per kilogram soil (g/kg) |
| 28 | Cu | g/kg | Extractable soil copper extracted with a Mehlich 1 solution in a 1:5 ratio and reported in grams Cu per kilogram soil (g/kg) |
| Missing data is indicated by -9999 | |||
Example data records
|
Land_use,Field_treatment,Replicate,Lab_treatment,Basal_respiration,Basal_resp_C_rate,SIR,SIR_C_rate, Microbial_C,Cmic/Corg,QR,Q_BR,Q_SIR,C_N_soil,pH,P,K,Na,Ca,Mg,Al,H_Al,N,C,Fe,Zn,Mn,Cu Secondary forest,Termite mound,14,normal,0.7,19.5,4.1,114.08, 136.6,0.0038,0.17,0.0051,0.03,16.9,4.43,4.8,22,4,0.08,0.04,2.17,12.76,2.13,35.97,200,34.23,0.53,0.17 Secondary forest,Termite mound,16,normal,1.06,30.06,3.84,108.98, 111.7,0.0032,0.28,0.0095,0.034,16.8,4.39,5.5,22,4,0.01,0.04,1.87,10.51,2.1,35.25,233,19.57,0.43,0.24 Secondary forest,Termite mound,6,normal,1.73,48.28,3.64,101.55, 76.7,0.0021,0.48,0.0225,0.047,12.4,4.45,3.4,22,5,0.08,0.04,1.97,11.73,2.89,35.8,256,23.2,0.68,0.2 ... Secondary forest,Control soil,14,normal,1.24,47.76,5,192.63, 150.9,0.0058,0.25,0.0082,0.033,14.3,4.49,2.1,20,5,0.12,0.09,1.23,7.41,1.82,25.95,206,30.48,1.84,0.44 Secondary forest,Control soil,16,normal,0.98,48.94,4.38,219.32, 136.6,0.0068,0.22,0.0072,0.032,14.4,4.31,2.7,14,4,0.05,0.05,1.08,6.3,1.39,19.97,172,24.35,0.84,0.31 Secondary forest,Control soil,6,normal,1.06,53.36,3.44,172.57, 95.4,0.0048,0.31,0.0111,0.036,13.7,4.33,2.1,14,4,0.16,0.06,1.24,6.63,1.46,19.91,230,4.3,1.53,0.13 |
File #9: Termite_mound_soil_physical_characteristics.csv
The soil water content samples were collected on July 13, 2000 from the secondary forest site and on September 4 and 5, 2000 from the pasture site.
| Column | Heading | Units/format | Description |
|---|---|---|---|
| 1 | Land_use | Dominant land use at the sampling site: Pasture or Secondary forest | |
| 2 | Location_ID | Sampling location id (see attached documentation for georeferences) | |
| 3 | Field_treatment | Sampling location: Termite mound or Control soil (adjacent to termite mound) | |
| 4 | Cylinder | Unique cylinder ID for bulk density sampling | |
| 5 | Bulk_density | g/cm3 | Soil bulk density in grams per centimeter cubed (g/cm3) calculated after drying soil overnight in a 110 degree oven |
| 6 | VWC | % | Volumetric soil water content (%) calculated as the volume of water divided by the total sample volume |
| 7 | GWC | % | Gravimetric soil water content (%) calculated as the fresh soil weight minus the dry soil weight divided by the fresh soil weight |
| Missing data reported as -9999 | |||
Example data records
|
Land_use,Location_ID,Field_treatment,Cylinder,Bulk_density,VWC,GWC Secondary forest,36,Termite mound,169,1.07,0.39,0.36 Secondary forest,36,Termite mound,170,0.93,0.32,0.35 Secondary forest,36,Termite mound,171,0.91,0.29,0.32 ... Secondary forest, 89, Termite mound, 153 0.94, 0.36, 0.39, Secondary forest, 89, Termite mound, 155 0.93, 0.41, 0.44, Secondary forest, 89, Termite mound, 156 0.92, 0.34, 0.37, ... Pasture,53,Termite mound,-9999,1.11,0.27,0.12 Pasture,53,Control soil,-9999,1.06,0.34,0.14 Pasture,53,Control soil,-9999,1.17,0.28,0.12 |
File #10: Soil_hydrophobicity.csv
The soil hydrophobicity samples were collected in May of 2001 from the secondary forest site.
| Column | Heading | Units/format | Description |
|---|---|---|---|
| 1 | Land_use | Dominant land use at the sampling site: Secondary forest | |
| 2 | Field_treatment | Sample type: Termite mound, Burnt mound (termite mound with evidence of recent burning) or Control soil (adjacent to termite mound) | |
| 3 | Sample_no | Laboratory sample number: 1 - 16 | |
| 4 | Initial_weight | g sample | Weight of sample at start of experiment in grams (g) |
| 5 | Weight_15s | g sample | Weight of sample after 15 seconds of water exposure in grams (g) |
| 6 | Weight_30s | g sample | Weight of sample after 30 seconds of water exposure in grams (g) |
| 7 | H2O_absorb_15s | g H2O | Amount of water absorbed by sample after 15 seconds in grams (g) calculated as sample weight after 15 seconds of exposure minus initial sample weight |
| 8 | H2O_absorb_30s | g H2O | Amount of water absorbed by sample after 30 seconds in grams (g) calculated as sample weight after 30 seconds of exposure minus initial sample weight |
| 9 | Absorption_rate_15s | g H2O/min | Rate of water absorption in grams of water per minute calculated as amount of water absorbed after 15 seconds divided by total time in minutes |
| 10 | Absorption_rate_30s | g H2O/min | Rate of water absorption in grams of water per minute calculated as amount of water absorbed after 30 seconds divided by total time in minutes |
| Missing data are reported as -9999 | |||
Example data records
|
Land_use,Field_treatment,Sample_no,Initial_weight,Weight_15s,Weight_30s,H2O_absorb_15s,H2O_absorb_30s, Absorption_rate_15s,Absorption_rate_30s Secondary forest,Termite mound,1,9.022,9.088,9.155,0.066,0.133, 0.264,0.177 Secondary forest,Termite mound,2,12.324,12.404,12.468,0.08,0.144, 0.32,0.192 Secondary forest,Termite mound,3,9.899,9.93,9.986,0.031,0.087, 0.124,0.116 ... Secondary forest,Control soil,14,6.799,7.753,8.158,0.954,1.359, 3.816,1.812 Secondary forest,Control soil,15,9.252,11.417,12.272,2.165,3.02, 8.66,4.027 Secondary forest,Control soil,16,6.829,7.92,8.231,1.091,1.402, 4.364,1.869 ... Secondary forest,Burnt mound,14,9.231,10.102,10.884,0.871,1.653, 3.484,2.204, Secondary forest,Burnt mound,15,8.217,8.984,9.834,0.767,1.617, 3.068,2.156 Secondary forest,Burnt mound,16,5.446,6.38,7.377,0.934,1.931, 3.736,2.575 |
File #11: Soil_infiltration.csv
Soil infiltration samples were collected September 5, 2000 at the secondary forest site.
| Column | Heading | Units/format | Description |
|---|---|---|---|
| 1 | Land_use | Dominant land use at the sampling site: Secondary forest | |
| 2 | Location_ID | Sampling location id (see attached documentation for georeferences) | |
| 3 | Field_treatment | Sampling location: Termite mound, Control soil (adjacent to termite mound) | |
| 4 | Infiltration_rate | L/min/m2 | Rate of infiltration of water into the soil measured in liters per minute per meter squared (L/min/m2) |
Example data records
|
Land_use,Location_ID,Field_treatment,Infiltration_rate Secondary forest,36,Termite mound,6.6 Secondary forest,36,Control,4.5 Secondary forest,8,Termite mound,8.8 Secondary forest,8,Control,1.2 Secondary forest,17,Termite mound,45.2 Secondary forest,17,Control,1.7 Secondary forest,13,Termite mound,36.8 Secondary forest,13,Control,5.4 Secondary forest,32,Termite mound,1.2 Secondary forest,32,Control,0.8 Secondary forest,89,Termite mound,1.5 Secondary forest,89,Control,1.6 Secondary forest,91,Termite mound,9.5 Secondary forest,91,Control,3.5 Secondary forest,1,Termite mound,35.6 Secondary forest,1,Control,8.4 Secondary forest,65,Termite mound,14.4 Secondary forest,65,Control,0.6 |
File #12: Soil_resistance_all.csv
Soil resistance to penetration was measured in the secondary forest site on August 2, 2000 and in the pasture site on September 5, 2000.
| Column | Heading | Units/format | Description |
|---|---|---|---|
| 1 | Date | yyyymmdd | Sampling date |
| 2 | Land_use | Dominant land use in the sampling area: Pasture or Secondary forest | |
| 3 | Location_ID | Sampling location ID (see attached documentation for georeferences) | |
| 4 | Field_treatment | Sampling location: Termite mound, Control soil (adjacent to termite mound) | |
| 5 | Depth | cm | Sampling depth in centimeters (cm) |
| 6 | Penetrometer_reading | Direct reading from penetrometer | |
| 7 | Resistance | kgf/cm2 | Calculated resistance in kilograms of force per centimeter squared |
| 8 | Observations | Field notes |
Example data records
|
Date,Land_use,Location_ID,Location,Depth,Manometer_reading,Resistance in kgf/cm2,Observations 2000/09/05,Pasture,26,Termite mound,5,500,500,greater than 500; in sun 2000/09/05,Pasture,26,Termite mound,5,500,500,greater than 500; in sun 2000/09/05,Pasture,26,Termite mound,5,500,500,greater than 500; in sun ... 20000802,Secondary forest,other 53,Control soil,5,90,45,not recorded 20000802,Secondary forest,other 53,Control soil,5,150,75,not recorded 20000802,Secondary forest,other 53,Control soil,5,10,5,not recorded |
File #13: Soil_texture_all.csv
Soil texture samples were collected in May 2000 at the secondary forest and August 4, 2000 at the pasture sites.
| Column | Heading | Units/format | Description |
|---|---|---|---|
| 1 | Year | yyyy | Sample collection year (yyyy) |
| 2 | Month | mm | Sample collection month (mm) |
| 3 | Day | dd | Sample collection day of the month (dd) or "not reported" |
| 4 | Land_use | Dominant land use at the sampling site: Pasture or Secondary forest; either sampled directly from the termite mound, or control soil within 1.5 meters of the mound | |
| 5 | Location_ID | Transect location ID (for pasture sites only) | |
| 6 | Field_treatment | Sampling location: Termite mound or Control soil (within 1.5 meters of the mound) | |
| 7 | Sample_ID | Sample identification number | |
| 8 | Coarse_sand | % | Percent of soil classified as coarse sand (diameter between 0.5 and 2 mm) on a weight basis in percent (%) |
| 9 | Fine_sand | % | Percent of soil classified as fine sand (diameter between 0.1 and 0.5 mm) on a weight basis in percent (%) |
| 10 | Total_sand | % | Percent of soil classified as sand (diameter between 0.1 and 2.0 mm) on a weight basis in percent (%) |
| 11 | Silt | % | Percent of soil classified as silt (diameter between 0.002 and 0.05 mm on a weight basis in percent (%) |
| 12 | Clay | % | Percent of soil classified as clay (diameter less than 0.002 mm) on a weight basis in percent (%) |
| 13 | Comments | Field notes |
Example data records
|
Year,Month,Day,Land_use,Location_ID,Field_treatment,Sample_ID,Coarse_sand,Fine_sand ,Total_sand,Silt,Clay,Comments 2000,05,not reported,Secondary forest,not reported,Termite mound,2487,4.4,1.5,5.9,14.6,79.5,none 2000,05,not reported,Secondary forest,not reported,Control soil ,2488,3.6,1.4,5.1,21.3,73.7,none 2000,05,not reported,Secondary forest,not reported,Termite mound,2489,3.6,1.7,5.3,14.5,80.2,none ... 2000,08,04,Pasture,C26,Termite mound,2766,7.2,1,8.2,21,70.8,very clayey 2000,08,04,Pasture,C27,Termite mound,2767,10.7,2.5,13.2,17.8,68.9,very clayey 2000,08,04,Pasture,C35,Termite mound,2768,9,3.3,12.3,16.7,71,very clayey ... 2000,08,04,Pasture,C52,Control soil,2779,9.1,2.5,11.6,25.8,62.7,very clayey 2000,08,04,Pasture,C53,Control soil,2780,11.9,2.3,14.3,27,very clayey 2000,08,04,Pasture,C54,Control soil,2781,9.4,2.7,12.1,21.9,21.9,very clayey |
File #14: Water_retention_curve_data.csv
The water retention samples were collected from control soils, termite, and burnt termite mounds in the secondary forest site.
| Column | Heading | Units/format | Description |
|---|---|---|---|
| 1 | Land_use | Dominant land use in the sampling area (all data in this file are from Secondary forest) | |
| 2 | Sample_ID | Sample identification code for laboratory purposes | |
| 3 | Field_treatment | Sample type: Termite mound, Burnt mound (termite mound with evidence of recent burning) or Control soil (adjacent to termite mound) | |
| 4 | Burnt | Evidence of recent burning at field site, yes or no | |
| 5 | Pressure | pF | Pressure in pF |
| 6 | dry_wt | g | Sample dry weight in grams (g) |
| 7 | Water_wt | g | Weight of water absorbed by sample in grams (g) |
| 8 | GWC | Gravimetric water content calculated as water weight divided by sample dry weight |
Example data records
|
Land_use,Sample_ID,Field_treatment,Burnt,Pressure,Dry_wt,Water_wt,GWC Secondary forest,C11,Termite mound,no,0.5,11.953,3.195,0.267 Secondary forest,C2,Termite mound,no,0.5,11.246,3.676,0.327 Secondary forest,F3,Control soil,no,0.5,6.26,2.554,0.408 ... Secondary forest,Q17,Burnt mound,yes,3,6.517,1.923,0.295 Secondary forest,Q18,Burnt mound,yes,3,6.517,1.923,0.295 Secondary forest,Q19,Burnt mound,yes,3,9.528,2.799,0.294 |
File #15: Water_stable_aggregates_data.csv
Water-stable aggregate samples were collected from termite mounds, control soil, and from a burnt mound at the secondary forest site in May and June of 2001.
| Column | Heading | Units/format | Description |
|---|---|---|---|
| 1 | Land_use | Dominant land use at sampling site: secondary forest was 7 to 8 years old | |
| 2 | Location_ID | Termite mound identification code | |
| 3 | Field_treatment | Sample type: Termite mound, Burnt mound (termite mound with evidence of recent burning) or Control soil (adjacent to termite mound) | |
| 4 | Soil_weight | g | Dry weight of sample prior to dispersal in water in grams (g) |
| 5 | Very_coarse | g | Dry weight of water-stable aggregates between 2-4 mm in diameter in grams (g) |
| 6 | Coarse | g | Dry weight of water-stable aggregates between 1-2 mm in diameter in grams (g) |
| 7 | Medium | g | Dry weight of water-stable aggregates between 0.5-1 mm in diameter in grams (g) |
| 8 | Fine | g | Dry weight of water-stable aggregates between 0.25-0.5 mm in diameter in grams (g) |
| 9 | Recovered_wt | g | Sum of the recovered aggregates reported in grams (g) |
| 10 | Error | g | Difference between the dry weight of the initial sample and the recovered weight reported in grams (g) |
Example data records
|
Land_use,Location_ID,Field_treatment,Soil_wt,Very_coarse_wt,Coarse_wt,Medium_wt,Fine_wt,Recovered_wt,Error Secondary forest,105,Termite mound,25.1,12.3,7.3,2.4,1,23,2.1 Secondary forest,105,Control soil,25,8.5,9.2,4.1,1.6,23.4,1.6 Secondary forest,116,Termite mound,36.2,22.3,7.9,2.9,1.2,34.3,1.9 ... Secondary forest,92,Termite mound,49.9,28.2,12.5,4.6,1.7,47,2.9 Secondary forest,92,Control soil,34,9.8,9.1,4.4,2.1,25.4,8.6 Secondary forest,69,Burnt mound,25.1,19.7,3.4,0.5,0.2,23.8,1.3 |
Site boundaries: (All latitude and longitude given in decimal degrees)
| Site (Region) | Westernmost Longitude | Easternmost Longitude | Northernmost Latitude | Southernmost Latitude | Geodetic Datum |
|---|---|---|---|---|---|
| Amazonas (Manaus) - EMBRAPA DAS Experiment - km 54 (CPAA) (Amazonas (Manaus)) | -60.030000 | - 60.030000 | -2.51800 | -2.51800 | World Geodetic System, 1984 (WGS-84) |
Time period:
- The data set covers the period 1999/12/15 to 2002/06/26
- Temporal Resolution: data for this dataset were collected at a variety of timescales
Platform/Sensor/Parameters measured include:
- FIELD INVESTIGATION / HUMAN OBSERVER / SPECIES/POPULATION INTERACTIONS
- LABORATORY / AA (ATOMIC ABSORPTION SPECTROMETER) / MICRONUTRIENTS/TRACE ELEMENTS
- LABORATORY / WEIGHING BALANCE / SOIL BULK DENSITY
- FIELD INVESTIGATION / HUMAN OBSERVER / SOIL STRUCTURE
- FIELD INVESTIGATION / HUMAN OBSERVER / SOIL TEXTURE
- LABORATORY / SOIL CORING DEVICE / SOIL INFILTRATION
3. Data Application and Derivation:
These data provide a picture of the impact of termite mounds on the physical, chemical, microbiological, and hydraulic properties of the soil of a secondary forest site in Central Amazonia. Few data are available on the impact of termite mounds on soil and land productivity in Amazonia in general, so these data could be useful to compare to other sites. In comparisons to other locations, researchers should note that the study site was chosen in order to investigate an area with an apparently high density of termite mounds, so this site is not necessarily representative of any particular area.
4. Quality Assessment:
Data have been checked and no further changes to the data are anticipated.
5. Data Acquisition Materials and Methods:
The soils used in this study were collected from sites located at the Embrapa research station in the Distrito Agropecuario da SUFRAMA, located at km 53 of the federal highway BR 174 outside Manaus, Amazonas, Brazil. Soils on the plateau of the study site are classified as dystrophic, isohyperthermic, clayey kaolinitic Hapludox. The climate is tropical humid, and mean annual rainfall is 2,200 mm.
Three land uses were chosen for this study: a secondary forest, a home-garden agroforest, and a palm-based agroforest. The home-garden and palm-based agroforests had been established on pastureland abandoned 10 yr prior to this study. Each plot measured 50 x 60 m. The agroforests were replicated on three blocks according to their land-use history: blocks one, two, and three had been in pasture for 4, 5, and 8 yr previously, and in fallow for 3, 4, and 5 yr prior to the establishment of the agroforests. These sites occurred on the plateau of the study site, and were surrounded by primary forest on the surrounding slopes. The secondary forest transects were in a 7-8 year old secondary forest dominated by Vismia spp. Three plots were chosen at the same distance apart as the plots in the agroforests.
Termite mound abundance, area, collection, and identification:
Termite species composition was assessed using a modified rapid biodiversity assessment protocol (Land_use_species_composition.csv). The method employs a 100 m belt transect with 20 contiguous 2 x 5 m sections sampled sequentially. Transect length was limited to 50 m, the width of the agroforestry plots. A transect was established through the middle of each plot, amounting to three transects in each land cover, nine in total. A team of two collectors sampled as many species as possible in 30 min in each 2 x 5 m section. Collection was done in soil, litter, dead wood, mounds, nests, soil to 5 cm depth, and runways to 2 m height in the vegetation. The presence of a species in each section was considered an encounter and used as a surrogate for relative abundance. Observations on feeding substrates and nesting locations were recorded simultaneously.
Termite mound abundance and area covered (density) (Termite_mound_area_and_abundance.csv) were determined at the secondary forest site in April of 2000. Transects were made and surveyed through the secondary forest site (figure 1). Seventeen mounds were sampled for termite species. Termites were hand-collected with forceps and transferred to vials containing 80% ethyl alcohol for preservation and subsequent identification (Ackerman et al., 2007).
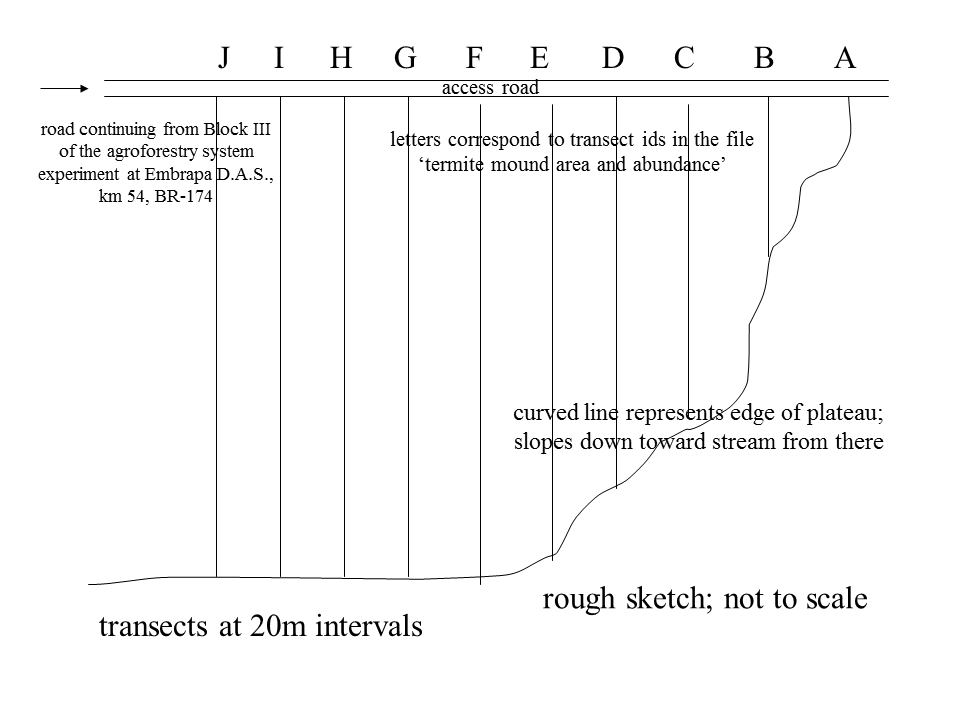
Figure 1. Diagram of transect lines surveyed for termite mound area and abundance.
Nitrogen mineralization
Nitrogen mineralization (Termite_mound_N_mineralization.csv): Five termite mounds and control sites from the secondary forest site were sampled. Termite mound material was collected from the upper 10 cm of the mound surface using a composite of four samples. Control soil was similarly collected from an area 1.5 m from the border of the termite mound. Moisture content of each sample was determined in the laboratory. In the broken treatment, aggregates were broken by hand to a consistent size. For the elevated moisture treatment, gravimetric water content was increased to a moisture level 10% higher than field content. Water was added three times a week to maintain the desired water contents. Closed containers with a large headspace were used, and a hole in the lid was made to allow gas exchange. At 0, 8, 43, and 66 days, 25 g subsamples from the incubations were extracted with 75 mL KCl by shaking for 30 minutes. NH4+ and NO3- determinations were made using a Skalar continuous flow analyzer.
Root biomass
Root biomass determination (Termite_mound_root_density.csv):
Samples were collected at the secondary forest site on Jun 26 2001.
Biomass measurements were made by sampling with 5 cm long and 100 cubic cm cylinders on the soil surface.
Nineteen randomly selected termite mounds, 19 adjacent control areas, and 1 burnt
mound were sampled. A flat intact surface was chosen for sampling on each mound. The
sampling point for the control soil was 1.5 m from the border
of the termite mound in a randomly chosen cardinal direction. Roots were washed, identified where possible, and
dried (Ackerman et al., 2007).
Seedling studies
Soil cores (Termite_mounds_seedling_experiment.csv) were collected in 5 cm
long and 100 cm3 stainless steel cylinders. To remove mechanical barriers to germination, the material was ground to a texture favorable to seedling development. Autoclaving was used to denature any allelopathic organic substances, as in Rogers et al. (1999). Soil acidity, a potential barrier to germination and seedling development, was corrected by amendment with lime (20 and 12 mg of lime per cylinder in the ground and intact treatments, respectively).Six seeds of the native Sesbania exasperata were planted per experimental unit. Each factorial combination of the experiment
had five experimental units, for a total of 480 seeds. Each of the eighty 100 cm3 cylinders received 10 mL of water daily as needed. Germination was recorded daily for nine days. The emergence velocity index (EVI) (Mendonca, 1997) of the seeds was calculated.
Microbial groups
Microbial group determination (Microbial_groups.csv):
Termite mounds were randomly selected from the secondary-forest study site for sampling. Three 10 cm surface samples from each mound were collected with an auger and
aggregated into a composite sample. The adjacent soil (1.5 m in distance in a random direction) was likewise sampled. Each sample was shaken with sterilized water and glass beads for ten minutes and a dilution series was made from 1:1,000
or 1:10,000,000.
40 g of soil from each sample were dried at 105 C for 24 h and the loss in weight measured. A strip of Whatman No. 1 filter paper was added to a vial containing 10 mL of Jensens medium. The cellulose medium was composed of 1.0 g (NH4) 2SO4, 1.0 g K2HPO4, 0.5 g MgSO4 7H2O, 0.2 g NaCl, 2.0 g CaCO3, and 1000 mL tap water. The vials were incubated for seven days and counted as positive if microbial growth or break-up of the paper strip was observed.
The same dilutions used for determining populations of cellulose-decomposing microorganisms were used in an experiment to compare ammonifier populations. Methods for estimating the population of ammonifying microorganisms were followed according to Andrade et al. (1994). Vials with orange coloration were counted as negative for ammonifying microorganisms and vials with pink or yellow coloration were counted as positive. The most probable number of microorganisms was calculated using the DOS application MPNES (Woomer et al., 1990).
Soil properties:
Soda lime assessment of soil respiration (Soda_lime_data.csv): Eight termite mounds
were selected randomly from the termite mounds at the secondary forest study
site. A 20-cm polyvinyl chloride ring 10 cm in height was pushed into the soil
to a depth of 2-3 cm in each sampling location. Two corresponding rings were
likewise installed at 1.5 m from the termite mound in the control soil to
comprise the two control treatments. All litter was removed from the surface of
the soil in one of the control treatments. At sampling an open tin of soda lime was placed inside a covered chamber for 24 hours,
then capped and re-weighed. A blank was used at each sampling session. The increase in dry mass of the soda lime was converted to
carbon dioxide (CO2) using the factor 1.69 to correct for the chemical formation of water (Grogan, 1998). Respiration was measured at three sampling events.
During each event, four of the eight sites were measured on the first day, and the other four sites on the next.
Soil analysis (Termite_mound_soil_chemistry_and_respiration_rates.csv):
The soil chemistry data were collected in May 2000 at the secondary forest site. For the soil chemistry data, an auger was used to sample the surface
(10 cm) of soil. There were 6 samples for control soil and 6 samples of termite
soil, and each of the six samples were normal (sieved soil) or aggregate. The
control adjacent soil sample was taken 1.5 m from the base of the termite mound. Each sampling point was a composite of three samples.
Soil carbon was determined by the Walkley-Black method, and total soil nitrogen (N) by the Kjeldahl technique. Available phosphorus (P)
and exchangeable potassium (K) were extracted using a double-acid solution of 0.05 N hydrochloric acid and 0.025 N sulfuric acid (Mehlich-1). Exchangeable
calcium (Ca), magnesium (Mg), and aluminum (Al) were extracted with 1 N potassium chloride. Iron (Fe), zinc (Zn), manganese (Mn), and copper
(Cu) were extracted with a Mehlich-1 solution in a 1:5 ratio (w/v) and determined on an atomic absorption spectrophotometer (AA-1475, Varian Associates,
Palo Alto, CA). ) Soil microbial in vitro respiration was measured by an infrared gas analyzer (Ackerman 2006).
The instrument was run in open flow mode using ambient air from outdoors.
Temperature during the experiment ranged from 17 to 23 C.
Soil bulk density data (Termite_mound_soil_physical_characteristics.csv): The pasture soil bulk density samples were collected on September 4 and 5 of 2000, and the secondary forest soil bulk density samples were collected on July 13, 2000. Bulk density measurements were made by sampling with 5 cm long and 100 cubic cm cylinders on the soil surface. Nine termite mounds and 9 adjacent control areas were sampled in the secondary forest, and 4 each in the pasture. Three samples were taken from each mound and each treatment.
Soil hydrophobicity (Soil_hydrophobicity.csv): The soil hydrophobicity data were collected in May of 2001, using soil from the secondary forest site. Soil clod samples from termite mound, control soil, and a termite mound that had been exposed to fire were evaluated for their rate of water absorption by an absorption curve method. A tray of washed sand was saturated with water. Sixteen soil clods of each treatment category (termite mound, control soil, and termite mound that had been exposed to fire) were dried and weighed. Each clod was re-weighed after every 5 s in contact with the bed of sand until it ceased to gain mass (Ackerman et al., 2007).
Soil infiltration (Soil_infiltration.csv): Nine samples of termite and control soils each were collected on September 5, 2000, at the secondary forest site. Soil infiltration was measured by inserting a stainless steel cylinder 20 cm tall 10 cm into the soil surface. A constant head of water was maintained in the cylinder for 10 minutes, and the amount of water lost was recorded.
Resistance (Soil_resistance_all.csv): Soil resistance to penetration was measured in the secondary forest site on August 2, 2000 and in the pasture site on September 5, 2000. Resistance measurements were made using a cone penetrometer (Ejkelkamp penetrometer) with a cone with surface area of 2 sq. cm and penetration depth of 5 cm. Ten termite mounds and 10 adjacent control areas were sampled in the secondary forest and 7 in the pasture. Five readings were taken on each mound and each treatment in the secondary forest, and 3 each in the pasture.
Soil texture (Soil_texture_all.csv): Forty-one soil texture samples were collected in May 2000 at the secondary forest and 16 samples August 4, 2000, at the pasture sites. An auger was used to sample the surface 10 cm of soil. The two treatments were termite mound and adjacent soil. The adjacent soil sample was taken 1.5 m from the base of the termite mound. Each sampling point was a composite of three samples. Sand fractions were separated by wet sieving and clay and silt fractions were determined using the sieve-pipette sedimentation method for clay (EMBRAPA 1997). Dispersion was done using 1N NaOH and mechanical agitation. The Brazilian classification system was used to determine particle size classes (EMBRAPA 1997).
Water retention (Water_retention_curve_data.csv): The water retention curve of termite mound and control soil cores was evaluated by the tension table method (Reeve & Carter, 1991) for 27 samples including control soils, termite and burnt mounds. Cores were saturated and then re-weighed at 0, 4, 10, 25, 30, 63, and 80 cm of water of tension. After 80 cm of tension the samples were transferred to a pressure-plate apparatus and weighed after equilibrating at pressures equivalent to columns of 100 and 1000 cm of water. Oven dry weights were determined after the experiment.
Water-stable aggregation (Water_stable_aggregates_data.csv:): Water-stable aggregation was measured using 19 samples from termite mounds, control soil, and 1 sample from a burnt mound, from the secondary forest site, in May and June of 2001. To evaluate water-stable aggregates, an auger was used to sample the surface 10 cm of soil. The two treatments were termite mound and adjacent soil. The adjacent soil sample was taken 1.5 m from the base of the termite mound. Each mound was selected randomly from a previous survey of the area. Roots and charcoal were removed from the samples. 25 g of soil composed of particles of between 2 and 4 mm was selected from each sample. Around 10 g of soil was used to determine the moisture content of each sample. The 25 g of soil was agitated mechanically in water for 10 minutes, through sieves of 2 mm, 1 mm, 0.5 mm, and 0.25 mm aperture. The soil in each category was dried at 105 C for at least 24 hours and weighed.
6. Data Access:
This data is available through the Oak Ridge National Laboratory (ORNL) Distributed Active Archive Center (DAAC).
Data Archive Center:
Contact for Data Center Access Information:
E-mail: uso@daac.ornl.gov
Telephone: +1 (865) 241-3952
7. References:
Ackerman, I.L., R. Constantino, H.G. Gauch, J. Lehmann, S.J. Riha, and E.C.M. Fernandes. 2009. Termite (Insecta: Isoptera) Species Composition in a Primary Rain Forest and Agroforests in Central Amazonia. Biotropica 41(2):226-233. (LBA-ECO Pub ID # 875).
Ackerman, I. L., W. G. Teixeira, S. J. Riha, J. Lehmann, and E. C. M. Fernandes. 2007. The impact of mound-building termites on surface soil properties in a secondary forest of Central Amazonia. Applied Soil Ecology 37: 267-276.
Ackerman, I.L. 2006. Termites in ecosystems of central Amazonia: species composition, soil properties, and nutrient cycling. Thesis, Cornell University. (LBA-ECO Pub ID # 831).
Andrade, D.d.S., M. Miyazawa, and P.J. Hamakawa. 1994. Microrganismos amonificadores e nitrificadores, p. 355-367, In M. Hungria and R. S. Araujo, eds. Manual de Metodos Empregados em Estudos de Microbiologia Agricola. Embrapa, Brasilia.
EMBRAPA, 1997. Maual de Metodos de Analises de Solo. Centro Nacional de Pesquisa de Solos, Rio de Janeiro, 212 pp.
Grogan, P. 1998. CO2 flux measurement using soda lime: Correction for water formed during CO2 adsorption. Ecology 79:1467-1468.
Mendonca, M.A.F., 1997. Selecao de leguminosas arboreas para plantios de enriquecimento florestal: germinacao das sementes e acompanhamento do crescimento apos a introducao em capoeira em solo Podzolico Vermelho Amarelo. Monograph Thesis. FCA/FUA, Manaus, 61 pp.
Reeve, M.J., Carter, A.D., 1991. Water release characteristics. In: Smith, K.A., Mullins, C.E. (Eds.), Soil Analysis: Physical Methods. Marcel Dekker, New York, pp. 111-160.
Rogers, L.K.R., French, J.R.J., Elgar, M.A., 1999. Suppression of plant growth on the mounds of the termite Coptotermes lacteus Froggatt (Isoptera, Rhinotermitidae). Insectes Sociaux 46, 366-371.
Woomer, P., J. Bennett., and R. Yost. 1990. Overcoming the inflexibility of most-probable-number procedures. Agronomy Journal 82:349-353.