LBA-ECO ND-01 Primary Forests Land Cover Transition Maps, Rondonia, Brazil: 1975-1999
Get Data
Revision date: August 28, 2013
Summary:
This data set provides classified land cover transition images (maps) derived from Landsat Thematic Mapper (TM) and Multispectral Scanner (MSS) imagery for Ariquemes, Luiza, and Ji-Paraná areas in Rondonia, Brazil, at 30-m resolution. Images depict the age relative to the year 2000, of cleared land from the date the land was cut, to the date when primary forests transitioned into nonforest class. For example, a value of 25 means that the primary forest was cut in 1975 -- 25 years before 2000.
Temporal changes in three regions are represented by 31 TM scenes acquired between 1984 and 1999, and a pair of MSS scenes from 1975 and 1978.
Data are provided as three GeoTiff (*.tif) images, one for each of the three areas.
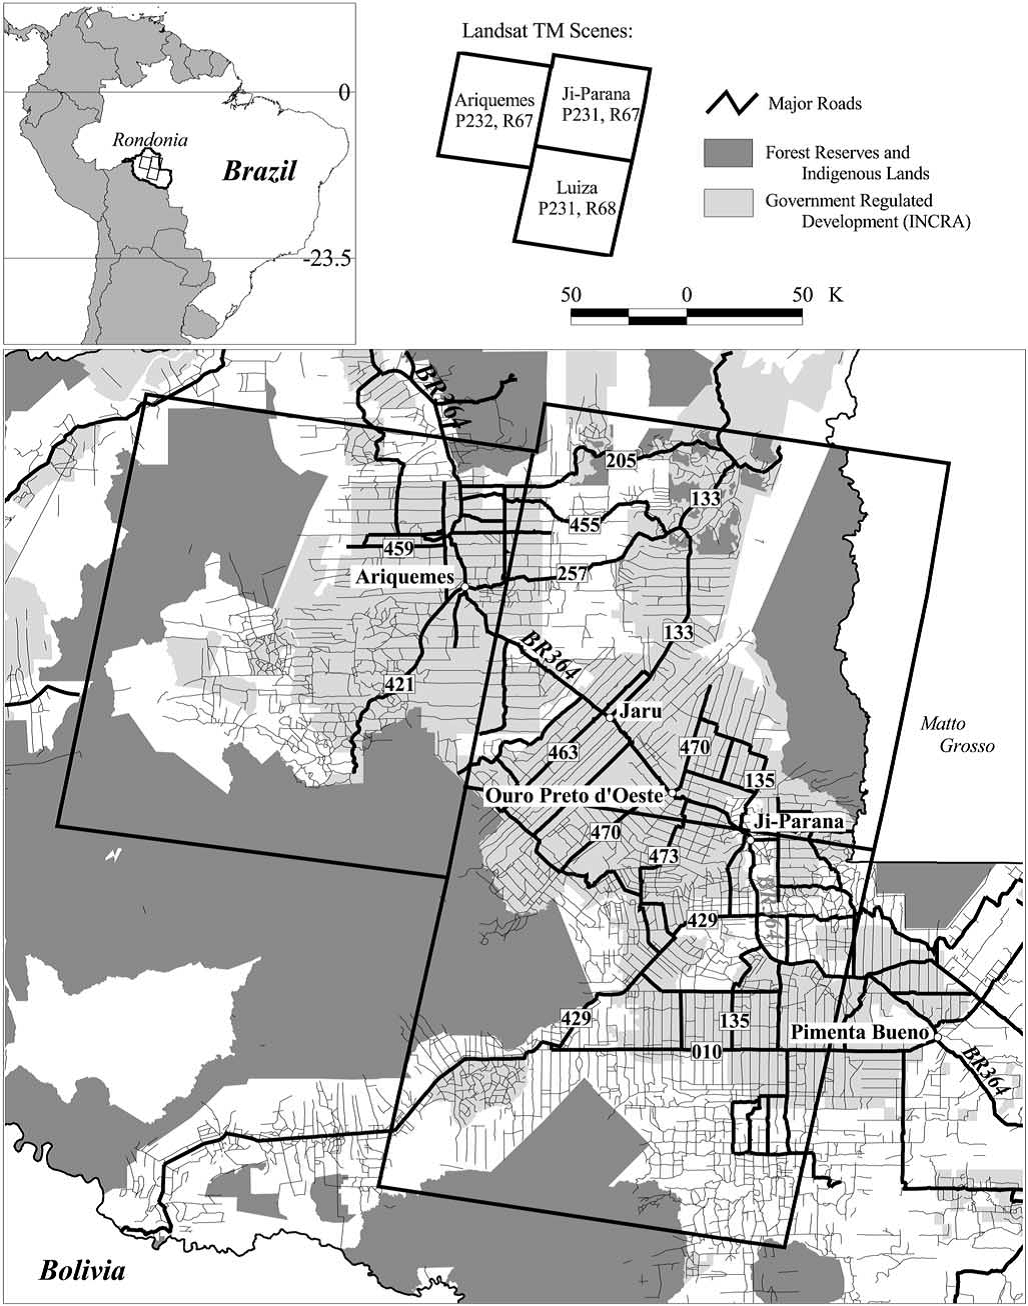
Figure 1. Index map showing the study site, location of the three scenes, land ownership, and roads (Roberts et al. 2002).
Data Citation:
Cite this data set as follows:
Roberts, D.A., I. Numata, K.W. Holmes, G.T. Batista, T. Krug, A.L. Monteiro, R.L. Powell, and O.A. Chadwick. 2013. LBA-ECO ND-01 Primary Forests Land Cover Transition Maps, Rondonia, Brazil: 1975-1999. Data set. Available on-line [http://daac.ornl.gov] from Oak Ridge National Laboratory Distributed Active Archive Center, Oak Ridge, Tennessee, USA. http://dx.doi.org/10.3334/ORNLDAAC/1184
Implementation of the LBA Data and Publication Policy by Data Users:
The LBA Data and Publication Policy [http://daac.ornl.gov/LBA/lba_data_policy.html] is in effect for a period of five (5) years from the date of archiving and should be followed by data users who have obtained LBA data sets from the ORNL DAAC. Users who download LBA data in the five years after data have been archived must contact the investigators who collected the data, per provisions 6 and 7 in the Policy.
This data set was archived in September 2013. Users who download the data between September 2013 and August 2018 must comply with the LBA Data and Publication Policy.
Data users should use the investigator contact information in this document to communicate with the data provider.
Data users should use the data set citation and other applicable references provided in this document to acknowledge use of the data.
Table of Contents:
- 1 Data Set Overview
- 2 Data Characteristics
- 3 Applications and Derivation
- 4 Quality Assessment
- 5 Acquisition Materials and Methods
- 6 Data Access
- 7 References
1. Data Set Overview:
Project: LBA (Large-Scale Biosphere-Atmosphere Experiment in the Amazon)
Activity: LBA-ECO
LBA Science Component: Land Use and Land Cover
Team ID: ND-01 (Chadwick / Roberts / Batista)
The investigators were Chadwick, Oliver A.; Roberts, Dar A.; Batista, Getulio T.; Biggs, Trent W.; Gessler, Paul E.; Holmes, Karen W. and Tomasella, Javier. You may contact Roberts, Dar A. (dar@geog.ucsb.edu) and Holmes, Karen W. (karen@geog.ucsb.edu).
LBA Data Set Inventory ID: ND01_Age_maps
This data set provides classified land cover transition images (maps) derived from Landsat Thematic Mapper (TM) and Multispectral Scanner (MSS) imagery for Ariquemes, Luiza, and Ji-Paraná areas in Rondonia, Brazil, at 30-m resolution. Images depict the age relative to the year 2000, of cleared land from the date the land was cut, to the date when primary forests transitioned into nonforest class. For example, a value of 25 means that the primary forest was cut in 1975 -- 25 years before 2000.
Temporal changes in three regions are represented by 31 TM scenes acquired between 1984 and 1999, and a pair of MSS scenes from 1975 and 1978.
Related Data Set:
LBA-ECO ND-01 Spectral Mixture Fraction Images, Rondonia, Brazil: 1986-2000 (many images from this data set were used for the classification into age transition maps)
2. Data Characteristics:
There are 3 GeoTIFF files (.tif) with this data set depicting land cover transitions for the areas of Ariquemes, Luiza, and Ji-Paraná, Rondonia, Brazil. The data represent the age, relative to the year 2000, of cleared land from the date it was cut to the date when primary forests transitioned into a nonforest class.
Age
classes are based on the year 2000:
A value of ‘0’
indicates uncut
‘50’ indicates rock/savanna
Values 1-25 refer to the cut years based on 2000 (i.e,
25 = cut by 1975, 12 = cut by 1988).
1) Ar75to99_mask.tif: age classes for the Ariquemes region from 1975 to 1999.
Ages in this file include: 25, 16, 12, 11, 10, 9, 8, 7, 6, 5, 4, 3, 2, 1 (note, 1999 image cloud contaminated).
Dates of the Landsat scenes used in Ariquemes: 6-19-75, 6-24-84, 7-21-88, 7-24-89, 8-12-90, 6-12-91, 6-22-92, 10-07-93, 6-04-94, 7-25-95, 7-11-96, 6-28-97, 7-17-98, 10-16-99.
2) Ji78to99_mask.tif: age classes for the Ji-Paraná region from 1978 to 1999.
Ages in this file include: 22, 14, 12, 11, 10, 7, 4, 3, 2, 1.
Dates of the Landsat scenes used in Ji-Paraná: 8-19-78, 10-13-86, 7-30-88, 8-02-89, 8-05-90, 7-28-93, 7-20-96, 6-21-97, 6-08-98, 8-06-99.
3) Lu86to99_mask.tif: age classes for the Luiza region from 1986 to 1999.
Ages in this file include: 14, 12, 11, 10, 8,5, 4, 3, 1.
Dates of the Landsat scenes used in in Luiza: 10-13-86, 7-30-88, 8-02-89, 8-05-90, 7-25-92, 8-03-95, 7-20-96, 7-23-97, 8-06-99
Image Projection Information:
- Projection: TUTM Zone 20 Southern Hemisphere
- Resolution: 30 meters
- False_Easting: 500000.000000
- False_Northing: 10000000.000000
- Central_Meridian: -63.000000
- Scale_Factor: 0.999600
- Latitude_of_Origin: 0.000000
- Linear_Unit: Meter
- Geographic Coordinate System: GCS_South_American_1969
- Datum: D_South_American_1969
- Prime Meridian: Greenwich
- Angular Unit: Degree
| Site (Region) | Westernmost Longitude | Easternmost Longitude | Northernmost Latitude | Southernmost Latitude | Geodetic Datum |
|---|---|---|---|---|---|
| Rondonia - Ariquemes (Rondonia) | -64.64056 | -62.69722 | -9.18083 | -11.07528 | South-American Datum, 1969 (SAD-69) |
| Rondonia - Ji Parana (Rondonia) | -63.06833 | -61.18167 | -9.36861 | -10.93583 | South-American Datum, 1969 (SAD-69) |
| Rondonia - Luiza (Rondonia) | -63.40667 | -61.48278 | -10.6975 | -12.43111 | South-American Datum, 1969 (SAD-69) |
Time period:
- The data set covers the period 1975/06/19 to 1999/10/16.
- Temporal Resolution: Annual
Platform/Sensor/Parameters measured include:
- LANDSAT-5 (LAND REMOTE-SENSING SATELLITE-5) / LANDSAT MSS / LAND COVER
- LANDSAT-5 (LAND REMOTE-SENSING SATELLITE-5) / LANDSAT TM (LANDSAT THEMATIC MAPPER) / LAND COVER
3. Data Application and Derivation:
This 27 year time series can be used to develop age maps, determine rates of deforestation, changes in forest area, as well as forest edge, and spatial and temporal patterns in land-cover.
4. Quality Assessment:
Accuracy of the 1999 classified maps was assessed as exceeding 85% based on digital airborne videography acquired over Rondonia in June 1999 using methods similar to those used by Hess et al. (2001).
Rock, savanna, water, soil, and urban classes were rarely encountered in the videography and thus have insufficient samples to assess accuracy of these classes.
Producers accuracy, defined as the proportion of reference points mapped correctly by the classifier, ranged from highs of 90% for pasture and 89.7% for mature forest to a low of 55% in second growth.
Confusion was greatest between second growth and mature forest. Detailed analysis of these samples showed that confusion occurred primarily in areas of rugged topography on sun-facing slopes where decreased shade resulted in the decision tree classifier interpreting these areas as second growth.
The second most significant source of error was in discriminating second growth from pasture, accounting for the largest error in mapping second-growth reference sites.
Overall, second growth was over-mapped relative to the other classes, primarily due to errors on sunlit slopes.
5. Data Acquisition Materials and Methods:
Site Description
This study was conducted over an area approximately 80,000 km2 located in central Rondȏnia consisting of three regions. These three regions provide a gradient in deforestation rates and pasture ages from low rates and young pastures in Ariquemes to higher initial deforestation and older pastures in Ji-Paraná and Luiza. Elevations in the area range from 100 to 1,000 meters. Natural vegetation is dominated by dense tropical forests with locally abundant savanna, transitional forest and infrequent patches of more open, shorter forests (RADAMBRASIL, 1978). Anthropogenic land cover includes pastures, second-growth forest, annual crops, perennial crops, bare soil and urbanized areas (Browder, 1994).
Landsat TM and Landsat MSS Images
Thirty one Landsat TM scenes and 2 Landsat MSS scenes were assembled into a comprehensive time series for three areas: Ariquemes, Ji-Paraná and Luiza.
- 13 scenes were acquired for Ariquemes: one for 1975, one for 1984, and annual coverage from 1988 to 1999.
- 10 scenes were acquired for Ji-Paraná: 1986 to 1999.
- 9 scenes were acquired for Luiza from 1986 to 1999.
All Landsat images were coregistered to 1998 or 1999 digital PRODES.
Image Classification, Filtering, and Land-Use Mapping Process (for additional information, refer to Roberts et al., 2002)
All images were resampled using nearest neighbor resampling and classified into seven land-cover categories:
1. Primary upland forest, representing the dominant natural vegetation in the area, categorized as dense tropical forest (RADAMBRASIL, 1978).
2. Pasture and green pasture, dominated by several pasture grass species (Brachiaria brizantha and Panicum maximum) and ranging in quality from highly degraded to well-managed green pastures. Recent burn scars are classified as pasture.
3. Second growth, dominated by small trees and shrubs with low species diversity and biomass relative to primary forest. Second growth may follow pasture after abandonment, or after anthropogenic or natural disturbance of primary forest.
4. Soil/urban.
5. Rock/savanna. Rock is most abundant in areas of high topographic relief, while savanna is commonly located in close proximity to wetlands.
6. Water.
7. Cloud obscured, including smoke from burning, clouds and cloud shadows.
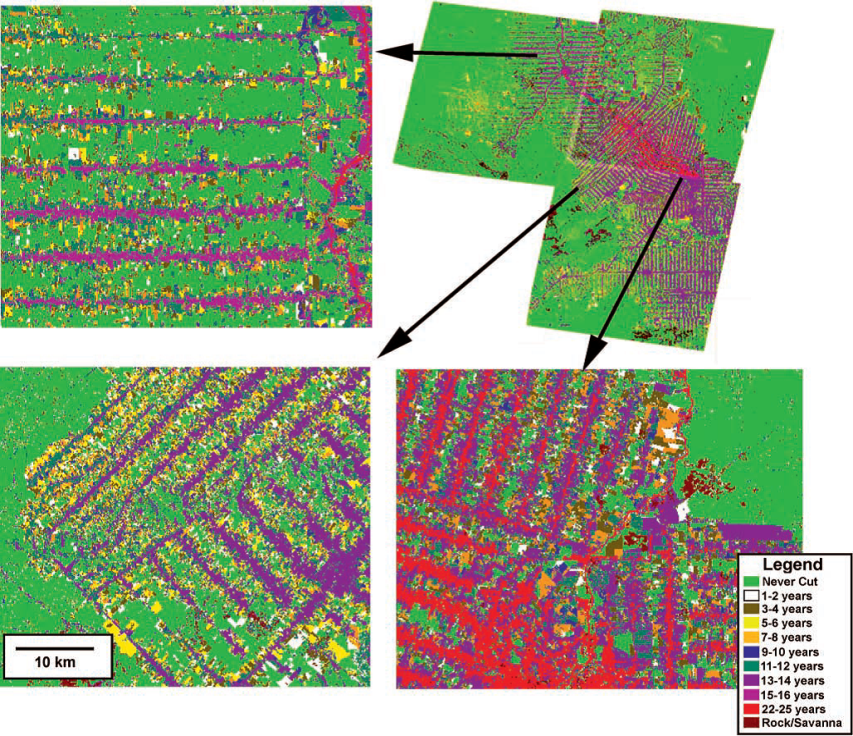
Figure 2. Map showing age since initial cut for the three scenes. Several age classes have been combined to improve the clarity of the figure (Roberts et al., 2002).
Land-cover change was mapped using a multistage process described by Roberts et al. (1998, 2002):
1. Image End-Member Selection: Using spectral mixture analysis, a spectrum consisting of radiance reflected off of multiple materials within the field of view was decomposed into fractions of several unmixed spectra, called end-members (Adams et al., 1993). The final product was five images, one for each end-member and an RMSE image.
2. Reflectance Retrieval: Encoded radiance was converted to apparent surface reflectance through absolute calibration (Kaufman, 1989) or relative reflectance retrievals (Elvidge and Portigal, 1990) to identify surface materials and compare satellite observations to laboratory or field measured spectra. The quality of retrieved surface reflectance for Rondonia was evaluated by comparison to surface reflectance measured over similar targets in Manaus, retrieved using multiple ground reflectance measured in the field during the summer the Manaus Landsat TM data were acquired.
3. Reference End-Member Selection: Reference end-members are spectra of known materials (Adams et al., 1993). Reference end-members were selected from the same spectral library used to retrieve surface reflectance.
4. Intercalibration: Following step three, remaining data sets are standardized to the reference scene using relative radiometric calibration techniques (Schott et al., 1988; Hall et al., 1991).
5. Spectral Mixture Analysis: Once the entire time series was intercalibrated and reference end-members selected, the same model was applied to the entire data set. This generated four fraction images for each scene (GV, NPV, soil and shade) and an RMSE image.
6. Decision Tree Training and Classification: Spectral fractions and the RMSE images were used to train a decision tree classifier (DTC) (Hess et al., 1995; Friedl and Brodley, 1997; Roberts et al., 1998; 2002).
7. Reclassification and Spatial Filtering: Disallowed transitions were removed (transitions that represent any transition that is not physically reasonable, such as a transition from second growth or pasture to primary forest over a span of a few years (Roberts et al., 2002)). To reduce the effect of pixel misregistration, a spatial filter was applied to classified images prior to time series analysis.
8. Savanna /Rock Mask, Edge Mask: Areas covered by rock and savanna were mapped and all areas outside of the overlap zone between all dates within a scene were masked.
The classified data were used to develop maps showing the age distribution of cleared lands by tracking the timing when primary forest underwent a transition to a nonforest class.
6. Data Access:
These data are available through the Oak Ridge National Laboratory (ORNL) Distributed Active Archive Center (DAAC).
Data Archive Center:
Contact for Data Center Access Information:
E-mail: uso@daac.ornl.gov
Telephone: +1 (865) 241-3952
7. References:
Adams, J.B., M.O. Smith and A.R. Gillespie. 1993. Imaging spectroscopy:Interpretation based on spectral mixture analysis, in Remote Geochemical Analysis: Elemental and Mineralogical Composition, edited by C. M.Pieters and P. Englert, pp. 145-166, Cambridge Univ. Press., New York.
Browder, J. O., Surviving in Rondonia: The dynamics of colonist farming strategies in Brazil’s northwest frontier, Stud. Comp. Int. Dev., 29(3), 45-69, 1994.
Elvidge, C.D. and F.P. Portigal. 1990 Change detection in vegetation using 1989 AVIRIS data, in Proc. SPIE Imaging Spectroscopy of the Terrestrial Environment, Orlando, Fla., 16-17 April, edited by G. Vane, pp. 178-189, Int. Soc. for Opt. Eng., Bellingham, Wash.
Friedl, M.A. and C.E. Brodley. 1997. Decision tree classification of land cover from remotely sensed data, Remote Sens. Environ., 61, 399-409. Furby, S. L., & Campbell, N. A. (2001), Calibrating images from different dates to like-value digital counts, Remote Sens. Environ., 77, 186-196.
Hall, F.G., D.E. Strebel, J.E. Nickeson and S.J. Goetz. 1991. Radiometric rectification, toward a common radiometric response among multidate, multisensor images, Remote Sens. Environ., 35, 11-27.
Hess, L.L., et al. 2001. Geocoded digital videography for validation of land cover mapping in the Amazon Basin, Int. J. Remote Sens., 23(7), 1527- 1555.
Kaufman, Y.J. 1989. The atmospheric effect on remote sensing and its correction,in Theory and Applications of Optical Remote Sensing, edited by G. Asnar, pp. 336-428, John Wiley, New York.
RADAMBRASIL. 1978. Mapa Exploratório de solos. Projeto Radambrasil: Programa de Integração Nacioal, 1:1,000,000, Minits. Das Minas e Energ., De. Nac. De Prod., Rio de Janeiro.
Richards, J.A. 1999. Remote Sensing Digital Image Analysis: An Introduction, Springer-Verlag, New York.
Roberts, D.A., I. Numata, K. Holmes, G. Batista, T. Krug, A. Monteiro, B. Powell, and O.A. Chadwick. 2002. Large area mapping of land-cover change in Rondonia using multitemporal spectral mixture analysis and decision tree classifiers. Journal of Geophysical Research-Atmospheres, Vol. 107, No. D20, p. 8073.
Roberts, D.A., Batista, G., Pereira, J., Waller, E., and Nelson, B. 1998. Change Identification using Multitemporal Spectral Mixture Analysis: Applications in Eastern Amazonia, Chapter 9 in Remote Sensing Change Detection: Environmental Monitoring Applications and Methods, (Elvidge, C. and Lunetta R., Eds.), Ann Arbor Press, Ann Arbor, MI, pp. 137-161.
Schott, J., C. Salvaggio and W. Volchok. 1988. Radiometric scene normalization using pseudoinvariant features, Remote Sens. Environ., 26, 1-16.
Smith, M.O., S.L. Ustin, J.B. Adams and A.R. Gillespie. 1990. Vegetation in deserts, I, A regional measure of abundance from multispectral images, Remote Sens. Environ., 31, 1-26.