Get Data
Summary:
This data set provides continental-scale hydrological river flow routing parameter data for the Amazon and Tocantins River basins at 5 minute (~9 km) resolution (Costa et al., 2002). The data set includes four geospatial data files (in standard ESRI Arc/Info ASCII Grid format): (1) the river network (flow direction); (2) sinuosity of each of the main rivers, measured at 111 river sections in the basins; (3) depth to the water table; and (4) transmissivity of the aquifer. The latter two parameters were derived from measurements taken at 81 wells located throughout the basins. There is also a compressed file (*.zip) which contains the time series of monthly mean river discharge and long-term climatology (monthly mean) for the period of record at each of 122 fluviometric stations located throughout the basin. These files are provided in ASCII common-separated (.csv) format. Also included in this data set are two data files in *.csv format; one containing river discharge station location and drainage area information and one containing original well data.
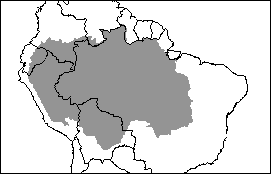
Figure 1. Amazon and Tocantins River basins showing country borders. From Costa et al. (2002).
Data Citation:
Cite this data set as follows:
Costa, M.H., C.H.C. Oliveira, R.G. Andrade, T.R. Bustamante, F.A. Silva, and M.T. Coe. 2011. Data set. LBA-ECO LC-04 Macrohydrological Routing Data for the Amazon and Tocantins River Basins. Available on-line [http://daac.ornl.gov] from Oak Ridge National Laboratory Distributed Active Archive Center, Oak Ridge, Tennessee, U.S.A. doi:10.3334/ORNLDAAC/1048
Implementation of the LBA Data and Publication Policy by Data Users:
The LBA Data and Publication Policy [http://daac.ornl.gov/LBA/lba_data_policy.html] is in effect for a period of five years from the date of archiving and should be followed by data users who have obtained LBA data sets from the ORNL DAAC. Users who download LBA data in the five years after data have been archived must contact the investigators who collected the data, per provisions 6 and 7 in the Policy.
This data set was archived in December of 2011. Users who download the data between December 2011 and November 2016 must comply with the LBA Data and Publication Policy.
Data users should use the Investigator contact information in this document to communicate with the data provider. Alternatively, the LBA Web Site [http://lba.inpa.gov.br/lba/] in Brazil will have current contact information.
Data users should use the Data Set Citation and other applicable references provided in this document to acknowledge use of the data.
Table of Contents:
- 1 Data Set Overview
- 2 Data Characteristics
- 3 Applications and Derivation
- 4 Quality Assessment
- 5 Acquisition Materials and Methods
- 6 Data Access
- 7 References
1. Data Set Overview:
Project: LBA (Large-Scale Biosphere-Atmosphere Experiment in the Amazon)
Activity: LBA-ECO
LBA Science Component: Land Surface Hydrology
Team ID: LC-04 (Foley / Costa)
The investigators were Costa, Marcos Heil; Oliveira, Carlos Henrique C.; Andrade, Ricardo Guimaraes; Bustamante, Thiago R.; Silva, Fabricio A.; and Coe, Michael T. You may contact Costa, Marcos Heil (mhcosta@ufv.br) and Diosana, Carmela (ccdiosana@facstaff.wisc.edu).
LBA Data Set Inventory ID: LC04_Macrohydrology
This data set provides continental-scale hydrological river flow routing parameter data for the Amazon and Tocantins River basins at 5 minute (~9 km) resolution. The data set includes four geospatial ASCII data files in standard ESRI Arc/Info gridascii format: (1) the river network (flow direction); (2) sinuosity of each of the main rivers, measured at 111 river sections in the basins; (3) depth to the water table; and (4) transmissivity of the aquifer. The latter two variables were derived from measurements taken at 81 wells located throughout the basins.
Continental-scale hydrologic routing models, also known as macrohydrological routing models, have evolved considerably in the past few years. As the models have become more sophisticated, they have represented a variety of new processes and have expanded their data requirements either as input data or as validation for the model output. This is a new data set of large-scale hydrological river flow routing parameters for the Amazon and Tocantins basins. Part of this data set was required in the development of the continental-scale hydrological routing model HYDRA [now known as Terrestrial Hydrology Model with Biogeochemistry (THMB 1.2)] and its application to the Amazon basin.THMB 1.2 represents phenomena like floods, backwater effects, and seasonal hydrography much more realistically than previous generations of macrohydrological routing models.
2. Data Characteristics:
This data set provides continental-scale hydrological river flow routing parameter data for the Amazon and Tocantins River basins at 5 minute (~9 km) resolution. The data set includes four geospatial data files in standard ESRI Arc/Info ASCII Grid format: (1) the river network (flow direction); (2) sinuosity of each of the main rivers, measured at 111 river sections in the basins; (3) depth to the water table; and (4) transmissivity of the aquifer. The latter two variables were derived from measurements taken at 81 wells located throughout the basins. There is also a compressed file which contains time series of monthly mean river discharge and long-term climatology (monthly mean) of river discharge for the period of record at each of the 122 fluviometric stations located throughout the basin. The files are provided in ASCII common-separated (.csv) format. There are also two additional data files (.csv format): one containing river discharge station location and drainage area information and one containing original well data.
File 1. LC04_macrohydrology_river_network.dat
This file is in standard ESRI Arc/Info ASCII Grid format. The file format consists of numerical fields of varying length, which are delimited by a single space and arranged in columns and rows. This data file provides river flow directions, and contains 420 columns and 324 rows with the southwestern most corner at -21 degrees S, -80 degrees W; resolution 5-minute arc (12 cells per degree) (~9 km). It represents the 17th revision of the data file.
| Format | Units | Content time range |
|---|---|---|
| Integer | Adimensional | Atemporal |
| Code | Definition |
|---|---|
| 0 | Outside the basin |
| 1 | River flow northward |
| 2 | River flow northeastward |
| 2 | River flow eastward |
| 4 | River flow southeastward |
| 5 | River flow southward |
| 6 | River flow southwestward |
| 7 | River flow westward |
| 8 | River flow northwestward |
| 9 | River mouth (these points are actually outside the basin) |
Example data record:
|
ncols 420 nrows 324 xllcorner -80 yllcorner -21 cellsize 12 NODATA_Value 0 0 0 0 0 0 0 0 0 0 0 0 0 0 0 0 0 0 0 0 0 0 0 0 0 0 0 0 0 0 0 0 0 0 0 0 0 0 0 0 0 0 0 0 0 0 0 0 0 0 0 0 0 0 0 0 0 0 0 0 0 0 0 0 0 0 0 0 0 0 0 0 0 0 0 0 0 0 0 0 0 0 0 0 0 0 0 0 0 0 0 0 0 0 0 0 0 0 0 0 0 0 0 0 0 0 0 0 0 0 0 0 0 0 0 0 0 0 0 0 0 0 0 0 0 0 0 0 0 0 0 0 0 0 0 0 0 0 0 0 0 0 0 0 0 0 0 0 0 0 0 0 0 0 0 0 0 0 0 0 0 0 0 0 0 0 0 0 0 0 0 0 0 0 0 0 0 0 0 0 0 0 0 0 0 0 0 0 0 0 0 0 0 0 0 0 0 0 0 0 0 0 0 0 0 0 0 0 0 0 0 0 0 0 0 0 0 0 0 0 0 0 0 0 0 0 0 0 0 0 0 0 5 3 3 3 4 4 3 3 4 2 1 5 1 1 0 0 0 0 0 0 0 0 0 0 0 0 0 0 0 0 0 0 0 0 0 0 0 0 0 0 0 0 0 0 0 0 0 0 0 0 0 0 0 0 0 0 0 0 0 0 0 0 0 0 0 0 0 0 0 0 0 0 0 0 0 0 0 0 0 0 0 0 0 0 0 0 0 0 0 0 0 0 0 0 0 0 0 0 0 0 0 0 0 0 0 0 0 0 0 0 0 0 0 0 0 0 0 0 0 0 0 0 0 0 0 0 0 0 0 0 0 0 0 0 0 0 0 0 0 0 0 0 0 0 0 0 0 0 0 0 0 0 0 0 0 0 0 0 0 0 0 0 0 0 0 0 0 0 0 0 0 0 0 0 0 0 0 0 0 0 0 0 0 0 0 0 0 0 0 0 0 0 0 0 0 0 0 0 0 0 0 0 0 0 0 0 0 0 0 0 0 0 0 0 0 0 0 0 0 0 0 0 0 0 0 0 0 0 0 0 0 0 0 0 0 0 0 0 0 0 0 0 0 0 0 0 0 0 0 0 0 0 0 0 0 0 0 0 0 0 0 0 0 0 0 0 0 0 0 0 0 0 0 0 0 0 0 0 0 0 0 0 0 0 0 0 0 0 0 0 0 0 0 0 0 0 0 0 0 0 0 0 0 0 0 0 0 0 0 0 0 0 0 0 0 0 0 0 0 0 0 0 0 0 0 0 0 0 0 0 0 0 0 0 0 0 0 0 0 0 0 0 0 0 0 0 0 0 0 0 0 0 0 0 0 0 0 0 0 0 0 0 0 0 0 0 0 0 0 0 0 0 0 0 0 0 0 0 0 0 0 0 0 0 0 0 0 0 0 0 0 0 0 0 0 0 0 0 0 0 0 0 0 0 0 0 0 0 0 0 0 0 0 0 0 0 0 0 0 0 5 5 3 3 4 4 3 3 4 4 5 5 5 6 6 0 0 0 0 0 0 0 0 0 0 0 0 0 0 0 0 0 0 0 0 0 0 0 0 0 0 0 0 0 0 0 0 0 0 0 0 0 0 0 0 0 0 0 0 0 0 0 0 0 0 0 0 0 0 0 0 0 0 0 0 0 0 0 0 0 0 0 0 0 0 0 0 0 0 0 0 0 0 0 0 0 0 0 0 0 0 0 0 0 0 0 0 0 0 0 0 0 0 0 0 0 0 0 0 0 0 0 0 0 0 0 0 0 0 0 0 0 0 0 0 0 0 0 0 0 0 0 0 0 0 0 0 0 0 0 0 0 0 0 0 0 0 0 0 0 0 0 0 0 0 0 0 0 0 0 0 0 0 0 0 0 0 0 0 0 0 0 0 0 0 0 0 0 0 0 0 0 0 0 0 0 0 0 0 0 0 0 0 0 0 0 0 0 0 0 0 0 0 0 0 0 0 0 0 0 0 0 0 0 0 0 0 0 0 0 0 0 0 0 0 0 0 0 0 0 0 0 0 0 0 0 0 0 0 0 0 0 0 0 0 0 0 0 0 0 0 0 0 0 0 0 0 0 0 0 0 0 0 0 0 0 0 0 0 0 0 0 0 0 0 0 0 0 0 0 0 0 0 0 0 0 0 0 0 0 0 0 0 0 0 0 0 0 0 0 0 0 0 0 0 0 0 0 0 0 0 0 0 0 0 0 0 0 0 0 0 0 0 0 0 0 0 0 0 0 0 0 0 0 0 0 0 0 0 0 0 0 0 0 0 0 0 0 0 0 0 0 0 0 0 0 0 0 0 0 0 0 0 0 0 0 0 0 0 0 0 0 0 0 0 0 0 0 0 0 0 0 0 0 0 0 0 0 0 0 0 0 0 0 0 0 0 0 0 0 0 0 0 0 0 0 0 0 0 0 4 4 4 4 5 5 5 3 3 3 4 4 5 7 0 0 0 0 0 0 0 0 0 0 0 0 0 0 0 0 0 0 0 0 0 0 0 0 0 0 0 0 0 0 0 0 0 0 0 0 0 0 0 0 0 0 0 0 0 0 0 0 0 0 0 0 0 0 0 0 0 0 0 0 0 0 0 0 0 0 0 0 0 0 0 0 0 0 0 0 0 0 0 0 0 0 0 0 0 0 0 0 0 0 0 0 0 0 0 0 0 0 0 0 0 0 0 0 0 0 0 0 0 0 0 0 0 0 0 0 0 0 0 0 0 0 0 0 0 0 0 0 0 0 0 0 0 0 0 0 0 0 0 0 0 0 0 0 0 0 0 0 0 0 0 0 0 0 0 0 0 0 0 0 0 0 0 0 0 0 0 0 0 0 0 0 0 0 0 0 0 0 0 0 0 0 0 0 0 0 0 0 0 0 0 0 0 0 0 0 0 0 0 0 0 0 0 0 0 0 0 0 0 0 0 0 0 0 0 0 0 0 0 0 0 0 0 0 0 0 0 0 0 0 0 0 0 0 0 0 0 0 0 0 0 0 0 0 0 0 0 0 0 0 0 0 0 0 0 0 0 0 0 0 0 0 0 0 0 0 0 0 0 0 0 0 0 0 0 0 0 0 0 0 0 0 0 0 0 0 0 0 0 0 0 0 0 0 0 0 0 0 0 0 0 0 0 0 0 0 0 0 0 0 0 0 0 0 0 0 0 0 0 0 0 0 0 0 0 0 0 0 0 0 0 0 0 0 0 0 0 0 0 0 0 0 0 0 0 0 0 0 0 0 0 0 0 0 0 0 0 0 0 0 0 0 0 0 0 0 0 0 0 0 0 0 0 0 0 0 0 0 0 0 0 0 0 0 0 0 0 0 0 0 0 0 0 0 0 0 0 0 5 5 5 3 4 4 5 6 4 4 5 5 5 5 5 6 3 3 1 4 5 7 6 0 0 0 0 0 0 0 0 0 0 0 0 0 0 0 0 0 0 0 0 0 0 0 0 0 0 0 0 0 0 0 0 0 0 0 0 0 0 0 0 0 0 0 0 0 0 0 0 0 0 0 0 0 0 0 0 0 0 0 0 0 0 0 0 0 0 0 0 0 0 0 0 0 0 0 0 0 0 0 0 0 0 0 0 0 0 0 0 0 0 0 0 0 0 0 0 0 0 0 0 0 0 0 0 0 0 0 0 0 0 0 0 0 0 0 0 0 0 0 0 0 0 0 0 0 0 0 0 0 0 0 0 0 0 0 0 0 0 0 0 0 0 0 0 0 0 0 0 0 0 0 0 0 0 0 0 0 0 0 0 0 0 0 0 0 0 0 0 0 0 0 0 0 0 0 0 0 0 0 0 0 0 0 0 0 0 0 0 0 0 0 0 0 0 0 0 0 0 0 0 0 0 0 0 0 0 0 0 0 0 0 0 0 0 0 0 0 0 0 0 0 0 0 0 0 0 0 0 0 0 0 0 0 0 0 0 0 0 0 0 0 0 0 0 0 0 0 0 0 0 0 0 0 0 0 0 0 0 0 0 0 0 0 0 0 0 0 0 0 0 0 0 0 0 0 0 0 0 0 0 0 0 0 0 0 0 0 0 0 0 0 0 0 0 0 0 0 0 0 0 0 0 0 0 0 0 0 0 0 0 0 0 0 0 0 0 0 0 0 0 0 0 0 0 0 0 0 0 0 0 0 0 0 0 0 0 0 0 0 0 0 0 0 0 0 0 0 0 0 0 0 0 0 0 0 0 0 0 0 0 0 0 0 0 0 0 0 0 0 0 0 0 0 0 0 0 0 0 0 0 0 0 0 0 0 0 0 0 0 0 0 0 0 0 0 5 5 5 5 5 5 5 5 5 5 4 3 4 4 5 6 6 7 4 4 4 5 5 6 6 0 0 0 0 0 0 0 0 0 0 0 0 0 0 0 0 0 0 0 0 0 0 0 0 0 0 0 0 0 0 0 0 0 0 0 0 0 0 0 0 0 0 0 0 0 0 0 0 0 0 0 0 0 0 0 0 0 0 0 0 0 0 0 0 0 0 0 0 0 0 0 0 0 0 0 0 0 0 0 0 0 0 0 0 0 0 0 0 0 0 0 0 0 0 0 0 0 0 0 0 0 0 0 0 0 0 0 0 0 0 0 0 0 0 0 0 0 0 0 0 0 0 0 0 0 0 0 0 0 0 0 0 0 0 0 0 0 0 0 0 0 0 0 0 0 0 0 0 0 0 0 0 0 0 0 0 0 0 0 0 0 0 0 0 0 0 0 0 0 0 0 0 0 0 .... |
File 2. LC04_macrohydrology_river_sinuosity.csv
This file is in standard ESRI Arc/INFO ASCII Grid format. The file format consists of numeric fields of varying length, which are arranged in columns and rows. This data file provides river sinuosity, sometimes called the meander ratio, and is the ratio between the actual length of the river (measured on a map) and the length of the river as represented in the data set. This file contains 420 columns and 324 rows with the southwestern most corner at -21 degrees S, -80 degrees W; resolution 5-minute arc (12 cells per degree) (~9 km). It represents the 17th revision of the data file. Conventions: 0 is outside the basin, any number greater than zero is inside the basin.
| Format | Units | Content time range |
|---|---|---|
| Integer | Adimensional | Atemporal |
Example data record:
|
ncols 420 nrows 324 xllcorner -80 yllcorner -21 cellsize 12 NODATA_Value 0 0 0 0 0 0 0 0 0 0 0 0 0 0 0 0 0 0 0 0 0 0 0 0 0 0 0 0 0 0 0 0 0 0 0 0 0 0 0 0 0 0 0 0 0 0 0 0 0 0 0 0 0 0 0 0 0 0 0 0 0 0 0 0 0 0 0 0 0 0 0 0 0 0 0 0 0 0 0 0 0 0 0 0 0 0 0 0 0 0 0 0 0 0 0 0 0 0 0 0 0 0 0 0 0 0 0 0 0 0 0 0 0 0 0 0 0 0 0 0 0 0 0 0 0 0 0 0 0 0 0 0 0 0 0 0 0 0 0 0 0 0 0 0 0 0 0 0 0 0 0 0 0 0 0 0 0 0 0 0 0 0 0 0 0 0 0 0 0 0 0 0 0 0 0 0 0 0 0 0 0 0 0 0 0 0 0 0 0 0 0 0 0 0 0 0 0 0 0 0 0 0 0 0 0 0 0 0 0 0 0 0 0 0 0 0 0 0 0 0 0 0 0 0 0 0 0 0 0 0 0 0 0 0 0 0 0 0 104 104 104 0 0 0 0 0 0 0 0 0 0 0 0 0 0 0 0 0 0 0 0 0 0 0 0 0 0 0 0 0 0 0 0 0 0 0 0 0 0 0 0 0 0 0 0 0 0 0 0 0 0 0 0 0 0 0 0 0 0 0 0 0 0 0 0 0 0 0 0 0 0 0 0 0 0 0 0 0 0 0 0 0 0 0 0 0 0 0 0 0 0 0 0 0 0 0 0 0 0 0 0 0 0 0 0 0 0 0 0 0 0 0 0 0 0 0 0 0 0 0 0 0 0 0 0 0 0 0 0 0 0 0 0 0 0 0 0 0 0 0 0 0 0 0 0 0 0 0 0 0 0 0 0 0 0 0 0 0 0 0 0 0 0 0 0 0 0 0 0 0 0 0 0 0 0 0 0 0 0 0 0 0 0 0 0 0 0 0 0 0 0 0 0 0 0 0 0 0 0 0 0 0 0 0 0 0 0 0 0 0 0 0 0 0 0 0 0 0 0 0 0 0 0 0 0 0 0 0 0 0 0 0 0 0 0 0 0 0 0 0 0 0 0 0 0 0 0 0 0 0 0 0 0 0 0 0 0 0 0 0 0 0 0 0 0 0 0 0 0 0 0 0 0 0 0 0 0 0 0 0 0 0 0 0 0 0 0 0 0 0 0 0 0 0 0 0 0 0 0 0 0 0 0 0 0 0 0 0 0 0 0 0 0 0 0 0 0 0 0 0 0 0 0 0 0 0 0 0 0 0 0 0 0 0 0 0 0 0 0 0 0 0 0 0 0 0 0 0 0 0 0 0 0 0 0 0 0 0 0 0 0 0 0 0 0 0 0 0 0 0 0 0 0 0 0 0 0 0 0 0 0 0 0 0 0 0 0 0 0 0 0 0 0 0 0 0 0 0 0 0 0 0 0 0 0 0 0 0 0 0 0 0 0 0 113 113 113 104 104 104 104 104 104 104 104 0 0 0 0 0 0 0 0 0 0 0 0 0 0 0 0 0 0 0 0 0 0 0 0 0 0 0 0 0 0 0 0 0 0 0 0 0 0 0 0 0 0 0 0 0 0 0 0 0 0 0 0 0 0 0 0 0 0 0 0 0 0 0 0 0 0 0 0 0 0 0 0 0 0 0 0 0 0 0 0 0 0 0 0 0 0 0 0 0 0 0 0 0 0 0 0 0 0 0 0 0 0 0 0 0 0 0 0 0 0 0 0 0 0 0 0 0 0 0 0 0 0 0 0 0 0 0 0 0 0 0 0 0 0 0 0 0 0 0 0 0 0 0 0 0 0 0 0 0 0 0 0 0 0 0 0 0 0 0 0 0 0 0 0 0 0 0 0 0 0 0 0 0 0 0 0 0 0 0 0 0 0 0 0 0 0 0 0 0 0 0 0 0 0 0 0 0 0 0 0 0 0 0 0 0 0 0 0 0 0 0 0 0 0 0 0 0 0 0 0 0 0 0 0 0 0 0 0 0 0 0 0 0 0 0 0 0 0 0 0 0 0 0 0 0 0 0 0 0 0 0 0 0 0 0 0 0 0 0 0 0 0 0 0 0 0 0 0 0 0 0 0 0 0 0 0 0 0 0 0 0 0 0 0 0 0 0 0 0 0 0 0 0 0 0 0 0 0 0 0 0 0 0 0 0 0 0 0 0 0 0 0 0 0 0 0 0 0 0 0 0 0 0 0 0 0 0 0 0 0 0 0 0 0 0 0 0 0 0 0 0 0 0 0 0 0 0 0 0 0 0 0 0 0 0 0 0 0 0 0 0 0 0 0 0 0 0 0 0 0 0 0 0 0 0 0 0 0 0 0 0 0 0 0 0 0 0 0 0 0 0 0 0 0 0 0 0 0 0 0 0 0 0 0 0 0 0 0 113 113 113 113 104 104 104 104 104 104 104 104 0 0 0 0 0 0 0 0 0 0 0 0 0 0 0 0 0 0 0 0 0 0 0 0 0 0 0 0 0 0 0 0 0 0 0 0 0 0 0 0 0 0 0 0 0 0 0 0 0 0 0 0 0 0 0 0 0 0 0 0 0 0 0 0 0 0 0 0 0 0 0 0 0 0 0 0 0 0 0 0 0 0 0 0 0 0 0 0 0 0 0 0 0 0 0 0 0 0 0 0 0 0 0 0 0 0 0 0 0 0 0 0 0 0 0 0 0 0 0 0 0 0 0 0 0 0 0 0 0 0 0 0 0 0 0 0 0 0 0 0 0 0 0 0 0 0 0 0 0 0 0 0 0 0 0 0 0 0 0 0 0 0 0 0 0 0 0 0 0 0 0 0 0 0 0 0 0 0 0 0 0 0 0 0 0 0 0 0 0 0 0 0 0 0 0 0 0 0 0 0 0 0 0 0 0 0 0 0 0 0 0 0 0 0 0 0 0 0 0 0 0 0 0 0 0 0 0 0 0 0 0 0 0 0 0 0 0 0 0 0 0 0 0 0 0 0 0 0 0 0 0 0 0 0 0 0 0 0 0 0 0 0 0 0 0 0 0 0 0 0 0 0 0 0 0 0 0 0 0 0 0 0 0 0 0 0 0 0 0 0 0 0 0 0 0 0 0 0 0 0 0 0 0 0 0 0 0 0 0 0 0 0 0 0 0 0 0 0 0 0 0 0 0 0 0 0 0 0 0 0 0 0 0 0 0 0 0 0 0 0 0 0 0 0 0 0 0 0 0 0 0 0 0 0 0 0 0 0 0 0 0 0 0 0 0 0 0 0 0 0 0 0 0 0 0 0 0 0 0 0 0 0 0 0 0 0 0 0 0 0 0 0 0 0 0 0 0 0 0 0 0 0 0 0 0 0 0 0 113 113 113 113 104 104 104 104 104 104 104 104 0 0 0 0 0 0 0 0 0 0 0 0 0 0 0 0 0 0 0 0 0 0 0 0 0 0 0 0 0 0 0 0 0 0 0 0 0 0 0 0 0 0 0 0 0 0 0 0 0 0 0 0 0 0 0 0 0 0 0 0 0 0 0 0 0 0 0 0 0 0 0 0 0 0 0 0 0 0 0 0 0 0 0 0 0 0 0 0 0 0 0 0 0 0 0 0 0 0 0 0 0 0 0 0 0 0 0 0 0 0 0 0 0 0 0 0 0 0 0 0 0 0 0 0 0 0 0 0 0 0 0 0 0 0 0 0 0 0 0 0 0 0 0 0 0 0 0 0 0 0 0 0 0 0 0 0 0 0 0 0 0 0 0 0 0 0 0 0 0 0 0 0 0 0 0 0 .... |
File 3. LC04_macrohydrology_water_table_depth.dat
This file is in standard ESRI Arc/Info ASCII Grid format. The file format consists of numeric fields of varying length, which are delimited by a single space and arranged in columns and rows. This data file provides the spatial array of depth to the water table interpolated using a GIS and original well data from 81 wells located throughout the basins. There are 420 columns and 324 rows; southwestern most corner at -21 degrees S, -80 degrees W; resolution 5-minute arc (12 cells per degree) (~ 9 km). Conventions: -0.00000 is outside the basin; any number smaller than zero represents a below surface water table; and a number greater than zero represents a water table above the surface (a wetland, for example).
| Format | Units | Content time range |
|---|---|---|
| Real | meters | Unknown |
Example data record:
|
ncols 420 nrows 324 xllcorner -80 yllcorner -21 cellsize 12 NODATA_Value -0.00000 0,0,0,0,0,0,0,0,0,0,0,0,0,0,0,0,0,0,0,0,0,0,0,0,0,0,0,0,0,0,0,0,0,0,0,0,0,0,0,0,0,0,0,0,0,0,0,0,0,0,0,0, 0,0,0,0,0,0,0,0,0,0,0,0,0,0,0,0,0,0,0,0,0,0,0,0,0,0,0,0,0,0,0,0,0,0,0,0,0,0,0,0,0,0,0,0,0,0,0,0,0,0,0,0, 0,0,0,0,0,0,0,0,0,0,0,0,0,0,0,0,0,0,0,0,0,0,0,0,0,0,0,0,0,0,0,0,0,0,0,0,0,0,0,0,0,0,0,0,0,0,0,0,0,0,0,0, 0,0,0,0,0,0,0,0,0,0,0,0,0,0,0,0,0,0,0,0,0,0,0,0,0,0,0,0,0,0,0,0,0,0,0,0,0,0,0,0,0,0,0,0,0,0,0,0,0,0,0,0, 0,0,0,0,0,0,0,0,0,0,0,0,0,0,0,-6.78883,-6.53528,-6.4844,-6.43842,-6.39768,-6.36242,-6.33279,-6.30885,-6.29053, -6.27771,-6.27017,-6.26763,-6.26973,-6.27609,-6.28627,-6.29985,-6.31636,-6.33535,-6.47115,-6.49768,-6.5255, -6.55422, ... |
File 4. LC04_macrohydrology_aquifer_transmissivity.dat
This file is in standard ESRI Arc/Info ASCII Grid format. The file format consists of numeric fields of varying length, which are delimited by a single space and arranged in columns and rows. This file provides the spatial array of transmissivity of the aquifer interpolated using a GIS and original well data from 81 wells located throughout the basin. There are 420 columns and 324 rows; southwestern most corner at -21 degrees S, -80 degrees W; resolution 5-minute arc (12 grid cells per degree)(~9 km). Conventions 0.00000 is outside the basin, any number greater than zero is inside the basin and represents transmissivity.
| Format | Units | Content time range |
|---|---|---|
| Real | m2/day | Atemporal |
Example data record:
|
ncols 420 nrows 324 xllcorner -80 yllcorner -21 cellsize 12 NODATA_value 0.00000 0,0,0,0,0,0,0,0,0,0,0,0,0,0,0,0,0,0,0,0,0,0,0,0,0,0,0,0,0,0,0,0,0,0,0,0,0,0,0,0,0,0,0, 0,0,0,0,0,0,0,0,0,0,0,0,0,0,0,0,0,0,0,0,0,0,0,0,0,0,0,0,0,0,0,0,0,0,0,0,0,0,0,0,0,0,0, 0,0,0,0,0,0,0,0,0,0,0,0,0,0,0,0,0,0,0,0,0,0,0,0,0,0,0,0,0,0,0,0,0,0,0,0,0,0,0,0,0,0,0, 0,0,0,0,0,0,0,0,0,0,0,0,0,0,0,0,0,0,0,0,0,0,0,0,0,0,0,0,0,0,0,0,0,0,0,0,0,0,0,0,0,0,0, 0,0,0,0,0,0,0,0,0,0,0,0,0,0,0,0,0,0,0,0,0,0,0,0,0,0,0,0,0,0,0,0,0,0,0,0,0,0,0,0,0,0,0, 0,0,0,0,0,1.45616,1.44402,1.43296,1.60529,1.59794,1.59191,1.57063,1.56734, 1.56544,1.56492,1.56576,1.56792,1.57136,1.57605,1.58192,1.58893,1.59701, 1.50031,1.51068,1.52189,1.53388,1.54658,1.55994,2.05489,2.08357,2.11323, 0,0,0,0,0,0,0,0,0,0,0,0,0,0,0,0,0,0,0,0,0,0,0,0,0,0,0,0,0,0,0,0,0,0,0,0,0,0,0,0,0, 0,0,0,0,0,0,0,0,0,0,0,0,0,0,0,0,0,0,0,0,0,0,0,0,0,0,0,0,0,0,0,0,0,0,0,0,0,0,0,0,0, 0,0,0,0,0,0,0,0,0,0,0,0,0,0,0,0,0,0,0,0,0,0,0,0,0,0,0,0,0,0,0,0,0,0,0,0,0,0,0,0,0, 0,0,0,0,0,0,0,0,0,0,0,0,0,0,0,0,0,0,0,0,0,0,0,0,0,0,0,0,0,0,0,0,0,0,0,0,0,0,0,0, 0,0,0,0,0,0,0,0,0,0, ... |
File 5. LC04_macrohydrology_original_well_data.csv
This ASCII common-delimited file provides the original well data from 81 wells located throughout the basins. The parameters include depth to the water table, specific capacity of the aquifer, and aquifer transmissivity.
| Column | Heading | Units/format | Description |
|---|---|---|---|
| 1 | Latitude | decimal degrees | Well location provided in decimal degrees |
| 2 | Longitude | decimal degrees | Well location provided in decimal degrees |
| 3 | Depth of the water table | m | Depth to water table in well |
| 4 | Specific capacity | m3/h/m | Specific capacity of the aquifer |
| 5 | Aquifer transmissivity | m2/day | Horizontal flow in the aquifer |
Example data record:
| Latitude,Longitude,Depth of the water table,Specific capacity,Aquifer transmissivity -4.1, -79.48, -6.1, 7, 473.9 -4.27, -70.02, -8, 6.07, 430.7 -4.97, -68.88, -15, 0.87, 117.2 -4.88, -66.83, -13, 0.8, 110.8 ... |
File 6. LC04_macrohydrology_river_discharge.zip
This compressed file contains time series of monthly mean river discharge and long-term climatology (monthly means) of river discharge for the period of record at each of the 122 fluviometric stations located throughout the basins. The files are provided in ASCII common-separated (.csv) format. File names correspond to station number (e.g., 001.csv pertains to station #1, Javari at Estirão do Repouso). Temporal coverage varies in number of years for each station. Overall, the period of record is 1967-1996. Missing data (cells) are blank.
| Column | Heading | Units/format | Description |
|---|---|---|---|
| Time Series | |||
| 1 | Year | yyyy | Year in which river discharge was measured |
| 2 | Month | 1-12 | Month in which river discharge was measured (1-12) |
| 3 | Discharge | m3/s | Mean monthly river discharge in cubic meters per second |
| 4 | None | NA | NA |
| Climatology | |||
| 5 | Month | m3/h/m | Month for which long-term mean river discharge was calculated in cubic meters per hour per month |
| 6 | Discharge | m3/s | Long-term mean monthly river discharge for period of record in cubic meters per second |
Example data records:
|
Year,Month,Discharge (m3/s),Month,Discharge (m3/s) 1980,1,,January,3082.8 1980,2,,February,3356.8 1980,3,,March,3793.7 1980,4,,April,3893.9 1980,5,,May,3733.5 1980,6,,June,2562.3 1980,7,,July,1475.7 1980,8,,August,737.1 1980,9,,September,914.2 1980,10,,October,1502.9 1980,11,2231.6,November,2169.8 1980,12,2554.6,December,2808.2 1981,1,2416.7,, 1981,2,3128.3,, 1981,3,4031.5, ... |
File 7. LC04_macrohydrology_river_station.csv
This ASCII common-delimited file provides fluviometric station number, code number, and name, ANEEL drainage area, drainage area computed in this data set, error (difference between the calculated drainage areas), station latitude and longitude, and the x and y coordinates for 122 gauging stations located throughout the basins. The x and y coordinates are compatible with the river network file
| Column | Heading | Units/format | Description |
|---|---|---|---|
| 1 | Station Number | numeric | Fluviometric station number |
| 2 | ANEEL Code | numeric | Eight-digit ANEEL code for each fluviometric station |
| 3 | River | text | Name of river where fluviometric station is located |
| 4 | ANEEL Drainage Area | km2 | Drainage of river basin (calculated by ANEEL) in square kilometers |
| 5 | Data Set Drainage Area | km2 | Drainage of river basin (calculated by this data set) in square kilometers |
| 6 | Error | % | Difference between the calculated drainage areas |
| 7 | Latitude | decimal degrees | Latitude of fluviometric station |
| 8 | Longitude | decimal degrees | Longitude of fluviometric station |
| 9 | x coordinate | numeric | x coordinate of the station (compatible with the river network file) |
| 10 | y coordinate | numeric | y coordinate of the station (compatible with the river network file) |
Example data records:
| Station Number,ANEEL Code,River,ANEEL Drainage Area,Data Set Drainage Area,Error,Latitude,Longitude,x coordinate,y coordinate 1,10500000,Javari at Estir‹o do Repouso,58434,58107,-0.6,-4.36667,-70.93333,109,125 2,11200000,Solim›es at Teresina,969497,983157,1.4,-4.28333,-69.73333,124,124 3,11400000,Solim›es at S‹o Paulo de Olivena,980717,990781,1,-3.48333,-68.75,136,114 ... 120,24200000,Araguaia at TorixorŽu,19049,19100,0.3,-16.25,-52.5,331,267 121,24700000,Araguaia at Barra do Garas,36537,36432,-0.3,-15.83333,-52.2,334,263 122,25700000,Araguaia at Bandeirantes,95861,92638,-3.4,-13.68333,-50.8,351,237 |
Site boundaries: (All latitude and longitude given in decimal degrees)
| Site (Region) | Westernmost Longitude | Easternmost Longitude | Northernmost Latitude | Southernmost Latitude | Geodetic Datum |
|---|---|---|---|---|---|
| Amazon Basin | -80 | -45 | 6 | -21 | World Geodetic System, 1984 (WGS-84) |
Time period:
- The data set covers the period 1967/01/01 to 1996/12/31.
- Temporal Resolution: River network: atemporal; River sinuosity: atemporal; River discharge: monthly; Depth of the water table: unknown; Aquifer transmissivity: atemporal
Platform/Sensor/Parameters measured include:
- COMPUTER MODEL / MODEL ANALYSIS / RIVER NETWORK
- COMPUTER MODEL / MODEL ANALYSIS / RIVER SINUOSITY
- COMPUTER MODEL / MODEL ANALYSIS / DISCHARGE/FLOW
- COMPUTER MODEL / MODEL ANALYSIS / WATER TABLE DEPTH
- COMPUTER MODEL / MODEL ANALYSIS / AQUIFER TRANSMISSIVITY
3. Data Application and Derivation:
The data set will be useful for implementing river routing schemes and further types of models that are based on river routing, such as sediment transport and river chemistry models. Applications of these models include macro-scale hydrological studies and validation of climate models, in the context of the Amazon basin.
Part of this data set was required in the development of the continental-scale hydrological routing model HYDRA [now known as Terrestrial Hydrology Model with Biogeochemistry (THMB 1.2)] and its application to the Amazon basin. HYDRA/THMB 1.2 represents phenomena like floods, backwater effects, and seasonal hydrography much more realistically than previous generations of macrohydrological routing models.
4. Quality Assessment:
Development of this river network data set involved 17 iterations. The data set was judged by the investigators to be of acceptable quality, using the criteria that the drainage area determined using the river network data set was within 5% of the drainage area reported by the ANEEL data set for 122 stations spread throughout the basins. The only exception happened in station 32 (Aripuanã River at Prainha), with an error of –8.1%. In this case, there was either an error in the ANEEL estimate of the drainage area or in the IBGE map used. It was impossible to reconcile the differences between them.
Refinement of the river network helped to assure quality sinuosity data. Similarly, careful checking during the measurements of sinuosity ensured the accuracy of the river directions. Despite careful procedure, however, there are some regions of the basin, like the lower Negro River, where the river network data set is uncertain. Such regions are usually flat and flooded most of the year, making it difficult to define the direction of the river flow. Besides, those regions do not have ANEEL stations to be used as checkpoints.
When represented in a gridded framework, sinuosity varies strongly
according to the grid resolution. As the resolution increases, the actual path
of the river tends to be represented more realistically by the river network
data set, and the sinuosity tends to the value of 1.0. However, an analysis of
the sinuosity data for the rivers of the Amazon and Tocantins basins
Use of underestimated sinuosity parameters can introduce errors on the timing of the simulated river seasonal hydrograph and on the simulated amount of water stored in the river channel.
The investigators caution that the groundwater data in this data set should be considered as a first approximation of a data set required by a more physically-based model of groundwater flow for two reasons. First, the density of data collection points for the groundwater characteristics (81 wells spread throughout the basins) was too low. In addition, the groundwater measurements (specific capacity of the aquifer and depth of the water table) were single measurements taken in a single day, which do not reflect seasonal and interannual variability of the depth of the water table.
In the Amazon basin, there is low correlation (ρ = 0.14) between the depth of the water table and the aquifer transmissivity. However, the investigators found that the aquifers in the Andes and in the eastern border of the basin have higher transmissivity than in the rest of the basin.
5. Data Acquisition Materials and Methods:
River Network and Basin Border
The river network of the Amazon and Tocantins river basins is presented in gridded format at the resolution of five minutes of arc (~ 9 km). Four sources are used to assemble and validate the data set: (1) a 1:1.000.000 map of Northern South America; (2) a 1:5.000.000 hydrogeological map of South America; (3) the global river network digital data set of Graham et al. (1999); and (4) a data set of drainage areas upstream of specific points (fluviometric stations), provided by ANEEL (the Brazilian Agency for Waters and Electrical Energy).
The construction of this part of the data set required three steps: (1) determination of the basin borders; (2) determination of the river network; and (3) refinement of the river network to assure quality sinuosity data.
(1)Determination of the Basin Borders. Initially, two borders were drawn independently. The first one was digitized from a 1:5.000.000 hydrogeological map of South America, which has the borders of the Amazon and Tocantins basins marked. The second one was digitized from a 1:1.000.000 map of Northern South America (Brazil–IBGE, 1972). This map does not show the basin borders, so it was assumed that the border would be in the middle point between nearby rivers that run into and out of the basin. Then, the two maps were overlaid and an initial version of the basin mask was obtained by careful analysis of the regions where the two borders disagreed. The final version was obtained together with the river network, to match the drainage areas of fluviometric stations, provided by ANEEL (see next step).
(2)Determination of the River Network. The river network was derived from the global river network data set of Graham et al. (1999), which had only the directions of the largest Amazon basin rivers (e.g., the Amazon main stem, the Negro, the Madeira, etc.) properly geolocated, and a Digital Elevation Model. This data set was cropped using the initial version of the basin mask obtained in the previous step. After that, hundreds of smaller river sections in the Amazon and Tocantins basins were digitized from a 1:1.000.000 map of Northern South America, ensuring their proper geolocation. In an iterative procedure, part of the river network was modified to adjust the internal sub-basin borders to match the drainage areas of 122 fluviometric stations, provided by ANEEL. Some external borders were changed in this process too. After 17 iterations, the river network data set had acceptable quality, using the criteria that the drainage area determined using the river network data set would be within 5% of the drainage area reported by the ANEEL data set for 122 stations spread throughout the basins. The only exception happened in station 32 (Aripuanã River at Prainha), with an error of –8.1%. In this case, we believe there is either an error in the ANEEL estimate of the drainage area or in the IBGE map we used, since it is impossible to reconcile the differences between them.
(3)Refinement of the River Network. During the measurement of sinuosity, the river network data set was revised so that the data set resembled the actual path of these river sections in the best possible way for a resolution of 5 minutes of arc.
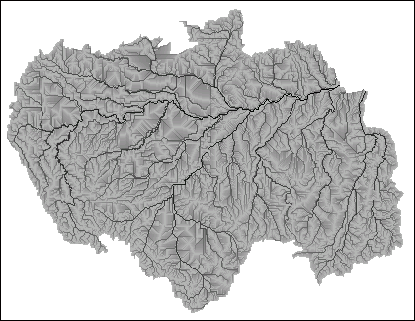
Figure 2. The final river network at five-minute resolution. From Costa et al. 2002.
River Discharge and River Stage
Discharge data at 122 specific checkpoints, including stations with small drainage areas, were used to validate the macrohydrological model. Considering that some current models simulate the height of water in the rivers, data of river stage for model validation was also included. The list of stations with discharge and stage data is provided in Costa et al. (2002).
The original daily river discharge and stage data set was obtained from ANEEL, the Brazilian National Agency for Waters and Electrical Energy. This data set provides time series of monthly means only.

Figure 3. Location of fluviometric stations in the Amazon basin. Network of 122 fluviometric stations provided by the ANEEL (Brazilian Agencyfor Waters and Electrical Energy). From Costa et al. 2002.
Sinuosity
Sinuosity, sometimes called the meander ratio, is the ratio between the actual length of the river (measured on a map) and the length of the river as represented in the data set. The actual length of 111 sections of Amazonian rivers was measured on a 1:1.000.000 map of Northern South America using a curvimeter (with three repetitions) and was then divided by the length of the same path in the data set. During the measurement, the river network data set was revised, so that the data set resembled the actual path of these river sections in the best possible way for a resolution of 5 minutes of arc.
Assuming the fluvial geomorphologic processes were the same, the sinuosity measured for the main channel in the section was extrapolated to the tributaries in that subbasin. The sinuosity of the grid cells near the mouth of the Amazon River, downstream of the last measurements, was set to 1.00. Outside of the basin, sinuosity was set to 0.00.
Groundwater
Measurements of the depth of the water table and specific capacity of the aquifer, collected at 81 wells spread throughout the basins, were digitized from a 1:5.000.000 hydrogeological map of South America (Brazil-DNPM/UNESCO, 1996). The original well measurements were interpolated using a Geographical Information System, producing maps of the depth of the water table and of specific capacity. The maps of specific capacity are not included in this data set.
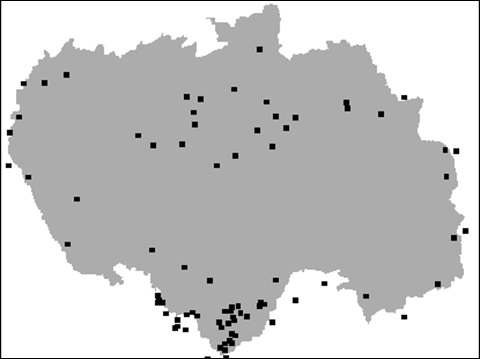
Figure 4. Location of 81 groundwater wells where data were collected. From Costa et al. 2002.
Aquifer Transmissivity
Aquifer transmissivity is a measure of the amount of water that can be transmitted horizontally through a unit width by a full-saturated thickness of the aquifer under a hydraulic gradient of 1. For horizontal flow in an aquifer, it is usually a more useful parameter than the horizontal hydraulic conductivity.
The specific capacity of the aquifer was transformed into the aquifer transmissivity using the empirical relationship of Razack and Huntley (1991).
6. Data Access:
This data is available through the Oak Ridge National Laboratory (ORNL) Distributed Active Archive Center (DAAC).
Data Archive Center:
Contact for Data Center Access Information:
E-mail: uso@daac.ornl.gov
Telephone: +1 (865) 241-3952
7. References:
Costa, M.H., C.H.C. Oliveira, R.G. Andrade, T.R. Bustamante, F.A. Silva, and M.T. Coe. 2002. A macroscale hydrological data set of river flow routing parameters for the Amazon Basin. Journal of Geophysical Research-Atmospheres 107(D20):Article-8039.