Get Data
Summary:
This data set provides simulated minimum, average, and maximum monthly rainfall, potential evapotranspiration, water deficit, and water surplus values for the Ji-Parana River basin, Rondonia, Brazil. The Thornthwaite–Mather climatological model integrated into a Geographic Information System (GIS) was used to simulate water fluxes by utilizing Advanced Very High Resolution Radar (AVHRR) images for temperatures, rainfall amounts from gauges within and around the basin, soil profiles, and land cover maps as model inputs. The monthly water balance for the Ji-Parana river basin is simulated from February 1995 through December 1996.
Data are also provided from the Ji-Parana subbasin stations for total basin rainfall, basin discharge, and basin evapotranspiration. These data were used to check the results of the water balance model. There are 2 comma-delimited data files with this data set.
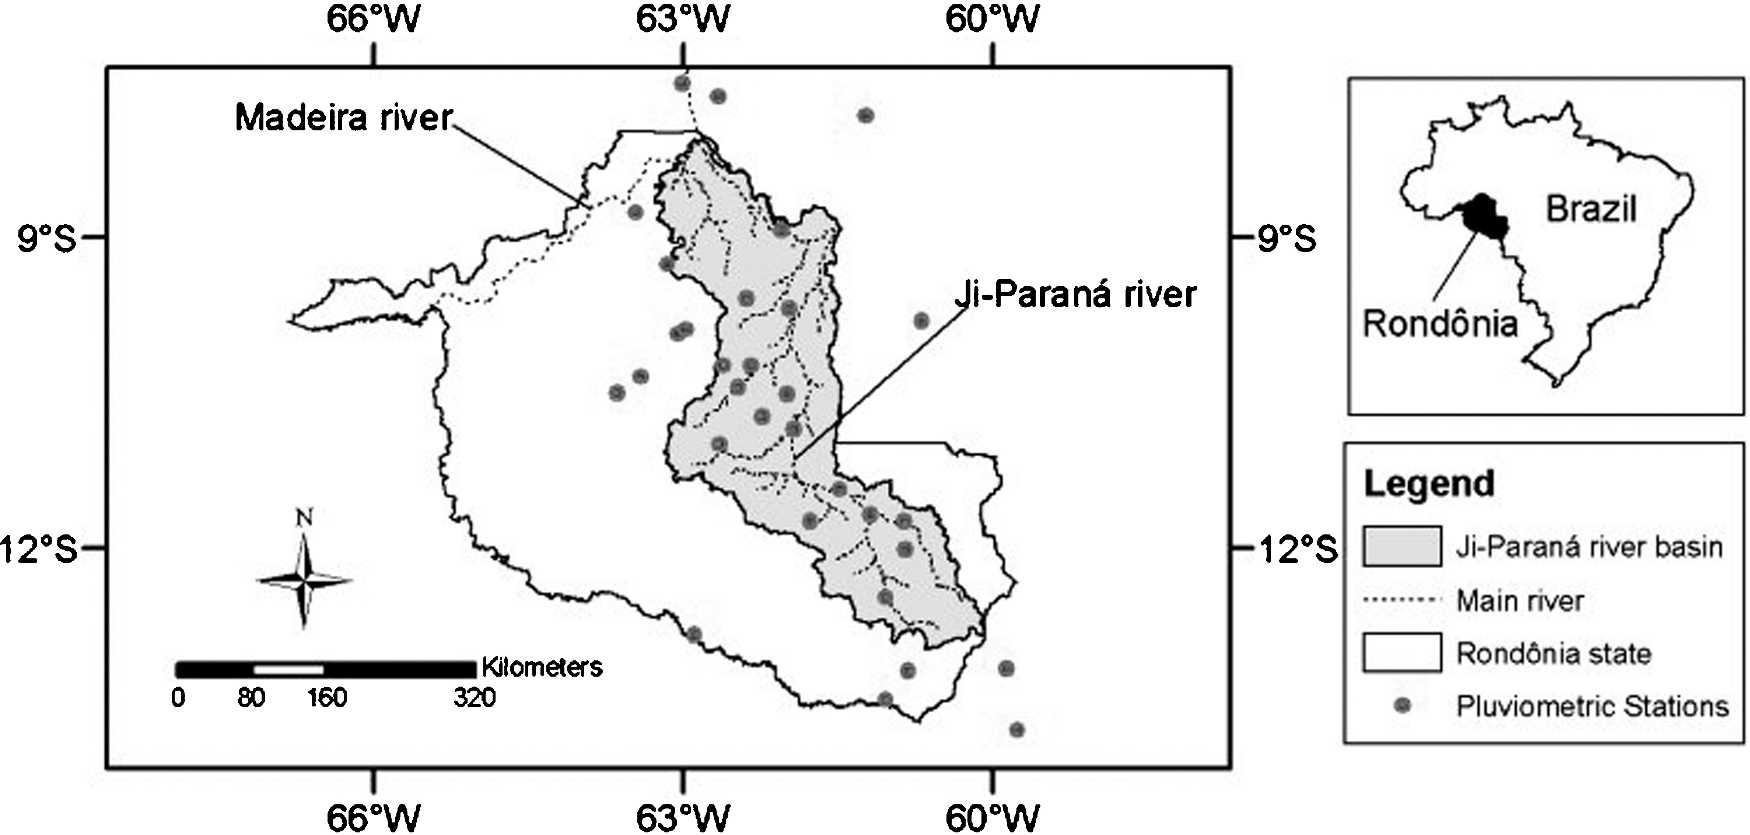
Figure 1. The Ji-Parana river basin and its location within the state of Rondonia and Brazil along with rainfall gauges.
Data Citation:
Cite this data set as follows:
Victoria, D.C., M.V.R. Ballester, A.R. Pereira, L.A. Martinelli, J.E. Richey, and R.L. Victoria. 2012. LBA-ECO CD-06 Water Balance of the Ji-Parana River Basin, Brazil: 1995-1996. Data set. Available on-line [http://daac.ornl.gov] from Oak Ridge National Laboratory Distributed Active Archive Center, Oak Ridge, Tennessee, U.S.A. http://dx.doi.org/10.3334/ORNLDAAC/1132
Implementation of the LBA Data and Publication Policy by Data Users:
The LBA Data and Publication Policy [http://daac.ornl.gov/LBA/lba_data_policy.html] is in effect for a period of five (5) years from the date of archiving and should be followed by data users who have obtained LBA data sets from the ORNL DAAC. Users who download LBA data in the five years after data have been archived must contact the investigators who collected the data, per provisions 6 and 7 in the Policy.
This data set was archived in September of 2012. Users who download the data between September 2012 and August 2017 must comply with the LBA Data and Publication Policy.
Data users should use the Investigator contact information in this document to communicate with the data provider. Alternatively, the LBA website [http://lba.inpa.gov.br/lba/] in Brazil will have current contact information.
Data users should use the Data Set Citation and other applicable references provided in this document to acknowledge use of the data.
Table of Contents:
- 1 Data Set Overview
- 2 Data Characteristics
- 3 Applications and Derivation
- 4 Quality Assessment
- 5 Acquisition Materials and Methods
- 6 Data Access
- 7 References
1. Data Set Overview:
Project: LBA (Large-Scale Biosphere-Atmosphere Experiment in the Amazon)
Activity: LBA-ECO
LBA Science Component:
Activity: Land Surface Hydrology
Team ID: CD-06 (Richey / Victoria)
The investigators were Richey, Jeffrey E.; Victoria, Reynaldo Luiz; Aalto, RolfErhart; Abdo, Mara Silvia Aguiar; Alin, SimoneRebecca; Aufdenkampe, Anthony K.; Ballester, Maria Victoria Ramos; Bernardes, Marcelo Correa; Bolson, Marcos Alexandre; Bonelle, Nilton; Brito, David Silva; Cogo, Michelle Cristine; Cunha, HillandiaBrandao; Silva, Luis VilmarSouza da; Deus, Fabiano Alves de; Devol, Allan H.; Ellis, ErinElizabeth; Fernandes, Erick C.M.; Ferro, JadersonCoradi; Filho, Walter Jorge do Nascimento; Frickmann, Fernando Cruz; Guandique, Manuel Enrique Gamero; Gomes, Beatriz M.; Neto, Sergio CandidoGouveia; Hanada, Laisde Carvalho; Higuchi, Niro; Holtgrieve, Gordon William; Krusche, Alex V.; Leite, NeiKavaguichi; Logsdon, Miles Grant; Macedo, Gelsonde; Marcondes, Renata; McGeoch, Lauren; Moreira, Marcelo Zacharias; Neu, Vania; Ometto, Jean Pierre H.B.; Pimentel, Tania Pena; Filho, Nicolau Priante; Rasera, Maria de FatimaFernandesLamy; Remington, SonyaMarie; Rodda, Sarah; Salimon, CleberIbraim; Santiago, AlailsonVenceslau; Toledo, AndreMarcondesAndrade; Tumang, Cristiane Azevedoand Victoria, Daniel de Castro. You may contact Ballester, Maria Victoria Ramos (vicky@cena.usp.br).
LBA Data Set Inventory ID: CD06_Water_Balance_JiParana
This data set provides simulated minimum, average, and maximum monthly rainfall, potential evapotranspiration, water deficit, and water surplus values for the Ji-Parana River basin, Rondonia, Brazil. The Thornthwaite–Mather climatological model integrated into a Geographic Information System (GIS) was used to simulate water fluxes by utilizing Advanced Very High Resolution Radar (AVHRR) images for temperatures, rainfall amounts from gauges within and around the basin, soil profiles, and land cover maps as model inputs. The monthly water balance for the Ji-Parana river basin is simulated from February 1995 through December 1996 (Victoria et al., 2007).
Data are also provided from the Ji-Parana subbasin stations for total basin rainfall, basin discharge, and basin evapotranspiration. This data was used to check the results of the water balance model.
2. Data Characteristics:
This data set provides annual water mass balance for 10 sub-basins inside the Ji-Parana basin (Rondonia), from September 1995 to August 1996 and modeled monthly water balance estimates. Data are provided as two comma-delimited ASCII files:
File #1: CD06_JiParana_Modeled_Water_Balance.csv
File #2: CD06_Water_Mass_Balance_Ji_Parana.csv
File #1: CD06_Modeled_Water_Balance_JiParana.csv
Data description: Ji-Parana, Rondonia, Modeled Water Balance, February 1995 - December 1996
| Column | Heading | Units/format | Description |
|---|---|---|---|
| 1 | Date | yyyymmdd | Date (yyyymmdd) |
| 2 | P_min | mm | Monthly minimum basin rainfall (P) in millimeters (mm) |
| 3 | P_med | mm | Monthly average basin rainfall (P) in millimeters (mm) |
| 4 | P_max | mm | Monthly maximum basin rainfall (P) in millimeters (mm) |
| 5 | PET_min | mm | Monthly minimum basin potential evapotranspiration (PET) in millimeters (mm) |
| 6 | PET_med | mm | Monthly average basin potential evapotranspiration (PET) in millimeters (mm) |
| 7 | PET_max | mm | Monthly maximum basin potential evapotranspiration (PET) in millimeters (mm) |
| 8 | ET_min | mm | Monthly minimum basin evapotranspiration (ET) in millimeters (mm) |
| 9 | ET_med | mm | Monthly average basin evapotranspiration (ET) in millimeters (mm) |
| 10 | ET_max | mm | Monthly maximum basin evapotranspiration (ET) in millimeters (mm) |
| 11 | DEF_min | mm | Monthly minimum basin water deficit (DEF) in millimeters (mm) |
| 12 | DEF_med | mm | Monthly average basin water deficit (DEF) in millimeters (mm) |
| 13 | DEF_max | mm | Monthly maximum basin water deficit (DEF) in millimeters (mm) |
| 14 | SUR_min | mm | Monthly minimum basin water surplus (SUR) in millimeters (mm) |
| 15 | SUR_med | mm | Monthly average basin water surplus (SUR) in millimeters (mm) |
| 16 | SUR_max | mm | Monthly maximum basin water surplus (SUR) in millimeters (mm) |
Example data records:
|
Date,P_min,P_med,P_max,PET_min,PET_med,PET_max,ET_min,ET_med,ET_max,DEF_min,DEF_med, DEF_max,SUR_min,SUR_med,SUR_max 19950201,124,349,587,59,99,138,59,99,138,0,0,0,9,251,527 19950301,94,225,356,79,121,162,82,121,162,0,2,19,0,109,269 19950401,65,201,378,73,108,130,73,108,130,0,2,22,0,101,290 ... 19960301,94,325,523,79,110,140,79,110,140,0,0,1,0,217,437 19960401,47,186,253,73,104,130,73,104,130,0,2,28,0,86,169 19960501,1,65,170,89,109,125,53,102,124,0,8,62,0,19,71 ... 19961001,33,172,364,104,139,160,33,125,155,0,32,121,0,6,195 19961101,26,268,504,69,118,151,27,116,151,0,32,109,0,59,378 19961201,92,289,566,81,118,151,85,118,151,0,1,8,0,103,400 |
File #2: CD06_Water_Mass_Balance_Ji_Parana.csv
Data description: Water mass balance for 10 sub-basins on the Ji-Parana (Rondonia) basin for September 1995 to August 1996. This data was used to check the results of a simple water balance model based on Thorthwaite-Mather water balance, spatially distributed. This data is from Table 1 in the related paper (Victoria, D., et al. 2007).
| Column | Heading | Units/format | Description |
|---|---|---|---|
| 1 | Sub_basin | Ji-Parana sub-basin, defined by the Brazilian national water agency, ANA | |
| 2 | Station_code | Fluviometric station code assigned by ANA | |
| 3 | Basin_area | km2 | Drainage basin area in square kilometers (km2) |
| 4 | Rainfall | mm/yr | Total basin rainfall in millimeters per year (mm year-1) between September 1995 to August 1996, calculated by interpolating rain gauge data from ANA, interpolation method: spline with tension. |
| 5 | Discharge | mm/yr | Total basin discharge in millimeters per year (mm year-1) for the period: September 1995 to August 1996, measured at ANA fluviometric station |
| 6 | ET | mm/yr | Total basin evapotranspiration in millimeters per year (mm year-1) calculated as the difference from rainfall and discharge over a water year (September 1995 to August 1996) |
Example data records:
|
Sub_basin,Station_code,Area,Rainfall,Discharge,ET Minerao Jacunda,15590000,1130,2180,719,1461 Fazenda Expanso,15553500,3575,1998,678,1320 Jaru,15565000,3952,1768,815,953 Fazenda Flor do Campo,15552600,4299,2187,810,1377 Piratininga,15575000,4379,2280,867,1413 Comemorao,15552700,5800,2201,844,1357 Cachoeira Primavera,15556010,9599,1975,791,1184 Pimenta Bueno,15558000,10080,1978,745,1233 Ji-Parana,15560000,32893,2018,796,1222 Tabajara,15580000,60205,2024,806,1218 |
Site boundaries: (All latitude and longitude given in decimal degrees)
| Site (Region) | Westernmost Longitude | Easternmost Longitude | Northernmost Latitude | Southernmost Latitude | Geodetic Datum |
|---|---|---|---|---|---|
| Rondonia - Rio Ji-Parana (Rondonia) | -63.41528 | -60.015 | -8.0333 | -12.92694 | World Geodetic System, 1984 (WGS-84) |
Time period:
- The data set covers the period 1995/09/01 to 1996/12/31
- Temporal Resolution: Monthly: February 1995 to December 1996; Annual: September 1995 to August 1996
Platform/Sensor/Parameters measured include:
- COMPUTER MODEL / ANALYSIS / SOIL ROOTING DEPTH
- COMPUTER MODEL / ANALYSIS / EVAPOTRANSPIRATION
- METEOROLOGICAL STATION / RAIN GAUGE / PRECIPITATION AMOUNT
- STREAMFLOW STATION / STREAM GAUGE / DISCHARGE/FLOW
3. Data Application and Derivation:
Data set can be used to determine water deficit period in basin as well as the mean basin evapotranspiration.
Drastic land cover changes scenarios can be evaluated, such as deforestation, which influences the water and energy balance since the water stored in the deeper soil layers will no longer be accessible to the vegetation. Simple deforestation simulations were carried out by changing the rooting depth of the entire basin, with three scenarios: 1) basin with no deforestations, with 5-m rooting depth (mean plant available water (PAW) 582 mm); 2) intermediate scenario with 2-m rooting depth (mean PAW 233 mm); and 3) complete deforestation, with basin covered by degraded pasture systems, a mixture of pasture and shrub vegetation, with 0.7-m rooting depth on the entire basin (mean PAW 81 mm) (Victoria et al., 2007).
4. Quality Assessment:
Modeled results for September 1995 to August 1996 were compared with annual water mass balance for the same time period. For a more detailed quality assessment, as well as methods and results, see Victoria et al., (2007).
5. Data Acquisition Materials and Methods:
Site Description
In the state of Rondonia, Brazil, (Western Amazonia), the confluence of the Comemoracao and Pimenta Bueno Rivers results in the Ji-Parana River, which also receives water from the Rolim de Moura, Urupa, Jaru, Machadinho and Preto tributaries. The Ji-Parana River Basin drains an area of 75,000 km2, and is characterized by extensive development in the upper part, and slight alteration in the lower 400 km. From headwaters to its middle sectors, the river is highly impacted, with a predominance of pastures and agriculture. The lower reach, below the intersection with Jaru and Machadinho Rivers, reverts to relatively pristine natural forest surroundings (Ballester et al., 2002).
Thornthwaite–Mather water balance model
The Thornthwaite and Mather (Thornthwaite and Mather 1955) climatological water balance is a bucket-like model and was chosen because of its simplicity and small quantity of input data needed. Actual evapotranspiration (ET) is computed using an estimate of potential evapotranspiration (PET) and observed rainfall (P). When P > or = PET, then ET = PET, and water surplus (SUR) can be generated. If soil water content (Sto) is below the defined plant available water (PAW), then part of P − PET is used to recharge the soil moisture. When P < PET, water will be removed from the soil. Since there is a restriction to water removal from the soil, ET can be less than PET, resulting in a water deficit (DEF) (Victoria et al., 2007).
Model inputs
Model inputs were Advanced Very High Resolution Radar (AVHRR) images, rainfall from rain gauges within and around the basin, soil profiles, and land cover maps. Mean monthly temperature images, estimated from AVHRR, were used to calculate monthly potential evapotranspiration images. Rainfall measurements were interpolated to obtain monthly rainfall images using the spline method.
Mean monthly temperature maps
Mean monthly temperature maps from February 1995 to December 1996 were obtained from daily images of the Advanced Very High Resolution Radiometer (AVHRR) sensor on board the National Oceanic and Atmospheric Administration- 14 (NOAA-14) satellite (Victoria et al., 2007).
Rainfall maps
Rainfall gauges located inside and close to the Ji-Paraná river basin were used to interpolate monthly total rainfall maps for the period February 1995 to December 1996. Data from 36 rain gauges with daily measurements, 17 located inside the basin (4400 km2 per gauge), were obtained. Monthly rainfall for each station was calculated, excluding months with 5 or more days with missing measurements. On average, 34 stations were available for each month (Victoria et al., 2007).
Soils
756 soil profiles from the SIGTERON database (Cochrane and Cochrane 1998) were geostatistically interpolated to obtain a map of soil clay content for the basin.
Water mass balance
The Ji-Parana river basin was divided into 10 subbasins where discharges were available. For each subbasin, a simple annual water mass balance was applied for comparison with the modeled water balance. Mass balance was obtained for an entire hydrological year (September 1995–August 1996) by the difference between annual rainfall and discharge over each subbasin (Victoria et al., 2007).
6. Data Access:
This data is available through the Oak Ridge National Laboratory (ORNL) Distributed Active Archive Center (DAAC).
Data Archive Center:
Contact for Data Center Access Information:
E-mail: uso@daac.ornl.gov
Telephone: +1 (865) 241-3952
7. References:
Ballester, M. V. R., and Coauthors, 2003: Land use/cover of the Ji-Paraná river basin: Building a GIS-based physical template to support the understanding of the biogeochemistry of surface waters in a meso-scale river in Western Amazonia. Remote Sens. Environ., 87, 429–445.
Cochrane, T. T., and T. A. Cochrane, 1998: SIGTERON, Sistema de Informação Geográfica para os terrenos e solos do Estado de Rondônia, Brasil. Tecnosolo/DHV Consultants BV, Porto Velho, Brazil.
Thornthwaite, C.W. and J. R. Mather. 1955. The water balance. Publications in Climatology, Drexel Institute of Technology, 104 pp.
Victoria, D.D., A.V. Santiago, M.V.R. Ballester, A.R. Pereira, R.L. Victoria, and J.E. Richey. 2007. Water Balance for the Ji-Parana River Basin, Western Amazon, Using a Simple Method through Geographical Information Systems and Remote Sensing. Earth Interactions. Volume 11 (2007). Paper No. 5. DOI 20 10.1175/EI198.1 [LBA-ECO Pub # 837]