Get Data
Summary:
This data set provides a land use/land cover map at 30 m resolution of the Ji-Parana River Basin in the state of Rondonia, Brazil produced from the digital classification of eight Landsat 7-ETM+ scenes from 1999 acquired from the Tropical Rain Forest Information Center (TRFIC) at Michigan State University. Nine land cover classes covering the Ji-Parana Basin were identified. There is one GeoTiff file with this data set.
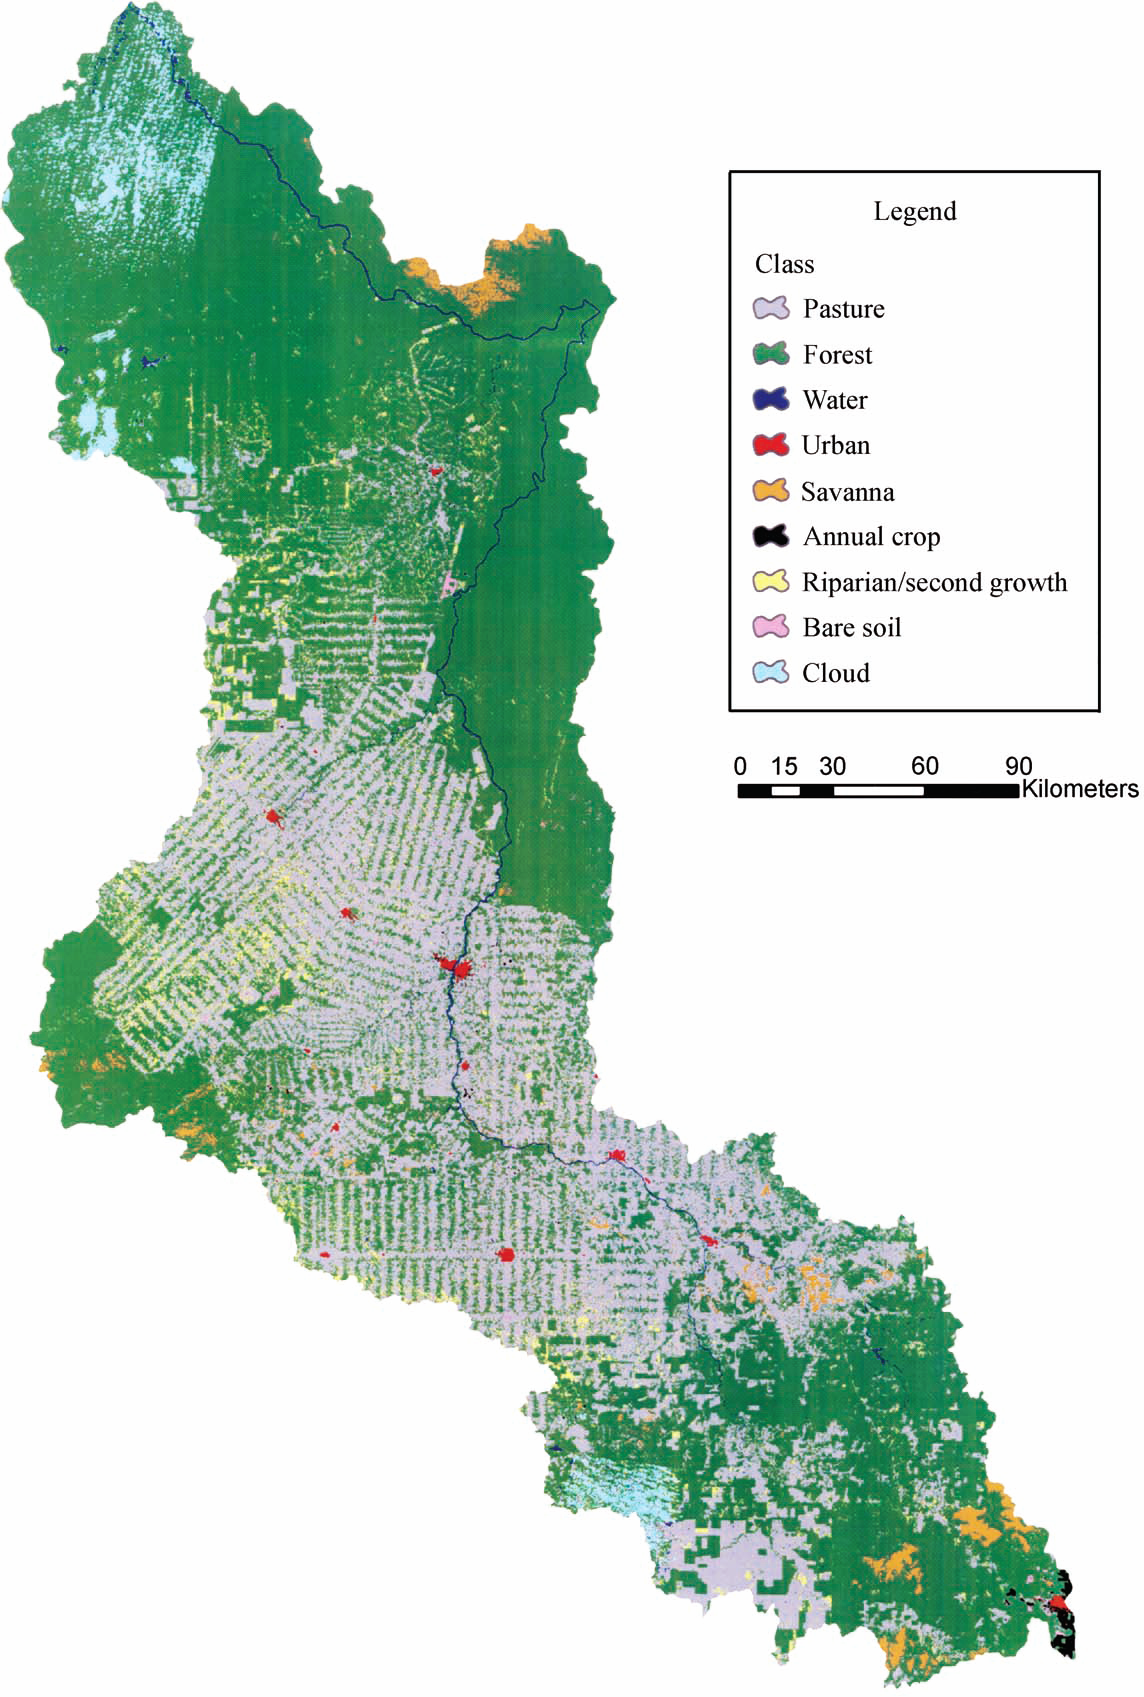
Land-use/cover map of the Ji-Parana River Basin in 1999 produced by the digital classification of eight Landsat 7 ETM+ images.
Data Citation:
Cite this data set as follows:
Ballester, M.V.R., D. de C. Victoria, R. Coburn, A.V. Krusche, R.L. Victoria, J.E. Richey, M.G. Logsdon, E. Mayorga, and E. Matricardi. 2012. LBA-ECO CD-06 Ji-Parana River Basin Land Use and Land Cover Map, Brazil: 1999. Data set. Available on-line [http://daac.ornl.gov] from Oak Ridge National Laboratory Distributed Active Archive Center, Oak Ridge, Tennessee, U.S.A. http://dx.doi.org/10.3334/ORNLDAAC/1087
Implementation of the LBA Data and Publication Policy by Data Users:
The LBA Data and Publication Policy [http://daac.ornl.gov/LBA/lba_data_policy.html] is in effect for a period of five (5) years from the date of archiving and should be followed by data users who have obtained LBA data sets from the ORNL DAAC. Users who download LBA data in the five years after data have been archived must contact the investigators who collected the data, per provisions 6 and 7 in the Policy.
This data set was archived in May of 2012. Users who download the data between May 2012 and April 2017 must comply with the LBA Data and Publication Policy.
Data users should use the Investigator contact information in this document to communicate with the data provider. Alternatively, the LBA website [http://lba.inpa.gov.br/lba/] in Brazil will have current contact information.
Data users should use the Data Set Citation and other applicable references provided in this document to acknowledge use of the data.
Table of Contents:
- 1 Data Set Overview
- 2 Data Characteristics
- 3 Applications and Derivation
- 4 Quality Assessment
- 5 Acquisition Materials and Methods
- 6 Data Access
- 7 References
1. Data Set Overview:
Project: LBA (Large-Scale Biosphere-Atmosphere Experiment in the Amazon)
Activity: LBA-ECO
LBA Science Component: Land Surface Hydrology
Team ID: CD-06 (Richey / Victoria)
The investigators were Richey, Jeffrey E.; Victoria, Reynaldo Luiz; Aalto, RolfErhart; Abdo, Mara Silvia Aguiar; Alin, SimoneRebecca; Aufdenkampe, Anthony K.; Ballester, Maria Victoria Ramos; Bernardes, Marcelo Correa; Bolson, Marcos Alexandre; Bonelle, Nilton; Brito, David Silva; Cogo, Michelle Cristine; Cunha, HillandiaBrandao; Silva, Luis VilmarSouza da; Deus, Fabiano Alves de; Devol, Allan H.; Ellis, ErinElizabeth; Fernandes, Erick C.M.; Ferro, JadersonCoradi; Filho, Walter Jorge do Nascimento; Frickmann, Fernando Cruz; Guandique, Manuel Enrique Gamero; Gomes, Beatriz M.; Neto, Sergio CandidoGouveia; Hanada, Laisde Carvalho; Higuchi, Niro; Holtgrieve, Gordon William; Krusche, Alex V.; Leite, NeiKavaguichi; Logsdon, Miles Grant; Macedo, Gelsonde; Marcondes, Renata; McGeoch, Lauren; Moreira, Marcelo Zacharias; Neu, Vania; Ometto, Jean Pierre H.B.; Pimentel, Tania Pena; Filho, Nicolau Priante; Rasera, Maria de FatimaFernandesLamy; Remington, SonyaMarie; Rodda, Sarah; Salimon, CleberIbraim; Santiago, AlailsonVenceslau; Toledo, AndreMarcondesAndrade; Tumang, Cristiane Azevedoand Victoria, Daniel de Castro. You may contact Ballester, Maria Victoria Ramos (vicky@cena.usp.br).
LBA Data Set Inventory ID: CD06_LULC_Map_JiParana
This data set provides a land use/land cover map at 30 m resolution of the Ji-Parana River Basin in the state of Rondonia, Brazil produced from the digital classification of eight Landsat 7-ETM+ scenes from 1999 acquired from the Tropical Rain Forest Information Center (TRFIC) at Michigan State University. Nine land cover classes covering the Ji-Parana Basin were identified.
2. Data Characteristics:
The image file is a land use/cover map at 30 m resolution for 1999 for the Ji-Parana River
Basin, located in the state of Rondonia, Western Amazonia,
Brazil. One file (lulc_99.tif) is provided in GeoTiff format in the compressed zip file, lulc_99.zip.
The image includes the following 9 land use classes:
| Value | Description |
|---|---|
| 0 | No data |
| 1 | Pasture |
| 2 | Forest |
| 3 | Water |
| 4 | Urban |
| 5 | Savanna |
| 6 | Annual crops |
| 7 | Regrowth/riparian |
| 8 | Bare/burned soils |
| 9 | Clouds/cloud shadows |
Site boundaries: (All latitude and longitude given in decimal degrees)
| Site (Region) | Westernmost Longitude | Easternmost Longitude | Northernmost Latitude | Southernmost Latitude | Geodetic Datum |
|---|---|---|---|---|---|
| Rondonia - Rio Ji-Parana (Rondonia) | -63.41528 | -60.015 | -8.0333 | -12.92694 | World Geodetic System, 1984 (WGS-84) |
Time period:
- The data set covers the period 1999/07/30 to 1999/10/16
- Temporal Resolution: collection period was not continuous
Platform/Sensor/Parameters measured include:
- LANDSAT-7 (LAND REMOTE-SENSING SATELLITE-7) / ETM+ (ENHANCED THEMATIC MAPPER PLUS) / LAND COVER
3. Data Application and Derivation:
Detecting human impacts in riverine systems is challenging because of the diverse biological, chemical, hydrological and geophysical components that must be assessed. The development land use/cover properties and river network characteristics offer the opportunity to establish statistically which landscape characteristics are the most useful in understanding how river biogeochemical signals are generated and altered by human intervention.
4. Quality Assessment:
Geodetic errors of the images are approximately 30 meters.
Fifteen 1 meter resolution videography mosaics of selected areas were produced and provided by the Brazilian National Institute for Space Research (INPE). This data set was originally acquired as part of the four Validation Over flights for Amazon Mosaics (VOAM) aerial video surveys fulfilled by Hess et al. (2002).
Accuracy assessment also included 147 control points collected in the field and brought into the ERDAS-IMAGINE accuracy assessment module. The classification (class values) and ground truth points (reference points) were compared and summarized to compute a matrix and an accuracy assessment report. Overall classification accuracy was 89.12%, with an overall Kappa Statistic of 0.8667.
5. Data Acquisition Materials and Methods:
Site Description
In the state of Rondonia, Brazil, (Western Amazonia), the confluence of the Comemoracao and Pimenta Bueno Rivers results in the Ji-Parana River, which also receives water from the Rolim de Moura, Urupa, Jaru, Machadinho and Preto tributaries. The Ji-Parana River Basin drains an area of 75,000 km2, and is characterized by extensive development in the upper part, and slight alteration in the lower 400 km. From headwaters to its middle sectors, the river is highly impacted, with a predominance of pastures and agriculture. The lower reach, below the intersection with Jaru and Machadinho Rivers, reverts to relatively pristine natural forest surroundings (Ballester et al., 2002).
Image Processing and Map Production
We divided the Ji-Paran Basin into 14 drainage units according to the river network morphology and degree of land-use impact, which was determined by using the percentage of pasture coverage in each sector, classified as: low=0-15%; medium=15-30%; high=30-50%; or very high=50-75%:
| Sector code | River name | Order | Level of land-use impact |
|---|---|---|---|
| COM-1 | Comemoracao | 3rd | low |
| COM-2 | Comemoracao | 5th | medium |
| PB-1 | Pimenta Bueno | 3rd | low |
| PB-2 | Pimenta Bueno | 6th | medium |
| JIP-1 | Ji-Parana | 6th | high |
| ROLIM | Rolim de Moura | 5th | very high |
| URUPA | Urupa | 5th | very high |
| JIP-2 | Ji-Parana | 6th | very high |
| JIP-3 | Ji-Parana | 6th | high |
| JARU | Jaru | 6th | high |
| MACH | Machadinho | 5th | low |
| JIP-4 | Ji-Parana | 7th | low |
| JIP-5 | Ji-Parana | 7th | low |
| PRETO | Preto | 6th | low |
Using ERDAS-IMAGINE, land use/land cover maps were produced from a digital classification of eight Landsat 7-ETM+ scenes from 1999 on September 14th, and 3 scenes each from August 6th, August 8th, August 16th, October 16th, and July 30th. The images were acquired from the Tropical Rain Forest Information Center (TRFIC) at Michigan State University as 1G products, radiometrically and geometrically corrected images. Geodetic errors of these products are approximately 30 meters and this precision was achieved employing ground control points (http://www.bsrsi.msu.edu/trfic/data_portal/Landsat7doc).
Visual inspection was used to determine geo-registration consistency between neighboring scenes. Haze reduction was also performed based on Tasseled Cap transformation, which resulted in a component, correlated haze, that was then removed, and the image was transformed back into RGB space (see the ERDAS Field Guide for information regarding the transformation back into RGB). We also used a histogram match before creating a final mosaic. Color composites were created for each scene from bands 1 to 5 and 7 and visually inspected. The final classification included 9 classes: 1. forest; 2. water; 3. pasture; 4. riparian / regrowth; 5. savanna; 6. annual crops; 7. urban; 8. bare/burned soils and 9. clouds/cloud shadows. These classes were selected because, as in previous land use/land cover classifications using Landsat TM data (Kimes et al., 1998; Roberts et al., 2002), we were not able to accurately distinguish other land use/land cover classes, such as crop types, perennial crops, and secondary growth forest ages. The following table shows the percentage of each drainage unit that is covered by of each land use/land cover type (Ballester et al., 2002).
| Sector_code | Pasture | Forest | Water | Urban | Savanna | Annual_crops | Regrowth | Bare_soils | Clouds |
|---|---|---|---|---|---|---|---|---|---|
| COM-1 | 12.6 | 47.37 | 0.03 | 1.86 | 0.02 | 32.41 | 0.32 | 5.38 | 0 |
| PB-1 | 8.4 | 90 | 0 | 0.04 | 0 | 0.13 | 1.15 | 0.27 | 0 |
| COM-2 | 28.8 | 66.72 | 0.26 | 0.64 | 0.39 | 0.41 | 2.47 | 0.3 | 0 |
| PB-1 | 32.63 | 58.93 | 0.21 | 0.3 | 0.45 | 0.02 | 2.85 | 0.1 | 4.51 |
| JIP-1 | 65.84 | 26.17 | 0.05 | 0.67 | 0.47 | 0 | 6.5 | 0.29 | 0 |
| ROLIM | 68.95 | 27.45 | 0.23 | 1.45 | 0.97 | 0.02 | 0.57 | 0.37 | 0 |
| URUPA | 42.6 | 49.88 | 0.09 | 0.29 | 0.33 | 0.01 | 6.27 | 0.52 | 0 |
| JIP-2 | 55.7 | 36.8 | 0.32 | 0.82 | 0.94 | 0.05 | 4.43 | 0.94 | 0 |
| JIP-3 | 52.84 | 36.19 | 0.1 | 0.53 | 0.22 | 0.01 | 9.43 | 0.68 | 0 |
| JARU | 39.93 | 53.36 | 0.5 | 1.09 | 0.29 | 0.1 | 3.8 | 0.94 | 0 |
| JIP-4 | 7.9 | 86.41 | 0.63 | 0.12 | 2.1 | 0.02 | 2.52 | 0.31 | 0 |
| JIP-5 | 0.56 | 89.37 | 1.96 | 0.09 | 1.8 | 0 | 2.83 | 0.03 | 3.35 |
| PRETO | 3.49 | 78.26 | 1.25 | 0.14 | 0.01 | 0.01 | 6.63 | 0.04 | 10.18 |
| Entire_Basin | 29.6 | 61.5 | 0.38 | 0.18 | 1.39 | 0.13 | 3.64 | 0.57 | 2.57 |
The classification contained < 1% of pixels that could not be correctly classified with the training sites. Shadow pixels (mainly along the edges of forest and large rivers) were misclassified as either water or burned soils; these pixels are, for the most part, isolated or in groups of 2 or 3. In order to correct this problem the following five steps were taken: 1) re-code the classified image into a binary mask containing only water and burned soil pixels (value of 1); 2) in this mask, group all connected pixels into separate entities; 3) filter out any groups smaller than 4 pixels in size, leaving a layer of all of the water and burned soil pixels which were not to be altered; 4) obtain a shadow mask by recoding this layer so that all of these pixels had a value of 1; 5) overlay this mask on the classified image and, using a neighborhood analysis operating in a 5x5 window, change the shadow pixels to the value of their surroundings.
6. Data Access:
This data is available through the Oak Ridge National Laboratory (ORNL) Distributed Active Archive Center (DAAC).
Data Archive Center:
Contact for Data Center Access Information:
E-mail: uso@daac.ornl.gov
Telephone: +1 (865) 241-3952
7. References:
Ballester, M.V.R., D.D. Victoria, A.V. Krusche, R. Coburn, R.L. Victoria, J.E. Richey, M.G. Logsdon, E. Mayorga, and E. Matricardi. 2003. A remote sensing/GIS-based physical template to understand the biogeochemistry of the Ji-Parana river basin (Western Amazonia). Remote Sensing of Environment 87(4):429-445.
ERDAS-IMAGINE (1999). User’s manual, 459 pp.
Guptill, S. C., & Morrison, J. L. (1995).Elements of spatial data quality.UK: Elsevier.
Kimes, D.S.L., Nelson, R.F., Skole, D.L., & Sala, W.A. (1998).Accuracies in mapping secondary tropical forest age from sequential satellite imagery. Remote Sensing of the Environment, 65, 112-120.
Richey, J.E., J.M. Melack, A.K. Aufdenkampe, V.M. Ballester, and L.L. Hess (2002). Outgassing from Amazonian rivers and wetlands as a large tropical source of atmospheric CO2.Nature 416(6881):617-620.