Get Data
Revision Date: March 11, 2015
Summary
This data set provides normalized difference vegetation index (NDVI) data for the arctic growing season derived primarily with data from Advanced Very High Resolution Radiometer (AVHRR) sensors onboard several NOAA satellites over the years 1982 through 2012. The NDVI data, which show vegetation activity, were averaged annually for the arctic growing season (GS; June, July and August). The products include the annual GS-NDVI values and the results of a cumulative GS-NDVI time series trends analysis. The data are circumpolar in coverage at 8-km resolution and limited to greater than 20 degrees N.
These normalized difference vegetation index (NDVI) trends were calculated using the third generation data set from the Global Inventory Modeling and Mapping Studies (GIMMS 3g). GIMMS 3g improves on its predecessor (GIMMS g) in three important ways. First, GIMMS 3g integrates data from NOAA-17 and 18 satellites to lengthen its record. Second, it addresses the spatial discontinuity north of 72 degrees N, by using SeaWiFS, in addition to SPOT VGT, to calibrate between the second and third versions of the AVHRR sensor (AVHRR/2 and AVHRR/3). Finally, the GIMMS 3g algorithm incorporates improved snowmelt detection and is calibrated based on data from the shorter, arctic growing season (May-September) rather than the entire year (January-December).
The annual GS-NDVI data are provided in a single NetCDF v4 file. The GS-NDVI trends, significance of these trends, and a land cover map (GLC2000) are provided as three GeoTIFF files.
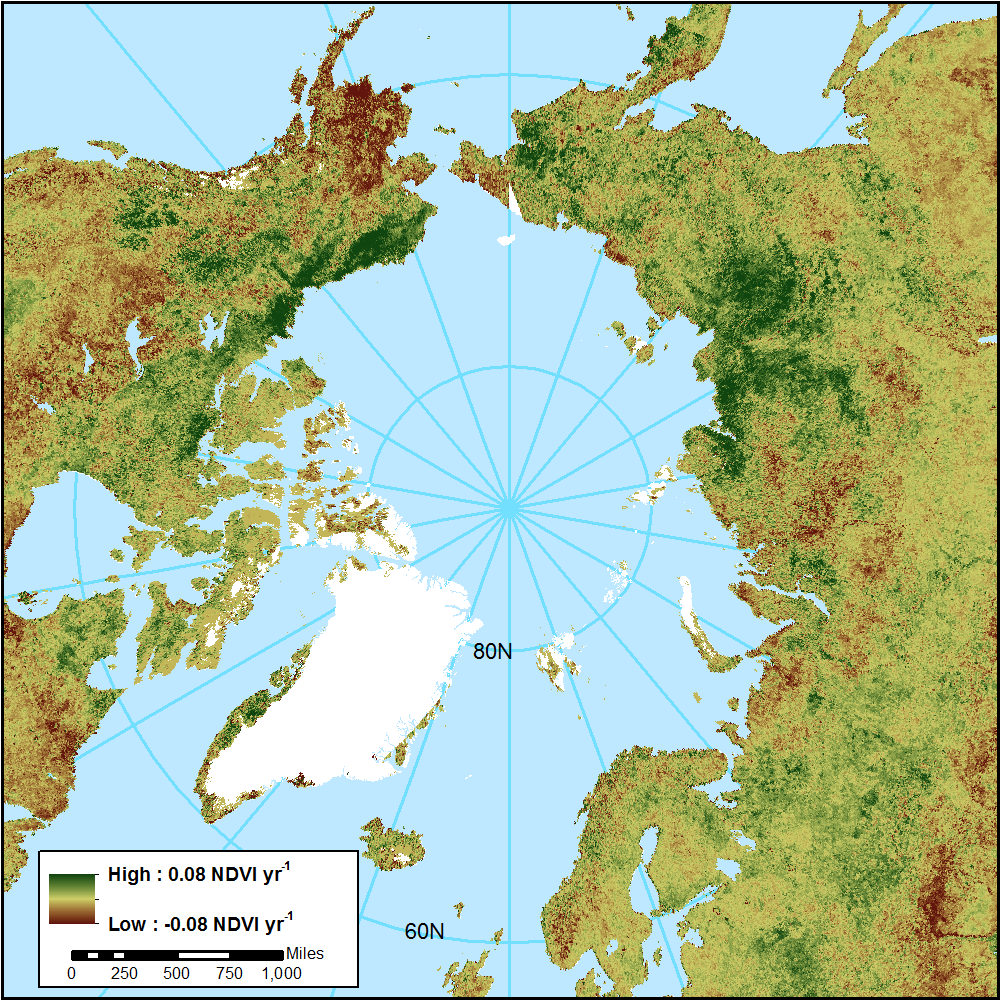
Figure 1: NDVI Arctic Growing Season Trends from GIMMS 3g, 1982-2012.
ACKNOWLEDGEMENTS
We acknowledge support from the NASA Carbon Cycle and Ecosystems program grants NNX08AG13G and NNX09AI24G to S.J. Goetz.
Data and Documentation Access:
Get Data: http://daac.ornl.gov/cgi-bin/dsviewer.pl?ds_id=1275
Data Citation:
Cite this data set as follows:
Guay, K.C., P.S.A. Beck, and S.J. Goetz. 2015. Long-Term Arctic Growing Season NDVI Trends from GIMMS 3g, 1982-2012 . Data set. Available on-line [http://daac.ornl.gov] from Oak Ridge National Laboratory Distributed Active Archive Center, Oak Ridge, Tennessee, USA. http://dx.doi.org/10.3334/ORNLDAAC/1275
Table of Contents:
- 1 Data Set Overview
- 2 Data Characteristics
- 3 Applications and Derivation
- 4 Quality Assessment
- 5 Acquisition Materials and Methods
- 6 Data Access
- 7 References
1. Data Set Overview:
This data set provides normalized difference vegetation index (NDVI) data for the arctic growing season derived primarily with data from the Advanced Very High Resolution Radiometer (AVHRR) aboard several NOAA satellites over the years 1982 through 2012. The NDVI data were averaged annually for the arctic growing season (GS; June, July and August). The products include the annual GS-NDVI values and the results of a cumulative GS-NDVI time series trends analysis. The data are circumpolar in coverage at 8-km resolution and limited to greater than 20 degrees N.
This third generation Global Inventory Modeling and Mapping Studies (GIMMS 3g) product is a ca. 8-km resolution, 15-day maximum value composite (MVC), bimonthly, global NDVI product generated from AVHRR data (NOAA-7, 9, 11, 14, 16-19). GIMMS 3g integrates data from NOAA-17 and -18, to improve the length and quality of the GIMMS-NDVI record and uses SeaWiFS (along with SPOT VGT) data to combine the AVHRR/2 and AVHRR/3 data sets to address the discontinuity north of 72 degrees N, present in GIMMSg (Pinzon et al., 2007; Pinzon and Tucker 2014). The GIMMS 3g algorithm also has improved snow-melt detection and is calibrated based on data from the shorter, arctic growing season (May–September), rather than the entire year (January–December).
GS-NDVI time series trends (brownness-greenness) were calculated using the Theil-Sen method (Theil, 1992). Areas defined as cropland, permanent snow and ice or other unnatural vegetation types in the Global Land Cover 2000 map (GLC2000; Table 1) were masked out. The GLC2000 map has been resampled (using the nearest neighbor method) to match the GIMMS 3G 8-km grid and is included in this data set (Guay et al. 2014).
2. Data Characteristics:
Spatial Coverage
Northern hemisphere north of 20 degrees N.
Spatial Resolution
8 km
Site boundaries: (All latitude and longitude given in decimal degrees)
| Westernmost Longitude | Easternmost Longitude | Northernmost Latitude | Southernmost Latitude |
|---|---|---|---|
| -180 | 180 | 90 | 20 |
Temporal Coverage
AVHRR source data from 1982-06-01 to 2012-08-31.
Temporal Resolution
Annual growing season average (June, July, August) and 31-year compiled trend results
Data File Information
The annual GS-NDVI data are proved in a single NetCDF v4 file. The GS-NDVI trends, the significance of trends, and the land cover map (GLC2000) are provided in GeoTIFF format.
GS-NDVI Trends
gimms3g_gs_ndvi_trend_8km_1982_2012_20deg_trend.tif
- GIMMS 3g GS-NDVI trends using Theil-Sen method (Theil, 1992 in Guay et al., 2014)
gimms3g_gs_ndvi_trend_8km_1982_2012_20deg_significance.tif
- Significance of trend using Mann-Kendall test (Mann, 1945) - Guay et al. (2014) uses a significance threshold of p<0.005
gimms3g_gs_ndvi_trend_8km_1982_2012_20deg_landcover.tif
- Land cover map (GLC2000) with 23 classes. Guay et al. (2014) masked out land cover classes greater than or equal to 16.
GeoTIFF Spatial Data Properties
|
Spatial Representation Type: Raster Compression Type: LZW Number of Bands: 1 Raster Format: GeoTIFF No Data Value: -1.79769313486232e+308 Scale Factor: 1 Number Columns: 4320 Column Resolution: 8 km Number Rows: 840 Row Resolution: 8 km Extent in the items coordinate system North: 90 South: 20 West: -180 East: 180 Spatial Reference Properties Type: Geographic Geographic Coordinate Reference: WGS 1984 Open Geospatial Consortium (OGC) Well Known Text (WKT) GEOGCS["WGS 84", DATUM["WGS_1984", SPHEROID["WGS 84",6378137,298.257223563, AUTHORITY["EPSG","7030"]], AUTHORITY["EPSG","6326"]], PRIMEM["Greenwich",0], UNIT["degree",0.0174532925199433], AUTHORITY["EPSG","4326"]] Origin = (-180.000000000000000,90.000000000000000) Pixel Size = (0.083333333333333,-0.083333333333333) |
Land Cover Classes
Global Land Cover 2000 Map (GLC2000) was resampled to match the GIMMS 3g grid. The following classes were masked in Guay et al. (2014).
| VALUE | CLASS NAME | MASKED |
|---|---|---|
| 1 | Tree Cover, broadleaved, evergreen | NO |
| 2 | Tree Cover, broadleaved, deciduous, closed | NO |
| 3 | Tree Cover, broadleaved, deciduous, open | NO |
| 4 | Tree Cover, needle-leaved, evergreen | NO |
| 5 | Tree Cover, needle-leaved, deciduous | NO |
| 6 | Tree Cover, mixed leaf type | NO |
| 7 | Tree Cover, regularly flooded, fresh water | NO |
| 8 | Tree Cover, regularly flooded, saline water | NO |
| 9 | Mosaic: Tree Cover / Other natural vegetation | NO |
| 10 | Tree Cover, burnt | NO |
| 11 | Shrub Cover, closed-open, evergreen | NO |
| 12 | Shrub Cover, closed-open, deciduous | NO |
| 13 | Herbaceous Cover, closed-open | NO |
| 14 | Sparse herbaceous or sparse shrub cover | NO |
| 15 | Regularly flooded shrub and/or herbaceous cover | NO |
| 16 | Cultivated and managed areas | YES |
| 17 | Mosaic: Cropland / Tree Cover / Other natural vegetation | YES |
| 18 | Mosaic: Cropland / Shrub and/or grass cover | YES |
| 19 | Bare Areas | YES |
| 20 | Water Bodies | YES |
| 21 | Snow and Ice | YES |
| 22 | Artificial surfaces and associated areas | YES |
| 23 | No data | YES |
Annual GS-NDVI data in NetCDF v4 file
gimms3g_ndvi_1982-2012.nc4
- The data file covers the years of 1982 through 2012 (31 bands) but only the average NDVI of growing season months June, July, and August of each year. An additional time boundary dimension (nv) is included in the data set to account for the seasonal nature of the data.
NetCDF v4 Header -- CF compliant
|
Parameter, Parameter Abbreviation, Unit, and Description Parameter: GIMMS 3G NDVI in growing season (June, July, and August) Parameter Abbreviation: NDVI Unit: GS-NDVI Description: Mean Normalized Difference Vegetation Index in growing season (June, July, and August) Spatial Data Properties Spatial Representation Type: Raster Pixel Depth: 64 bit Pixel Type: double precision Number of Bands: 31 Band Information: time Raster Format: netCDF Source Type: Generic No Data Value: -9999 Scale Factor: none Number Columns: 4320 Column Resolution: 8 km Number Rows: 840 Row Resolution: 8 km Extent in the items coordinate system North: 90 South: 20 West: -180 East: 180 Spatial Reference Properties Type: Geographic Geographic Coordinate Reference: WGS 1984 Open Geospatial Consortium (OGC) Well Known Text (WKT) GEOGCS["WGS 84", DATUM["WGS_1984", SPHEROID["WGS 84",6378137,298.257223563, AUTHORITY["EPSG","7030"]], AUTHORITY["EPSG","6326"]], PRIMEM["Greenwich",0], UNIT["degree",0.0174532925199433], AUTHORITY["EPSG","4326"]] Origin = (-180.000000000000000,90.000000000000000) Pixel Size = (0.083333333333333,-0.083333333333333) |
Data Archive Center Processing:
The single netCDF file was created by combining 31 individual annual GS-NDVI GeoTIFFs using Geospatial Data Abstraction Library (GDAL) and netCDF Operator (NCO) software. The NCO software was then utilized to edit the netCDF header to bring it into Climate and Forecast (CF) compliance.
3. Data Application and Derivation:
The AVHRR-based GIMMS-NDVI version G (GIMMS g) series, and its recent successor version 3g (GIMMS 3g), as well as the shorter NDVI records generated from the more modern sensors, SeaWiFS, SPOT-VGT, and MODIS were compared. The data sets from the latter two sensors were provided in a form that reduces the effects of surface reflectance associated with solar and view angles (Guay et al., 2014).
4. Quality Assessment:
See Pinzon and Tucker (2014) for discussion of specific comparisons between GIMMS 3g and independently measured appropriate climate phenomena needed to improve our understanding of uncertainty the AVHRR GIMMS 3g product.
5. Data Acquisition Materials and Methods
This data set provides normalized difference vegetation index (NDVI) data for the arctic growing season derived primarily with data from Advanced Very High Resolution Radiometer (AVHRR) sensors aboard several NOAA satellites over the years 1982 through 2012. The NDVI data were averaged annually for the arctic growing season (GS; June, July and August).
The data are circumpolar in coverage at 8-km resolution and limited to greater than 20 degrees N. Like its predecessor, the third generation Global Inventory Modeling and Mapping Studies (GIMMS 3g) product is a ca. 8-km resolution, 15-day maximum value composite (MVC), bimonthly, global NDVI product generated from AVHRR data (NOAA-7, 9, 11, 14, 16-19). GIMMS 3g integrates data from NOAA-17 and -18, to improve the length and quality of the GIMMS-NDVI record and uses SeaWiFS (along with SPOT VGT) data to combine the AVHRR/2 and AVHRR/3 data sets to address the discontinuity north of 72 degrees N, present in GIMMS g (Pinzon et al., 2007; Pinzon and Tucker 2014). The GIMMS 3g algorithm also has improved snowmelt detection and is calibrated based on data from the shorter, arctic growing season (May–September), rather than the entire year (January–December).
As described in Guay et al. (2014), the temporal trends in the GS-NDVI annual time series were estimated using the Theil-Sen approach (Theil, 1992). Trends were not estimated for pixels that were missing data anywhere in the time series. The Mann-Kendall test was used to assess trends for statistical significance (Mann, 1945), regarding pixels as significant when P < 0.05.
Compared to a simple linear regression, the Theil-Sen slope estimator is more robust to outliers, as it estimates the slope of a time series as the median of all slopes between pairs of observations in the time series. We explored using this population of slopes to empirically determine 95% confidence intervals around the slope estimate as an alternative assessment of statistical significance. However, the Mann-Kendall test was far more conservative when applied to the common record. Trend analyses were performed using the tools in the zyp package (Bronaugh & Werner, 2012) in R (R Core Team, 2012).
The GIMMS 3g data product used as a source for this data set and those described in Guay et al. (2014) in Pinzon and Tucker (2014), are available from the NASA Earth Exchange (NEX), a platform for scientific collaboration, knowledge sharing and research for the earth science community. Access link: https://nex.nasa.gov/nex/projects/1349/
6. Data Access:
These data are available through the Oak Ridge National Laboratory (ORNL) Distributed Active Archive Center (DAAC).
Data Archive Center:
Contact for Data Center Access Information:
E-mail: uso@daac.ornl.gov
Telephone: +1 (865) 241-3952
7. References:
Bronaugh D, Werner A (2012) zyp: Zhang + Yue-Pilon Trends Package. R Foundation for Statistical Computing, Vienna.
Guay KC, Beck PSA, Berner LT, Goetz SJ, Baccini A, Buermann W (2014) Vegetation productivity patterns at high northern latitudes: a multi-sensor satellite data assessment. Global Change Biology, 20, 3147-3158.
Mann HB (1945) Nonparametric tests against trend. Econometrica, 13, 245-259.
Pinzon JE, Brown ME, Tucker CJ (2007) Global Inventory Modeling and Mapping Studies (GIMMS) Satellite Drift Corrected and NOAA-16 incorporated Normalized Difference Vegetation Index (NDVI), Monthly 1981-2006.
Pinzon JE, Tucker CJ (2014) A Non-Stationary 1981-2012 AVHRR NDVI3g Time Series. Remote Sensing, 6, 6929-6960.
R Core Team (2012) R: A Language and Environment for Statistical Computing. R Foundation for Statistical Computing, Vienna, Austria.
The Global Land Cover Map for the Year 2000, 2003. GLC2000 database, European Commission Joint Research Centre. http://www-gem.jrc.it/glc2000.
Theil H (1992) A rank-invariant method of linear and polynomial regression analysis. In: Econometric Theory and Methodology, Vol. 23 (eds Raj B, Koerts J), pp. 345–381. Springer, Houten, the Netherlands.