Get Data
Summary:
This data set contains two data files (.csv format). One file contains site characteristics, stand descriptors, and above-ground biomass and ANPP data for seven old-growth temperate forest stands and one young cove forest stand in the Great Smoky Mountains of Tennessee. The old-growth stands (> 200 years old) span several watersheds on the north slope of the mountains at elevations ranging from 720 to 1,140 m. The younger stand (48-63 years old, elevation 910 m) developed after agricultural abandonment.
The second file contains monthly mean climate data averaged over four years (1947-1950) from four climate stations located along an elevational gradient (445-1,920 m) in Great Smoky Mountains National Park.
DBH measurements were made at the beginning of the study and biomass increment was measured from a subset of trees. ANPP was estimated using regional species-specific allometric relationships for tree mass. Biomass, volume, and annual input of coarse woody detritus are also reported.
Live biomass in the old-growth stands (32,600-47,100 g/m2) is among the highest reported for temperate forests of eastern North America while ANPP is moderate (630-1,010 g/m2/yr). ANPP in the younger stand was higher (1,180-1,310 g/m2/yr). In comparison with forests worldwide, inputs of coarse woody debris is moderate.
Revision Notes: Previously reported field collection dates have been corrected (from 1978 to 1968) in the NPP file and the data set title was also corrected to reflect the date change. Biomass and ANPP values were converted from Mg/ha and Mg/ha/yr to g/m2 and g/m2/yr, respectively, consistent with units in other files in the NPP collection. Please see the Data Set Revisions section of this document for detailed information.
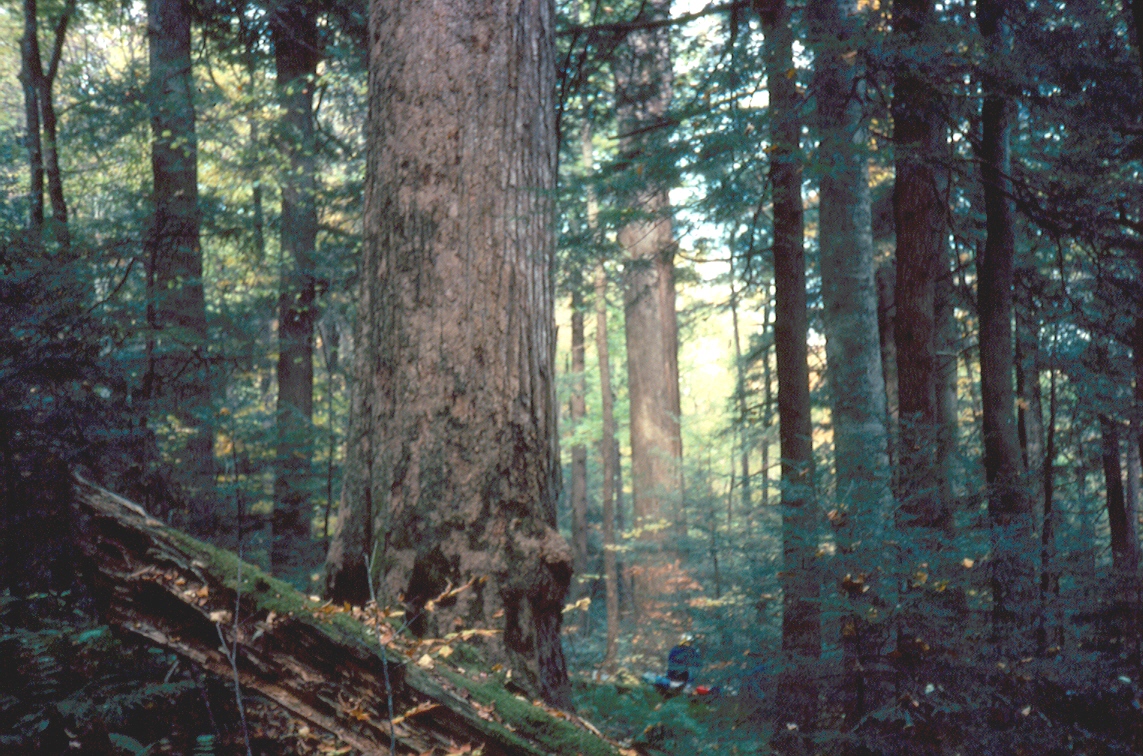
Figure 1. Typical old stands of mixed deciduous and mixed deciduous -Tsuga in the Great Smoky Mountains, Tennessee, USA.
Additional Documentation:
The Net Primary Productivity (NPP) data collection contains field measurements of biomass, estimated NPP, and climate data for terrestrial grassland, tropical forest, temperate forest, boreal forest, and tundra sites worldwide. Data were compiled from the published literature for intensively studied and well-documented individual field sites and from a number of previously compiled multi-site, multi-biome data sets of georeferenced NPP estimates. The principal compilation effort (Olson et al., 2001) was sponsored by the NASA Terrestrial Ecology Program. For more information, please visit the NPP web site at http://daac.ornl.gov/NPP/npp_home.html.
Data Citation:
Cite this data set as follows:
Busing, R.T. 2013. NPP Temperate Forest: Great Smoky Mountains, Tennessee, USA, 1968-1992, R1. Data set. Available on-line [http://daac.ornl.gov] from Oak Ridge National Laboratory Distributed Active Archive Center, Oak Ridge, Tennessee, USA. doi:10.3334/ORNLDAAC/804
This data set was originally published as:
Busing, R.T. 2005. NPP Temperate Forest: Great Smoky Mountains,
Tennessee, U.S.A., 1978-1992. Data set. Available
on-line [http://daac.ornl.gov] from Oak Ridge National Laboratory
Distributed Active Archive Center, Oak Ridge, Tennessee, U.S.A.
Table of Contents:
- 1 Data Set Overview
- 2 Data Description
- 3 Applications and Derivation
- 4 Quality Assessment
- 5 Acquisition Materials and Methods
- 6 Data Access
- 7 References
- 8 Data Set Revisions
1. Data Set Overview:
Project: Net Primary Production (NPP)
This data set contains two data files in comma-separated-format. One file contains biomass, productivity, and other stand data for a temperate forest, and the other file contains climate data for the Great Smoky Mountains of Tennessee.
Productivity of old, unlogged stands of southern Appalachian forest was studied and compared to a younger, secondary stand. Tree growth increments and allometric relationships were the basis for estimation of above-ground net primary production (ANPP). Measurements of tree diameter at 1.37 m above ground were made at the beginning of the study. Radial increment cores were taken from a subset of trees. ANPP was estimated using regional species-specific allometric relationships for tree mass. Estimation procedures were outlined by Busing et al. (1993). A set of monthly mean climate data averaged over four years (1947-1950) from four climate stations located along an elevational gradient in Great Smoky Mountains National Park is also included.
Sheltered from major disturbance and receiving abundant precipitation throughout the year (2,000 mm/yr), the Great Smoky Mountains valleys and ravines have well-developed mixed mesophytic "cove" forests which are noted for their plant species richness. Old forest stands of mixed deciduous (and mixed deciduous-Tsuga) were selected for this study because of their gentle terrain, accessibility, and history of study. Between 1988 and 1992, seven old-growth stands were sampled on plots of 0.6-1.0 ha each, for a total sampled area of 5.4 ha. Radial increments measured over the previous decade were used to provide estimates of tree diameter growth. A young secondary stand, dominated by the deciduous species Liriodendron tulipifera, provided comparative information. The young forest was studied in 1968 and again in 1983.
Biomass estimates for the predominantly deciduous old-growth stands ranged from 32,600 to 39,400 g/m2 on plots ≥ 0.4 ha. These values are consistently greater than the corresponding estimates of 25,400–27,700 g/m2 for the young stand (estimated for the two sampling periods). The old Tsuga-dominated stands had the highest biomass estimates of 41,000–47,100 g/m2 for 1.0-ha plots.
Annual ANPP estimates were highest (1,108–1,310 g/m2/yr) in the young stand (estimated for the two sampling periods). The stand had particularly high bolewood production. ANPP of the old-growth plots ≥ 0.4 ha ranged from 630 to 860 g/m2/year for the deciduous stands and 800–1,010 g/m2/year for the coniferous–deciduous stands.
Table 1. ANPP, BNPP, and TNPP values reported by various published data sources
| File Name or Description | Data Source(s) | Site (Stand ID) | ANPP | BNPP | TNPP |
|---|---|---|---|---|---|
| gC/m2/year | |||||
| GSM_NPP_r1.csv | Busing et al. (1993), Busing (1998; 2005)1,2 | Long Branch 1 | 314 | NA | NA |
| Long Branch 2 | 300 | NA | NA | ||
| Porters Creek | 409 | NA | NA | ||
| Roaring fork 1 | 380 | NA | NA | ||
| Roaring fork 2 | 428 | NA | NA | ||
| Roaring fork 3 | 480 | NA | NA | ||
| Dunn Creek | NA | NA | NA | ||
| Long Branch Young 48yr | 561 | NA | NA | ||
| Long Branch Young 63yr | 622 | NA | NA | ||
| GPPDI_ClassB_NPP_2363_R1.csv | Olson et al. (2012a) based on Busing et al. (1993)3,4 | Class B 679 (MI 1158) (Long Branch 1) | 310 | NA | NA |
| Class B 679 (MI 1157) (Long Branch 2) | 300 | NA | NA | ||
| Class B 679 (MI 1161) (Porters Creek) | 410 | NA | NA | ||
| Class B 679 (MI 1159) (Roaring Fork 1) | 380 | NA | NA | ||
| Class B 679 (MI 1162) (Roaring fork 2) | 430 | NA | NA | ||
| Class B 679 (MI 1163) (Roaring Fork 3) | 480 | NA | NA | ||
| Class B 679 (MI 1166) (Long Branch Young 63yr) | 620 | NA | NA | ||
| Class B 679 (MI 1160) (Elevation 870 m) | 380 | NA | NA | ||
| Class B 679 (MI 1164) (Elevation 945 m) | 560 | NA | NA | ||
| Class B 679 (MI 1165) (Elevation 720 m) | 560 | NA | NA | ||
| EMDI_ClassB_NPP_933_v2.csv | Olson et al. (2012b) based on Busing et al. (1993)5 | Class B 679 (average of 10 stands) | 443 | NA | NA |
Notes:
NA = Not available.
MI = Measurement identification number.
The differences in NPP values reported in this table are mainly due to differences in calculation methods, as explained in these notes. Please consult original references for details.
Please see the Data Set Revisions section of this document for detailed information.
1 For this table, NPP data from the original data source were converted from megagrams of dry weight per hectare per year to grams of carbon per meter square per year using a conversion factor of 0.475.
2 ANPP estimates are based on measurements of tree leaf + branch + trunk + bole production.
3 ANPP data for Dunn Creek and Long Branch Young 48yr not available in GPPDI (Olson et al., 2001b). Three additional stand measurements are included in GPPDI Class B 679 (i.e., MI 1160, 1164, and 1165). 4ANPP data for GPPDI Class B 679 (MI 1160, 1164, and 1165) not reported in GSM_NPP_r1.csv. 5EMDI Class B ANPP data are the average of the ten (10) GPPDI Class B 679 sites.
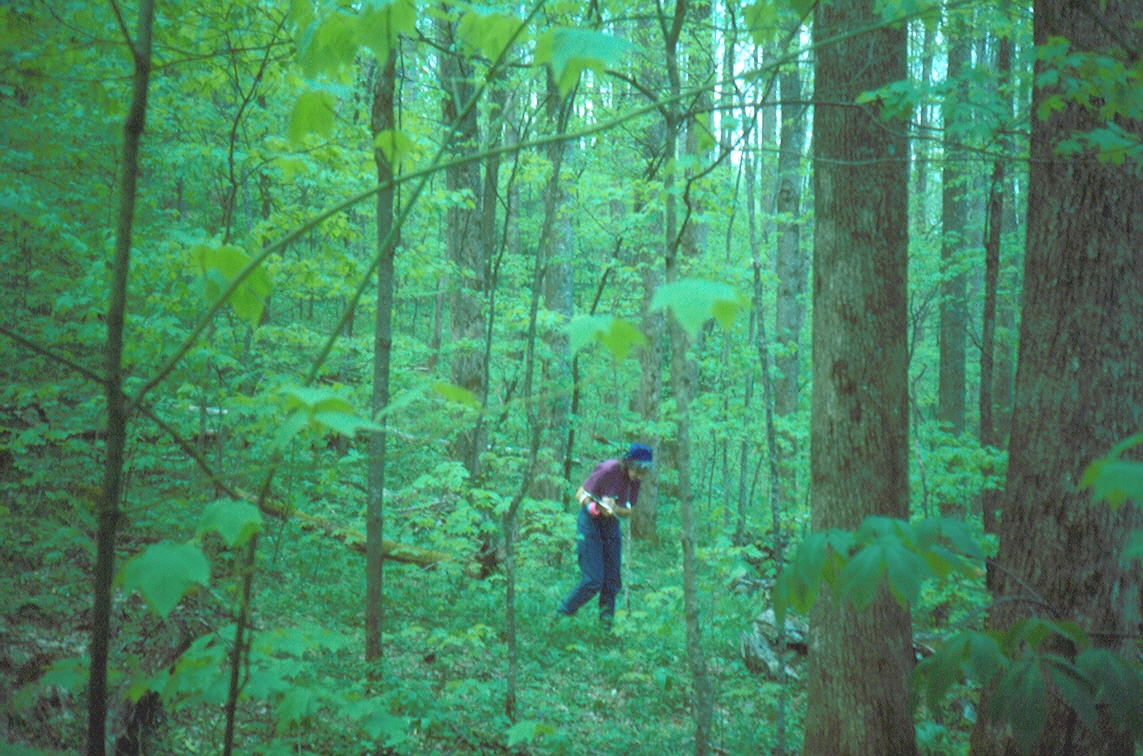
Figure 2. Typical young stands, dominated by the deciduous species Liriodendron tulipifera, in the Great Smoky Mountains, Tennessee, USA.
2. Data Description:
This data set contains two data files (.csv format). One file contains site characteristics, stand descriptors, and measured and calculated above-ground biomass and ANPP data for old-growth, and young successional cove forest stands. The elevations range from 720 to 1,140 m. The second file contains a set of monthly mean climate data averaged over four years (1947-1950) from four climate stations located along an elevational gradient (445-1,920 m). The study area was the Great Smoky Mountains National Park.
Spatial Coverage
Site: Great Smoky Mountains, Tennessee, USA.
Site Boundaries: (All latitude and longitude given in decimal degrees)
| Site (Region) | Westernmost Longitude | Easternmost Longitude | Northernmost Latitude | Southernmost Latitude | Elevation (m) |
|---|---|---|---|---|---|
| Great Smoky Mountains, Tennessee, USA | -83.462 | -83.281 | 35.736 | 35.676 | 720 - 1,140 |
Site Information
The northeastern Great Smoky Mountains harbor some of the best examples of old-growth temperate deciduous forest in eastern North America. Sheltered from major disturbance and receiving abundant precipitation throughout the year (2,000 mm/yr), mountain valleys and ravines have well-developed mixed mesophytic "cove" forests. Cove forests are noted for their plant species richness.
For this study, seven study sites were selected in an old-growth (> 200 years old) forest spanning several watersheds on the north slope of the Great Smoky Mountains. Accessibility, terrain, and a history of vegetation study were considerations in site selection. A younger cove forest stand was also selected for comparison and sampled when it was 48 and 63 years of age.
Table 2. Great Smoky Mountains study sites
| SITE | PLOT SIZE (ha) | ELEVATION (m) | DOMINANT SPECIES | LATITUDE | LONGITUDE |
|---|---|---|---|---|---|
| Long Branch 1 | 0.6 | 920 | Acer-Tsuga-Halesia | 35.687 N | 83.417 W |
| Long Branch 2 | 0.6 | 950 | Halesia-Acer-Tsuga-Aesculus | 35.686 N | 83.42 W |
| Porters Creek | 0.6 | 720 | Halesia-Acer-Aesculus | 35.681 N | 83.399 W |
| Roaring Fork 1 | 1.0 | 960 | Tsuga-Halesia-Fagus-Acer | 35.679 N | 83.464 W |
| Roaring Fork 2 | 1.0 | 990 | Tsuga-Halesia-Acer-Fagus | 35.681 N | 83.462 W |
| Roaring Fork 3 | 1.0 | 1,140 | Tsuga-Halesia-Aesculus | 35.676 N | 83.452 W |
| Dunn Creek | 0.6 | 970 | Tsuga-Acer-Halesia-Liriodendron | 35.736 N | 83.281 W |
| Long Branch Young 48yr | 0.4 | 910 | Liriodendron | 35.687 N | 83.417 W |
| Long Branch Young 63yr | 0.4 | 910 | Liriodendron | 35.687 N | 83.417 W |
The old-growth stands have no history of logging or catastrophic fire and are considered "topographic climax." Stand basal area (39-55 m2/ha) and biomass (32,600-39,400 g/m2) are high for temperate deciduous forests. Density ranges from 577 to 1,075 stems/ha. All stands have a mixture of deciduous canopy species. Characteristic tree species include Acer saccharum, Aesculus octandra, Betula lutea, Fagus grandifolia, Halesia carolina, Liriodendron tulipifera, Tilia heterophylla, and Tsuga canadensis. Only rarely does a single species comprise more than half of the stand by density, basal area or biomass. Shade-intolerant species are present at low levels (1-5 % of total stand density).
The younger stand (48-63 years) is a successional (secondary) forest initiated circa 1920 following agricultural abandonment. Liriodendron tulipifera is the dominant species in the the canopy. The understory is rich in tree species and only highly shade-intolerant species (e.g., Liriodendron and Robinia pseudoacacia) are excluded.
Climate data in this data set are available from four climate stations spanning the elevation gradient from 1,460 to 6,300 ft (445-1,920 m) in the Great Smoky Mountains from Gatlinburg to Clingmans Dome (Busing et al., 2005). Monthly mean values for cloud cover, temperature, humidity, precipitation, and soil moisture are included. Stephens (1969) is the source of all summarized mean monthly data. Values are the averages of four years (1947-1950) which experienced moderate to high precipitation.
Spatial Resolution
Ecological attributes of seven old-growth stands were studied using one 0.6-1.0 ha plot per stand. The young successional forest stand was a 0.4 ha plot. Dimensions are 40 x 100 m for the 0.4 ha plots, 50 x 120 m for the 0.6 ha plots, and 100 x 100 m for the l.0 ha plots.
Temporal Coverage
Biomass, forest structure, and ANPP measurements were made between 1968 and 1992. Climate data are averaged over four years, 1947-1950.
Temporal Resolution
Forest structure and above-ground biomass measurements were made once at each old-growth site and twice (15 years apart) at the young site. Ten-year radial growth increments along with species-specific DBH to mass equations were used to estimate ANPP in both old-growth and younger stands. ANPP estimates are based on plant dry matter accumulation, expressed as g/m2/yr(dry matter weight).
Climate data are expressed as monthly averages, January-December.
Data File Information
Table 3. Data files in this data set archive
| FILE NAME | TEMPORAL COVERAGE | FILE CONTENTS |
|---|---|---|
| GSM_NPP_r1.csv | 1968/01/01 - 1992/12/31 | Site characteristics, stand descriptors, and measured and calculated biomass and ANPP data for seven old-growth and one young forest stands in the Great Smoky Mountains |
| CLIMGSM1.csv | 1947/01/01-1950/12/31 | Monthly mean climate data for four climate stations in the Great Smoky Mountains |
NPP Data
ANPP estimates for the Great Smoky Mountains sites are provided in a single data file, in comma-separated-format. The variable values are delimited by commas. The first 18 lines are metadata; data records begin on line 19. The value -999.9 is used to denote missing values. Biomass and NPP units are in g/m2and g/m2/year (dry matter weight), respectively.
Table 4. Column headings in NPP file
| COLUMN HEADING | DEFINITION | UNITS |
|---|---|---|
| Parameter | Parameters measured (see definitions in Table 4) | Text |
| Units | Units of measure | Text |
| Site Name | Site where data were gathered | Text |
Table 5. Parameter definitions in NPP file
| PARAMETER | DEFINITION | UNITS |
|---|---|---|
| Date of initial field data collection | Year in which data were collected | year |
| Latitude | Plot latitude | decimal degree |
| Longitude | Plot longitude | decimal degree |
| Topographic position | Topographic setting (cove bottom, bench, lower slope, middle slope, or upper slope) | NA |
| Slope | Degree of inclination | degree |
| Aspect | Exposure | NA |
| Elevation | Elevation above mean sea level | m |
| Stand age | Approximate age of stand (number of years since initiation) | numeric |
| Total area | Plot size | ha |
| Density | Number of stems per ha based on all trees > 1.37 m tall | stems/ha |
| Basal area | Total stand basal area based on all trees > 1.37 m tall | m2/ha |
| Basal area of standing dead wood | Basal area of woody detritus classified as a snag (standing dead trees > 1.37 m tall) | m2/ha |
| Density of standing dead wood | Density of woody detritus classified as a snag (standing dead trees > 1.37 m tall) | stems/ha |
| Volume of standing coarse woody detritus | Volume of woody detritus classified as a snag (standing dead trees > 1.37 m tall) | m3/ha |
| Volume of fallen coarse woody detritus | Volume of woody detritus classified as a log (fallen dead trees and stumps < 1.37 m tall) | m3/ha |
| Mass of standing coarse woody detritus | Biomass of woody detritus classified as a snag (standing dead trees > 1.37 m tall) | g/m2 |
| Mass of fallen coarse woody detritus | Biomass of woody detritus classified as a log (fallen dead trees and stumps < 1.37 m tall) | g/m2 |
| Input of coarse woody detritus | Annual rate of coarse woody detritus input | g/m2/yr |
| Leaf biomass | Leaf biomass (estimated using species-specific DBH to mass equations for the Great Smoky Mountains and eastern Tennessee) | g/m2 |
| Branch biomass | Branch biomass based on species-specific DBH to mass equations | g/m2 |
| Bole biomass | Bole biomass based on species-specific DBH to mass equations | g/m2 |
| Tree biomass | Total above-ground biomass | g/m2 |
| Leaf ANPP (aboveground net prim. production) | Leaf production (estimated as the standing leaf mass for deciduous species and as a fraction of standing leaf mass for evergreen species) | g/m2/yr |
| Branch ANPP | Net branch production (calculated as the difference in stand mass values obtained from DBH, and DBH minus the 10-year diameter increment) | g/m2/yr |
| Bole ANPP | Net bole production (calculated as the difference in stand mass values obtained from DBH, and DBH minus the 10-year diameter increment) | g/m2/yr |
| Tree ANPP | Total above-ground net production | g/m2/yr |
| Data sources | References | Numeric (footnotes) |
Note: NA = Not applicable.
Sample NPP Data Record
| Parameter, Units, Long Branch 1, Long Branch 2 ... Date of initial field data collection, year, 1988, 1988, ... Latitude, decimal degree, 35.687, 35.686, ... Longitude, decimal degree, -83.417, -83.42, ... Topographic position, Not applicable, Bench, Cove bottom, ... Slope, degree, 11, 16, ... Aspect, Not applicable, N, N, ... Elevation (above mean sea level), m (meter), 920, 950, ... Stand age, year, >200, >200, ... Total area, ha (hectare), 0.6, 0.6, ... Density, stems/ha (stems per hectare), 577, 727, ... Basal area, m2/ha (square meter per hectare), 44.9, 38.8, ... |
Climate Data
Monthly mean climate summaries for four years (1947-1950) were taken from tables of numeric data in Stephens (1969). The data are stored in a single file, in comma-separated-format. Different types of data are presented in tabular format with separate tables for each type of climate information. The tables are presented in a series, from left to right, in the file. Each line in the database usually represents a monthly value for the given climate variable. Identification of variables or climate station sites typically occurs in the first row. Further information is provided to the left of each table. Most values are present, but a few values are missing. Measures are in English units unless noted otherwise. The major variables and abbreviations are described in Table 6.
Table 6. Column headings in climate data file
| COLUMN HEADING | DEFINITION | UNITS |
|---|---|---|
| Month | Month of the year | Single character |
| Clear | No clouds | Percent frequency |
| SCloudy | Scattered clouds | Percent frequency |
| PCloudy | Partly cloudy | Percent frequency |
| Cloudy | Clouds | Percent frequency |
| Overcast | Overcast sky | Percent frequency |
| Fog | Low fog | Percent frequency |
| MeanTLR | Mean temperature lapse rate | Deg. F per 1000 ft |
| MaxTLR | Maximum temperature lapse rate | Deg. F per 1000 ft |
| MinTLR | Minimum temperature lapse rate | Deg. F per 1000 ft |
| MeanT | Mean temperature | Deg. F |
| MeanMaxT | Mean maximum temperature | Deg. F |
| MeanMinT | Mean minimum temperature | Deg. F |
| Temp | Mean temperature | Deg. F |
| PET | Potential evapotransporation | Inches |
| Prec | Mean precipitation | Inches |
| P-PET | Prec minus PET | Inches |
| SM | Soil moisture deficit | Inches |
| MD | Moisture deficit | Inches |
| MS | Moisture surplus | Inches |
| SMB | Soil moisture balance | Inches |
Sample Climate Data Record
| TAB1, Month, Clear, SCloudy, PCloudy, ... Cloud, J, 14.5, 12.1, 8.4, ... cover (%), F, 23.2, 23.2, 5.4, ... 1460 ft, M, 23.4, 14.5, 3.1, ... , A, 30.8, 18.3, 4.2, ... , M, 40.3, 21.8, 3.2, ... |
3. Data Application and Derivation:
The accumulation of biomass, or NPP, is the net gain of carbon by photosynthesis that remains after plant respiration. While there are many fates for this carbon, this data set accounts for above-ground tree production.
Species composition, community structure, gap processes, and ecosystem properties of adjacent young and old cove forest stands in the Great Smoky Mountains were compared. Above-ground biomass and ANPP were determined for leaf, branch, and bole compartments of young stands (48-63 years) and old stands (>200 years). Total above-ground biomass estimates were consistently greater in the old deciduous stands (32,600-47,100 g/m2) than in the young deciduous stands (25,400-27,700 g/m2). Comparative analysis suggests that live biomass in the old-growth cove forests is among the highest reported for temperate forests of eastern North America. ANPP was moderate in these old stands (630-1,010 g/m2/yr) while ANPP in the successional young stands was higher (1,180-1,310 g/m2/yr).
The biomass dynamics data for the Great Smoky Mountains sites are provided for comparison with models and estimation of NPP. Climate data are provided for use in driving ecosystem/NPP models.
4. Quality Assessment:
NPP Study
Previous biomass estimates for primeval cove forests (50,000-61,000 g/m2; Whittaker 1966) in the Great Smoky mountains are higher than forest means recorded in this study at the seven old-growth Great Smoky Mountains study sites (32,600-47,100 g/m2; Busing et al., 1993). The estimates in the current study are based on larger plots which could account for the discrepancy in values.
Another potential source of discrepancy between the current estimates and those of Whittaker (1966) is the use of species specific allometric equations based on data from the Great Smoky Mountains. Whittaker (1966) used allometric equations published by other researchers for his estimates, and he states that "mean values for broadleaf deciduous trees were applied to the mixed cove forests." Thus, Whittaker's deciduous tree equations were not species specific.
Above-ground biomass and coarse woody necromass measurements in the Great Smoky Mountains old growth stands were compared to values from mature stands of various forests worldwide (Busing, 2005). The data for Great Smoky Mountains study sites tend to exceed estimates for other temperate deciduous forests in the United States and exceed estimates for tropical rainforests and boreal forests. As expected, the young cove forest had lower total above-ground biomass. By contrast, data from certain temperate coniferous forests yield higher biomass and necromass estimates and detritus to biomass ratios than found in this study.
In comparison with forests worldwide, the input rate of coarse woody debris in the Great Smoky Mountains study forest is moderate (Busing, 2005).
Climate Study
Comparison of the short-term climate data to the long-term record was made to examine how well the four-year sample represents the long-term climate, temperature and precipitation. Data from the Gatlinburg station [1,460 ft (445 m) elevation at park headquarters] were compared between the years in the sample and the years in the full record from 1928 to 2003 (retrieved from the Southeast Regional Climate Center, but not part of this data set). Annual values were compared first, then monthly values were compared. Similar comparisons at higher elevation stations were not made because of the relatively incomplete long-term records at those stations.
Comparison of the sample of four years selected by Stephens (1969) to the long-term record (1928 to 2003; >60 yr with fairly complete temperature and precipitation data) indicates that, on average, the years sampled are wetter and cooler than the long-term record. Mean annual values from the years sampled lie within one standard deviation of the long-term means, however.
Mean monthly values show more variation, with values from the four-year sample often deviating substantially from the long-term values. For example, means of monthly temperatures are more than one standard deviation less than the long-term means in August, September, and November. The mean of monthly precipitation is about one standard deviation greater than the long-term mean in January. On average, the short-term study had cooler late summer and fall temperatures, and wetter winters than the long-term record.
Sources of Error
Information not available.
5. Data Acquisition Materials and Methods:
Biomass and NPP Data
Above-ground biomass and production were estimated using species-specific DBH to mass equations for the Great Smoky Mountains and eastern Tennessee. These equations were based on logarithmically transformed linear regressions for a variety of tree species over a wide size range of trees. Predicted dry weights were adjusted for transformation bias with a correction factor calculated from the standard error of the estimate (Sprugel 1983). Equations for congeneric species were used if regressions were lacking for a species. An equation for a red oak species group was based on data from Quercus rubra, Quercus velutina, Quercus coccinea, and Quercus falcata trees. An equation for miscellaneous deciduous species was based on data from Halesia carolina, Sassafras albidum, Fraxinus americana, Prunus pensylvanica, Amelanchier arborea, Acer saccharum, Betula lenta, and Tilia heterophylla trees.
During initial sampling of each plot, live trees (>2 cm DBH, 1.37 m]) and coarse woody detritus items (> 10 cm diameter) were mapped. The species and DBH of each live tree were recorded. Pieces of woody detritus were classified as a snag (standing dead trees >1.37 m tall) or a log (fallen dead trees, and stumps < 1.37 m tall). Length, diameter, and shape (cylindric, parabolic, or conic) of each dead wood item were noted for volume estimation. Length measurements on items extending beyond the plot boundary were excluded.
In old-growth stands Long Branch 1 and Long Branch 2, individual 10-year radial growth rates were used for all trees >10 cm and average rates for each species were used for smaller individuals. Species-specific 10-year radial growth rate averages for each dominance class (dominant, codominant, subdominant, or suppressed) from a sample of trees were used for the remaining old-growth stands.
Tree species and DBH data were collected in 0.4-ha young-growth plots in 1968 and 1983. The young forest was initiated circa 1920 following agricultural abandonment, and was estimated to be 48 and 63 years old at the time the measurements were made. Ten-year radial growth increments were taken from a sample of understory and overstory trees at breast height. Production was estimated using average radial growth rates for (i) understory and (ii) overstory trees.
Net branch and bole production were calculated as the difference in stand mass values obtained from DBH, and DBH minus the 10-year diameter increment. Production was not corrected for ingrowth or for biomass losses from mortality and litter fall over the l0-year period. Leaf production was estimated as the standing leaf mass for deciduous species and as a fraction of standing leaf mass for evergreen species. Based on a maximum leaf retention time of approximately 7 years for the evergreen species, the mean leaf retention time was estimated to be 3.5 years, half the maximum. The amount of leaf mass contributing to ANPP was calculated as 3.5-1of the standing evergreen leaf mass.
Climate Data
A set of monthly mean climate data from four climate stations in Great Smoky Mountains National Park is available for this data set. Monthly mean summaries for four years (1947-1950) were taken from tables of numeric data in Stephens (1969). The four climate stations were located in Sevier County, Tennessee or in Swain County, North Carolina (Latitude 36 N, Longitude 83 W). They spanned the elevation gradient from 1,460 to 6,300 ft (445-1,920 m). The station at 1,460 ft (445 m) was located at park headquarters near Gatlinburg; the station at 3,850 ft (1,174 m) was located at the Alum Cave Bluffs parking lot; the station at 5,000 ft (1,524 m) was located near Newfound Gap; and the station at 6,300 ft (1,920 m) was located at the Forney Ridge parking area just south of the Clingmans Dome summit. Climate station sites were discussed in detail by Shanks (1954).
Data collection involved instrumentation (Shanks 1954) and field observation. Precipitation type and sky conditions were noted once a day from visual observations at each station. Other raw data consisted of hourly temperature and relative humidity, and daily precipitation amount. Missing data were filled in with interpolated estimates (Stephens 1969).
The hourly data were compiled into daily values including maximum, minimum, range and 24-hr mean. Monthly values were then computed as the sum of daily means divided by the number of days. Monthly mean values for the four-year period of study were used for this data set. Soil moisture balance calculations presented here were based on daily as well as monthly mean estimates of potential evapotranspiration. The monthly calculations were based on monthly mean temperature, monthly total precipitation, and latitude. The daily calculations were based on daily mean temperature and daily mean precipitation. Further details on data compilation methods are provided by Stephens (1969).
6. Data Access:
These data are available through the Oak Ridge National Laboratory (ORNL) Distributed Active Archive Center (DAAC).
Data Archive Center:
Contact for Data Center Access Information:
E-mail: uso@daac.ornl.gov
Telephone: +1 (865) 241-3952
7. References:
Busing, R.T., E.E.C. Clebsch, and P.S. White. 1993. Biomass and production of southern Appalachian cove forests reexamined. Canadian Journal of Forest Research 23: 760-765.
Busing, R.T. 1998. Composition, structure and diversity of cove forest stands in the Great Smoky Mountains: a patch dynamics perspective. J. Vegetation Sci. 9: 881-890.
Busing, R T. 2005. Tree mortality, canopy turnover and woody detritus in old cove forests of the southern Appalachians. Ecology 86: 73-84.
Busing, R.T., L.A. Stephens, and E. E. C. Clebsch. 2005. Climate data by elevation in the Great Smoky Mountains: a database and graphical displays for 1947-1950 with comparison to long-term data. U.S. Geological Survey Data Series Report DS 115.
Clebsch, E.E.C. & R.T. Busing. 1989. Secondary succession, gap dynamics and community structure in a southern Appalachian cove forest. Ecology 70: 728-735.
Olson, R.J., K.R. Johnson, D.L. Zheng, and J.M.O. Scurlock. 2001a. Global and Regional Ecosystem Modeling: Databases of Model Drivers and Validation Measurements. ORNL Technical Memorandum TM-2001/196. Oak Ridge National Laboratory, Oak Ridge, Tennessee, U.S.A.
Additional Sources of Information:
Olson, R.J., J.M.O. Scurlock, S.D. Prince, D.L. Zheng, and K.R. Johnson (eds.). 2012a. NPP Multi-Biome: Global Primary Production Data Initiative Products, R2. Data set. Available on-line [http://daac.ornl.gov] from the Oak Ridge National Laboratory Distributed Active Archive Center, Oak Ridge, Tennessee, U.S.A. doi:10.3334/ORNLDAAC/617
Olson, R.J., J.M.O. Scurlock, S.D. Prince, D.L. Zheng, and K.R. Johnson (eds.). 2012b. NPP Multi-Biome: NPP and Driver Data for Ecosystem Model-Data Intercomparison, R2. Data set. Available on-line [http://daac.ornl.gov] from the Oak Ridge National Laboratory Distributed Active Archive Center, Oak Ridge, Tennessee, U.S.A. doi:10.3334/ORNLDAAC/615
Shanks, R.E. 1954. Climates of the Great Smoky Mountains. Ecology 35: 354-361.
Sprugel, D.G. 1983. Correcting for bias in log-transformed allometric equations. Ecology, 64: 209-210.
Stephens, L.A. 1969. A comparison of climatic elements at four elevations in the Great Smoky Mountains National Park. M.S. Thesis, University of Tennessee, Knoxville, Tennessee.
Whittaker, R.H. 1966. Forest dimensions and production in the Great Smoky Mountains. Ecology 47: 103-121.
Whittaker, R.H. 1956. Vegetation of the Great Smoky Mountains. Ecological Monographs 26: 1-80.
8. Data Set Revisions:
Revision Summary:
The temporal coverage of this data set has been corrected to be consistent with the data collection time period in the primary published data sources (Busing et al., 1993; Busing, 1998; 2005). Biomass and ANPP values were converted from megagrams per hectare and megagrams per hectare per year to grams per square meter and grams per square meter per year, respectively, to be consistent with units of other files in the NPP collection.
Data File Changes:
Temporal coverage of this data set has been corrected. The data values in GSM_NPP_r1.csv are now correct.
| Uncorrected in GSM_NPP.csv | Corrected in GSM_NPP_r1.csv | |
|---|---|---|
| Temporal coverage | 1978-1992 | 1968-1992 |
Data User Action: If you downloaded this data set from the ORNL DAAC on-line archive before September 3, 2013, you should download it again from the ORNL DAAC.
Revision History:
Original Citation
Busing, R. T. 2005. NPP Temperate Forest: Great Smoky Mountains, Tennessee, U.S.A., 1978-1992. Data set. Available on-line [http://daac.ornl.gov] from Oak Ridge National Laboratory Distributed Active Archive Center, Oak Ridge, Tennessee, U.S.A.